Transcription
�理販售Attune NxT Flow CytometerEfficient. Flexible. Transformative.Flow cytometryinstrument
Building a legacy of advancingflow cytometry technologyNever settle for average when striving forsignificant breakthroughsTechnological advancements in flowcytometry are creating an entirely newlineage of reagents and instruments.They break the mold of traditionalproducts found in flow cytometry.Innovative flow cytometry solutionsenable research studies inacademia, pharma and biopharma,and across various industries tocreate more effective, efficient, andeconomical solutions.Thermo Fisher Scientific is committedto developing products that fuelgroundbreaking research, ensuringuncompromising quality and enablinggreater efficiency.With the industry’s largest researchand development budget, our suiteof comprehensive flow cytometrysolutions, including Invitrogen Attune NxT Flow Cytometertogether with the Invitrogen cellhealth reagent portfolio and theInvitrogen eBioscience antibodyconjugates, help drive discoveryof new biological insights formany applications.Find out more atthermofisher.com/attuneAntibodies for 10,000flow cytometry 195Attune NxT FlowCytometer citations 642original Attune citationsBiotech andbiopharmaSyntheticbiologyImmunooncology andimmunologyMicrobiologyAttune NxTFlow CytometerStem cellresearchdenotes environmentally friendly featureTranslationalresearch
ContentsExplore the Attune NxT Flow CytometerDesigned for efficiencySmooth flow delivery for accurate countsReduce clogging from difficult samples468Application highlightMinimize time with no-wash, no-lyseprotocol for blood samplesPrecision optical performance10Attune NxT AutosamplerFor even more efficiency14Flexibility to create a practical instrumentDetect the full range of fluorescenceExpand the range of performance for your violet laser161618Attune NxT SoftwareFeature-rich, researcher-inspired softwarethat performs to your specifications20Synthetic biology solutions—CRISPR22Stem cell solutions23Academic research solutionsFluorescent proteins24Microbiology research solutionsBacterial analysis26Oncology research solutions13-color human lymphocyte immunophenotyping panel27Immuno-oncology research solutions28Flow cytometry reagents29Robotic automation solutionsOrbitor RS Microplate Mover30Transforming capabilitesOptions that resonate32Aftermarket carePartner with a flow cytometry company invested insupporting you through a lifetime of research341012
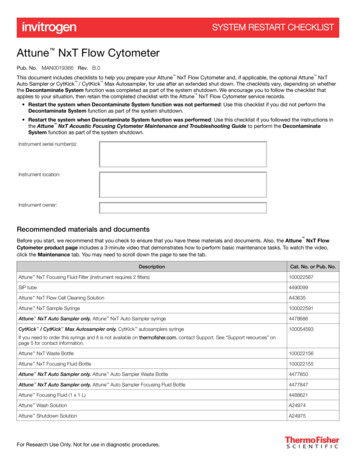
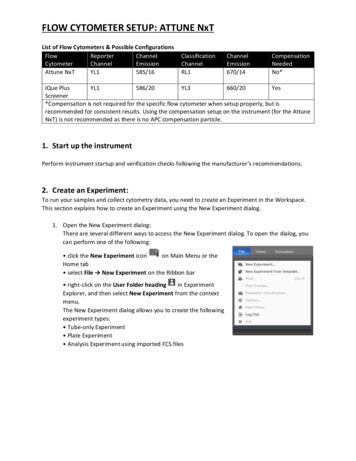
Designed for efficiencySpeed and accuracy6. AutosamplerFigure 1. The Attune NxT Flow Cytometer components. (1) Patented acoustic-assistedhydrodynamic fluidics increase sample input speed while maintaining data integrity. (2) Flat-toplasers deliver more even application of light to each cell. (3) Invitrogen Attune NxT Softwaredesigned to guide users through complex flow cytometry experiments. (4) Fluid storage designedfor minimal waste. (5) Volumetric fluidics provides cell counting and a resistance to clogging.(6) Autosampler provides easy 1-click transition from tube to plate.ABLow sample rates (10–20 µL/min)High sample rates (100–1,000 µL/min)Hydrodynamic coreHydrodynamic coreSheAcoustic-assistedhydrodynamic focusingSheathSheathTraditionalhydrodynamic mic ion)She Maximum electronic speedis 65,000 events/second withall parameters5. Volumetric fluidics4. Fluid storageShe Data acquisition speed up to35,000 events/second with34 parameters, based on a10% coincidence rate perPoisson statistics3. Attune NxT SoftwareSheathThe instrument’s speedspecifications include: Sample input flow rate ranges from12.5 to 1,000 µL/min1. Acoustic-assisted hydrodynamic focusing2. Flat-top lasersSheathTechnologyWith acoustic-assisted hydrodynamicfocusing, the Attune NxT FlowCytometer (Figure 1) avoidscompromise between data quality andhigher sample rates by uncouplingcell alignment from sheath flow.Acoustic-assisted hydrodynamicfocusing precisely aligns cells usingultrasonic radiation pressure ( 2 MHz)to transport particles into the center ofthe sample stream. This prefocusedstream is then injected into the sheathstream (Figure 2). This results in anarrow particle stream and uniformlaser illumination, regardless of thesample input rate.AcousticfieldAcoustic-assistedhydrodynamic focusingFigure 2. Acoustic focusing vs. traditional hydrodynamic focusing as particles pass throughthe laser. (A) In acoustic focusing, cells remain in tight alignment even at higher sample rates,resulting in less signal variation and improved data quality. (B) In traditional hydrodynamic focusing,increasing the sample rate results in widening of the sample core stream, resulting in increasedsignal variation and compromised data quality.4
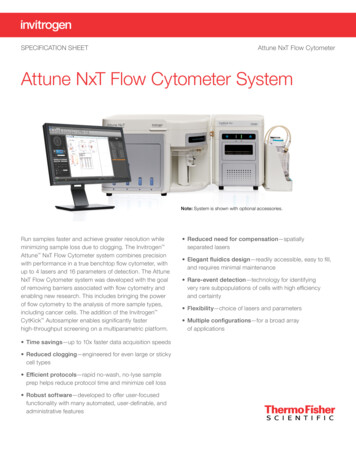
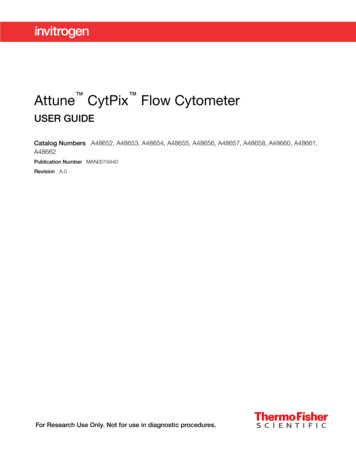
Benefits Greater reproducibility and consistency in data35,000 Maintain consistent concentration results across all flowrates (Figure 3)events/sec Process very dilute or concentrated samples whilemaintaining low coefficient of variations (CVs) (Figure 4)Up to1,000 μL/minData12.5 μL/minCV 2.99%25 μL/minCV 3.03%300100 μL/minCV 2.76%faster*200200100100100PI264500(x 103)200 μL/minCV 2.94%292250PI500(x 103)500 μL/minCV 2.70%300200200200100100100250PI500(x 103)250PI500(x 103)250PI500(x 103)1,000 μL/minCV 2.96%250PI500(x 103)Figure 3. Minimal data variation at high sample rates with theAttune NxT Flow Cytometer. Jurkat cells were fixed and stained withpropidium iodide, treated with RNase, and analyzed at a concentrationof 1 x 10 6 cells/mL at different sample rates. The left peak in all graphsreflects cells in G0/G1 phase, while the right peak reflects cells inG2/M phase. Regardless of sample rate, the width of the G0/G1 andG2/M peaks, and the CVs remain consistent, even at the highest samplerate of 1,000 μL/min.Measured concentration of10 µm beads as a function of rate10 610 510 4Expected concentration 0 1,000Flow rate (µL/min)BConcentration (beads/mL)A250No. of events10x400300Concentration (beads/mL)No. of events241200Measured concentration of3 µm beads as a function of rate10 610 510 4Expected concentration 0 1,000Flow rate (µL/min)Figure 4. Data demonstrating the measured vs. expectedconcentration as a function of flow rate. (A) Measured concentrationof 10 μm beads as a function of rate. Larger particles (e.g., 10 μm)show consistent results across the flow rate range 100–1,000 μL/min.(B) Measured concentration of 3 μm beads as a function of rate. Smallerparticles (e.g., 0.2–3 μm) show consistent concentration results across allflow rates for the three concentrations of beads/mL tested.“The ability to run very dilute samples is quite amazingand might be a life saver on many occasions whereyou have little-to-no sample left.”– J. P. Robinson, PhDPurdue University* Than traditional hydrodynamic focusing systems.5
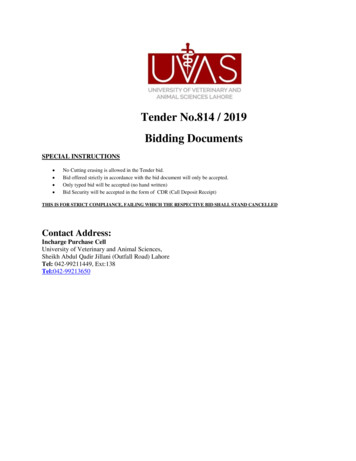
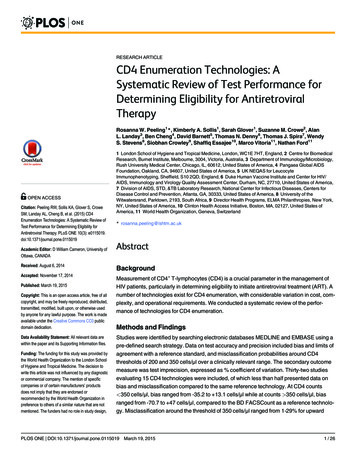
Smooth flow delivery for accurate countsThe Attune NxT Flow Cytometer delivers samples into the instrument withminimal variation (Figure 5). Smoother delivery of samples provides morePeristalticPumpvs. unting Syringedata.DataCount1,5001,000Cell countingspreadA1,000500500PeristalticPump vs. Positive Displacement SyringeBLymphocytes91.9010 210 310 41,000Side scatter (x 10 3)Time vs. count plots showing a movingaverage of the number of eventsSide scatter (x 10 3)A500CD3 –: 29.6010 50CD45 Pacific Orange fluorescence (VL1)02468C10 12 14 1610CD8 PE-Cy7fluorescence (YL4)Time (10 6)B10 6Time vs. count plots showing a movingaverage of the number of events1,500Count10 610 510 4CD4: 42.0001,000DCD8: 16.9510 410 5 10 6CD4 Alexa Fluor 488 fluorescence (BL1)10 410 5 10 6CD3 APC fluorescence (RL1)CD19 Pacific Bluefluorescence (VL1)0CD3 : 62.2CD19: 8.9CD56: 17.210 40–10 3010 310 4 10 5 10 6CD56 PE fluorescence (YL1)Cell countingspread500 00246 8 10 12 14 16Time (10 6)Figure 5. Time vs. count plot to obtain a moving average of thenumber of events showing up at a given time. (A) Data from a flowcytometer with a peristaltic pump, showing fluid pulsation 33% of theaverage count and a total spread of 66% of the average count. (B) Timevs. count data from Attune NxT Flow Cytometer with a non-peristalticpump, showing fluid pulsation of 5%.TechnologySamples on the Attune NxT Flow Cytometer are deliveredby a positive-displacement syringe pump for volumetricanalysis meaning that all events are automaticallycounted, and particle counts or concentrations canbe viewed with the simple click of a button. Figure 6shows the scatter plots and cell concentrations for alllymphocyte subpopulations.6-Figure 6. Lymphocyte subset analysis. A 100 μL aliquot of normalhuman whole blood was labeled with fluorophore-conjugated antibodiesagainst CD surface markers, followed by red blood cell (RBC) lysisusing 2 mL of Invitrogen High-Yield Lyse Fixative-Free LysingSolution (Cat. No. HYL250), resulting in a 1:21 dilution of the blood.(A) Lymphocytes are identified on a density plot of CD45 vs. side scatterwith an oval gate around the lymphocyte (CD45 ) population. (B) Cellsin the lymphocyte gate are displayed on a density plot of CD3 vs. sidescatter. Rectangle gates surround the CD3 T cell and CD3 – B andnatural killer (NK) cell populations. (C) Cells in the CD3 gate are thendisplayed on a density plot of CD4 vs. CD8 to quantify CD4 helper Tcells (CD4 CD3 CD45 ) and CD8 cytotoxic T cells (CD8 CD3 CD45 ).(D) CD3 – cells are displayed on a density plot of CD56 vs. CD19 todistinguish CD56 NK cells from CD19 B cells. The statistics table showsthe gating and measured concentrations (cells/μL).
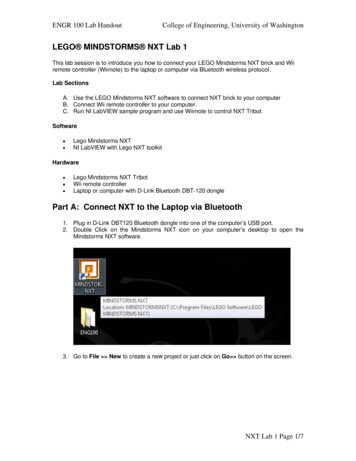
Benefits Syringe easily removed for cleaning or replacement Consistent cell concentration results across all flow rates(Figure 7) Precise counts without the need for expensive beadsTipsUseful for samples that are inherently lowin concentration, such as cerebrospinalfluid (CSF), and stem cell samples with lowcell numbers.25100 µL/min200 µL/minConcentration (cells/µL)20500 µL/min151050CD4 CD8 CD19 CD56 Figure 7. Replicate samples collected at three flow rates on theAttune NxT Flow Cytometer. Cell concentrations were measuredusing three different flow rates: 100, 200, and 500 μL/min. The AttuneNxT Flow Cytometer provides similar concentration measurements foreach lymphocyte subpopulation, regardless of the flow rate. Each barrepresents the mean cells/μL standard deviation of three samples run ateach indicated flow rate for each population.7
Reduce clogging from difficult samplesYour research samples are precious as they are oftendifficult to produce. The Attune NxT Flow Cytometer is lessprone to clogging, allowing challenging samples such ascardiomyocytes, heterogeneous blood cells, and cancercells to flow with confidence.TechnologyEngineered to actively resist clogging, a syringe-drivensystem (Figure 8) and larger flow cell help prevent theloss of precious sample such as cancer stem cells fromprimary pancreatic tumors (Figure 9), and is drasticallyless susceptible to clogs. The Attune NxT Flow Cytometeremploys a non-pressurized system that mechanicallydecreases the occurrence of clogging.Benefits Easy flow of difficult samples such as large or sticky cells Sample recovery feature built into software Comparatively lower fluid consumption ( 1.8 L/day)Focusing fluidreservoirValve1 mL samplesyringeFigure 8. Positive-displacement syringe pump. Syringe easilyremoved for cleaning or replacement.8TipsThe higher the flow rate a sample is run onthe Attune NxT Flow Cytometer, the lowerthe amount of sheath fluid that is used“We have yet to clog the machine with our debris-richprimary tumor samples. Of course, the acoustictechnology greatly facilitates the identification of smallpopulations, like cancer stem cells, increasing ourcapacity to detect and quantify these rare events withhigh efficiency and reliability.”– Bruno Sainz Jr, PhDAutónoma University of Madrid, School of Medicine
DataB1M800K400K200K400K600K800K1MD1M1M10 5800K800KSSC-ASSC-ASSC-ASSC-ASSC-ADAPI4400K10 3400K200K200K10 200000Debris-freeLiveSingle10 2200K200K10 510 K600K600KFSC-AFSC-AAutofluorescence600K10 3400K10 2200K0400K400K400K0010 210 2200K10 510 310410 310410 5400K600K800K1MCD90-APCEpCAM-APCFSC-A800K104600K10 3400K10 2200K00Debris-freeDebris-free0010 210 210 310 3104104AutofluorescenceCD90-APC10410 310 200 10 220 1010 3310104410AutofluorescenceCD90-APC10 reeDebris-freeLive200K200K10 00K1M1M1M00010 0K600KAutofluorescenceSSC-A400K0 00SingleUngatedFSC-AUngated10 5510600K10 310 2200K00ESSC-ADAPIDAPIFSC-HFSC-H600K01M1M10 5800K800K104200KC1M5101MAutofluorescenceSSC-AA10 210 310410 5AutofluorescenceFigure 9. The Attune NxT Flow Cytometer detects autofluorescent and CD90 rare cancer stem cells from primary pancreatic tumorswithout clogging. Tumors were minced and enzymatically digested with collagenase, followed by an overnight incubation with 30 μM riboflavin inRPMI medium with 10% FBS. Cells were then blocked with flebogamma and stained with anti-EpCAM or anti-CD90 antibodies. (A–C) Single, live,and debris-free cell gating strategy. (D) EpCAM , (E) CD90 , and (F) autofluorescence-positive cells within the tumor population. Data courtesyBruno Sainz Jr, PhD.9
Application highlightImproved data resulting from less trauma to cellsAcoustic focusing allows the Attune NxT Flow Cytometerto deliver a no-wash, no-lyse protocol (Figure 10) tominimize cell loss, significantly reduce time, and simplifysample preparation.“Multiplexing and compensation are much easier andextremely efficient with the Attune NxT.”– Bruno Sainz Jr, PhDAutónoma University of Madrid, School of MedicineBenefits Improve lab safety with reduced sample handling withno-wash protocol Completely cut out time-consuming centrifugation steps Save countless hours running dilute samples and reducereagent costs Eliminate cell loss due to wash steps or RBCremoval procedure Ideal for limited sample volumes and for functionallive-cell assays (Figure 11)ProtocolGeneric sample preparation workflowSingle-cellsuspension(5–10 min)Wash(5–10 min)Lyse(30–60 min)Wash(5–10 min)Stain(15–30 min)Wash(5–10 min)Analyze65–130 minNo-wash, no-lyse sample preparation workflowSingle-cellsuspension(5–10 min)Stain(15–30 min)DiluteUp toAnalyze10x faster*65%reduction inprep time20–40 min* Compared to conventional cytometers.Figure 10. No-wash, no-lyse sample preparation workflow.10
DataAll eventsSSC-H blue 488 nmVL1-H - violet 405 nm SSCSSC-H blue 488 nmWBCs: 5.7%PLT WBC: 4.7%RBC: 93.8%Platelets: 93.8%Noise: 1.3%SSC-H blue 488 nmFSC-HAll eventsEVL1-H - Violet 405 nm SSCAll eventsDPLT WBCCSSC-H blue 488 nmVL1-H - violet 405 nm SSCBVL1-H - violet 405 nm SSCAll eventsAWBCs: 5.7%PLT: 4.4%RBC: 93.8%Noise1: 1.3%SSC-H blue 488 nmFigure 11. Forward scatter (FSC) and side scatter (SSC) analysis with blue (488 nm) and violet (405 nm) lasers on intact whole blood (no-lyse,no-wash). (A, B) RBCs, white blood cells (WBCs), and platelets are separated on the basis of light scatter only by using a combination of blue andviolet laser SSC analysis. Hemoglobin in RBCs readily absorbs light at 405 nm, shifting the RBC population to the right by reducing the SSC for RBCsin the violet laser channel relative to leukocytes and platelets. Dual FSC and SSC threshold is set low enough to show instrument noise, ensuringthe full platelet population is visualized. (C) Using the gate that includes WBCs and platelets, a standard plot of FSC vs. 488 nm SSC can be usedto distinguish the platelet population from the WBCs with regions created around the two populations. (D) Using color-backgating on plot (A), theRBC population is colored red, the platelet population is colored green, and the WBC population is colored blue, while the noise is black. The threemain WBC populations of lymphocytes, monocytes, and granulocytes can be distinguished. (E) Placing regions around the RBC, WBC, and plateletpopulations show the dominant cell type in whole blood is the RBC, while the WBCs and platelets are relatively rare events.11
Precision optical performanceMinimize instrument downtime with the Attune NxT opticalsystem. The Attune NxT lasers are designed to last thelife span of a flow cytometer and provide a wider area oflight intensity.ABCV 1.1CV 8Gaussian: alignedGaussian: misalignedCDCV 1.7CV 1.1Flat-top: alignedFlat-top: still alignedFigure 12. Emission profiles of lasers used in flow cytometers.(A) Gaussian laser profile with proper alignment, (B) Gaussian laserprofile with misalignment, (C) flat-top laser profile with proper alignment,and (D) flat-top laser profile still in proper alignment.12TechnologyThe Attune NxT Flow Cytometer uses flat-top lasers withan intensity profile that allows a much wider window ofalignment (Figure 12). This innovative design helps ensureprecise fixed alignment of 4 spatially separated solid-statelasers onto the sample stream (Figure 13), minimizing theeffects of changes in fluidics or optics. The stability of theoptical system leads to increased data consistency overtime, superior performance, and first-class reliability.Figure 13. The Attune NxT Flow Cytometer can be configured withup to 4 spatially separated lasers.
Benefits No warm-up delay: fiber isn’t affected by instrumentwarm-up Simmer mode: automatic shutoff prolongs laser usagelifetime up to 10x Lasers are only turned on when acquiring samples“Having evaluated the instrument over several months,I would say the Attune NxT Flow Cytometer fits thesuperior category of flow cytometers.”– J. P. Robinson, PhDPurdue University13
Attune NxT AutosamplerFor even more efficiencyImprove workflow efficiency with the high-throughputoption—the Invitrogen Attune NxT Autosampler. Built-incompatibility switches between tubes and plates with asingle click in the Attune NxT Software. The Attune NxTAutosampler is compatible with many different plateformats, including 96-well, 384-well, and deep-well plates.The system is designed to provide minimal variationregardless of sampling method (tube vs. plate) andcollection rate (Figures 14 and 15).“The dual tube-to-plate operation—instant change fromtubes to plates is really an excellent feature.”– J. P Robinson, PhDPurdue UniversityTechnologyAcquisition time* 42 min for 96-well plate 180 min for 384-well plateCarryover 0.5% in “Plate Loader” format—standard mode,2 wash cycles Ultralow carryover—multiple rinse capabilityExtended fluidics option Optional external fluid tank with 10 L fluid capacity.* Using one rinse and one mix (aspiration) and full analysis of a 40 μL sample.Benefits One-click transition from tubes to plates usingAttune NxT Software Performs automated cleaning when the instrument isshutting down Mixes sample by aspiration instead of shaking, ensuringhomogeneity of the sample and maintenance ofcell viability“We looked at several metrics and compared theAttune NxT Autosampler to other 96-well plate readers.The autosampler proved to have very good stabilityand very low carryover. We were most impressedby the way that the autosampler took advantage ofthe Attune NxT Flow Cytometer’s fluidics and highvolume throughput. Without compromising stability orprecision, the autosampler was able to run plates muchfaster than any other plate reader.”– E. M. MeyerUniversity of Pittsburgh Cancer Institute14
DataA Tube103-103106105104103-103-103 103 -103 1031044 51010106105CD4 FITCCD4fluorescenceFITC fluorescence106105104103-103106CD8 R -PE fluorescence104106CD8 R -PE fluorescence105CD8 R -PE fluorescenceCD8 R -PE fluorescence106B Plate105104103-103-103 103 -103 1031041045106105106CD4 FITCCD4fluorescenceFITC fluorescenceFigure 14. Consistent results are achievable regardless of sampling method. Whole blood lysed with ammonium chloride was labeled withInvitrogen mouse anti–human CD45 Pacific Orange , mouse anti–human CD4 FITC, and mouse anti–human CD8 R-PE antibody conjugates. Labeledsamples were analyzed on a blue and violet laser–configured Attune NxT Flow Cytometer equipped with a 488 nm laser for fluorescence excitation ofFITC (530 BP) and R-PE (574/24 BP), and a 405 nm laser for Pacific Orange dye (603/48 LP). Identical samples, including compensation controls, wereanalyzed using either (A) tube mode or (B) plate mode with a standard collection rate of 200 μL/min. Lymphocytes were gated using a CD45 vs. sidescatter plot and analyzed for expression of CD4 and CD8 antigens. Minimal variation was observed between analysis in a tube alone and on a platerunning on the Attune NxT Autosampler.ABFigure 15. Consistent well-to-well results: the Attune NxT Autosampler heat-map function identifies variation within a parameter across a96-well plate. Live and heat-killed THP-1 cells were stained with 2 μg/mL propidium iodide, dispensed into a 96-well V-bottom plate, and run at astandard collection rate of 500 μL/min with 2 mix cycles per well and 2 rinse cycles between wells. Propidium iodide was excited using a 488 nm laser(640 LP). (A) On the heat map, a color gradient graphically represents the percentage of propidium iodide–positive cells (dead cells). Red-coloredwells indicate 0% propidium iodide–positive cells (live cells) within the sample analyzed from that well; magenta-colored wells indicate a samplecontaining 100% propidium iodide–positive cells. (B) The values overlaid on each well in the heat map are the measured percentages of dead cells inthe individual wells. Minimal variation is observed in propidium iodide fluorescence across each row of the entire plate, with a CV of 1.44% for the entiredata set (96 wells).15
Flexibility to create a practical instrumentDetect the full range of fluorescenceThe Attune NxT Flow Cytometer accommodates up to14 color panels. The filter and laser are configurable andfield upgradable, giving the freedom to upgrade up to 4lasers and 16 detection channels (Tables 1 and 2).“The problem now is not finding the needle in thehaystack, but deciding which haystack to look at.”– Prof. Andrea CossarizzaUniversity of Modena, ItalyTable 1. The Attune NxT Flow Cytometer system configurations.Lasers1234LaserconfigurationCat. No.BlueBlue488 nmYellow561 nmGreen532 nmRed637 nmA24864Available asupgrade4Available asupgradeAvailable asupgradeAvailable asupgrade6Blue/greenA28995Available asupgrade3–4Available asupgrade9Blue/yellowA24861Available asupgrade34–Available asupgrade9Blue/redA24863Available asupgrade4Available asupgradeAvailable asupgrade39Blue/violetA2486244Available asupgradeAvailable asupgradeAvailable asupgrade10Blue/violet 6A2900263Available asupgrade–Available asupgrade11Blue/green/redA28997Available asupgrade3–4312Blue/red/yellowA28993Available lable asupgrade13Blue/violet/yellowA24859434–Available asupgrade13Blue/red/violetA2486044Available asupgradeAvailable asupgrade313Blue/red/violet 6A2900363Available low/violet 6A29004623–316* Includes forward scatter (FSC) and side scatter (SSC).16Totaldetectionchannels*Violet405 nm
Up to16Benefits Field upgradeability to accommodate expanding needsUp to Use more lasers for expanded multicolor panel design options Use less reagentsUp toparameters4lasers14colorsTable 2. The Attune NxT Flow Cytometer filter configurations.Cat. 001A24858477779101011111112141414530/30Emission filter 80/60Figure 16. The optical filters in the Attune NxT Flow Cytometerare user-exchangeable, easily slotted in and out of the opticalbench to maximize your capacity.17
Expand the range of performance for your violet laserThe Attune NxT Flow Cytometer is easily upgradableto 6-channel detection for the violet (405 nm) laser(Table 3). The Attune NxT Flow Cytometer with violet6 channel configuration is designed to accommodatea wide variety of experimental conditions. Combinedwith the Invitrogen Super Bright and other appropriatedyes, the system provides expanded choices for paneldesign (Table 4). See available Super Bright dyes atthermofisher.com/superbrightBenefits Modular expansion options for growth when needed,not before Facilitate application development with fewer restrictionson fluorochrome detectors Enhanced capability to perform a variety of applicationson a single instrumentDownload the poster at: thermofisher.com/attune-14CTechnologyTable 3. Attune NxT Flow Cytometer configurationusing 6 fluorescence detectors for the violet laser.All events10 6Fluorescence detectors2-laser3-laser4-laserViolet, 405 nm666Blue, 488 nm332Yellow, 561 nmNANA3Red, 637 nmNA33Total fluorescence detectorsavailable91214Total parameters perconfiguration*111410 5SSC-HLaser10410 010 010110 210 310410 510 6FSC-H16Figure 17. FSC and SSC discrimination of 0.2 µm, 0.5 µm, and0.8 µm particles using the Submicron Bead Calibration Kit fromBangs Laboratory.* Includes FSC and side scatter SSC.Table 4. Fluorophore guidelines for the 6 fluorescence detectors off the violet laser in the Attune NxTFlow Cytometer.DetectorBandpass (nm)Fluorophores*VL1450/40Super Bright 436, eFluor 450, LIVE/DEAD Fixable Violet, Vybrant DyeCycle Violet,SYTOX Blue, CellTrace Violet, VioBlue , Brilliant Violet 421, Pacific Blue , BDHorizon V450VL2525/50eFluor 506, LIVE/DEAD Fixable Aqua, CFP, VioGreen , Brilliant Violet 510, PacificGreen , BD Horizon V500VL3610/20Super Bright 600, LIVE/DEAD Fixable Yellow, Qdot 605, Pacific Orange , BrilliantViolet 605VL4660/20Super Bright 645, Brilliant Violet 650VL5710/50Super Bright 702, Qdot 700, Brilliant Violet 711VL6780/60Brilliant Violet 786* List is not inclusive of all available fluorophores.18
Violet laser for small-particle detectionThe Attune NxT Flow Cytometer can be configuredwith optional violet side scatter for better small-particleresolution. With optimal fluorescence sensitivity and upto 16-parameter detection capability on particle sizes assmall as 0.2 µm (Figure 17), the Attune NxT Flow Cytometersupports a large variety of multiparameter applications(Figure 18).DataFSC-A (10 3)HFSC-H (10 3)FCD4 CD45RA PerCP-Cy5.5—BL2CD25 Super Bright 702—VL5Viability-Fixable Near-IR—RL3SSC-H (10 3)GCD4 CD127 Brilliant Violet 510—VL2 CD196 Super Bright 436—VL1CD45RA CD196—CD183 eFluor 600—RL1-ICD45RA CD196- CD194 PE-Cy7—YL3DSinglet 2CD3-Super Bright 645—VL4Live CD3 CD8 Alexa FLuor 700—RL2JCD4 CD278 (ICOS)CD4 CD134 (OX40)CD4 CD279 (PD-1)CD4 CD223 (LAG-3)CD183 eFluor 600—RL1ESinglet 1CD4-Super Bright 600—VL3SSC-A (10 3)CLive cellsSSC-A (10 3)BAll eventsSSC-A (10 3)ACD194 PE-Cy7—YL3KCD8 CD278 (ICOS)CD8 CD134 (OX40)CD8 CD279 (PD-1)CD8 CD223 (LAG-3)LAll eventsLive cellsSinglet 1Singlet 2Live CD3 CD4 CD25 CD127— (Treg)CD45RA—CD196—CD194—CD183 (Th1)CD194 CD183— (Th2)CD45RA—CD196 CD194 CD183— (Th17)CD45RA CD196—CD4 CD223 CD4 CD278 CD4 CD134 CD4 CD279 CD8 CD8 CD223 CD8 CD278 CD8 CD134 CD8 CD279 Figure 18. T lymphocyte immunophenotyping: 14-color flow cytometry panel design using the Attune NxT violet 6 channel option andSuper Bright fluorescent dyes gating strategy. (A) A region is placed around live peripheral blood mononulcear cells (PBMCs) as identified by theInvitrogen LIVE/DEAD Fixable Near-IR Dead Cell Stain Kit. (B, C) Live cells are analyzed through sequential singlet gating. A region is then placed onthe (D) CD3 population for gating on (E) CD4 and CD8 populations. The CD4 population is used to gate on (F) CD127 vs. CD25, for (G) CD45RAvs. CD196, and (J) CD278, CD134, CD279, and CD223 populations. The CD45RA –/CD196 – population from (G) is gated on (H) CD183 vs. CD194. TheCD45RA –/CD196 population from (G) is gated on (I) CD183 vs. CD194. The CD8 population from (E) is used for gating (K) CD278, CD134, CD279,and CD223 populations. (L) The entire gating strategy is displayed in hierarchical format using the Attune NxT violet 6 channel option and v2.6 softwarefor easy visualization.19
Attune NxT SoftwareFeature-rich, researcher-inspired software that performsto your specificationsThe Attune NxT Software was masterfully developed tooffer user-focused functionality with many automated,user-definable, and administrative features to providepowerful data acquisition and analysis simple enough forusers at any experience level (Figure 19).Speed Increase productivity with live-streaming update ofstatistics during acquisition of events Fast refresh rates for large data sets of up to 20 millionevents per sample with option to appendGuided functionality Automated maintenance: “Startup”, “Shu
Explore the Attune NxT Flow Cytometer Designed for efficiency 4 Smooth flow delivery for accurate counts 6 Reduce clogging from difficult samples 8 Application highlight 10 Minimize time with no-wash, no-lyse protocol for blood samples 10 Precision optical performance 12 Attune NxT Autosampler 14 For even more efficiency