Transcription
FLOW CYTOMETER SETUP: ATTUNE NxTList of Flow Cytometers & Possible missionAttune n670/14CompensationNeededNo*iQue PlusYL1586/20YL3660/20YesScreener*Compensation is not required for the specific flow cytometer when setup properly, but isrecommended for consistent results. Using the compensation setup on the instrument (for the AttuneNxT) is not recommended as there is no APC compensation particle.1. Start up the instrumentPerform instrument startup and verification checks following the manufacturer’s recommendations.2. Create an Experiment:To run your samples and collect cytometry data, you need to create an Experiment in the Workspace.This section explains how to create an Experiment using the New Experiment dialog.1. Open the New Experiment dialog:There are several different ways to access the New Experiment dialog. To open the dialog, youcan perform one of the following: click the New Experiment iconon Main Menu or theHome tab select File New Experiment on the Ribbon bar right-click on the User Folder headingin ExperimentExplorer, and then select New Experiment from the contextmenu.The New Experiment dialog allows you to create the followingexperiment types: Tube-only Experiment Plate Experiment Analysis Experiment using imported FCS files
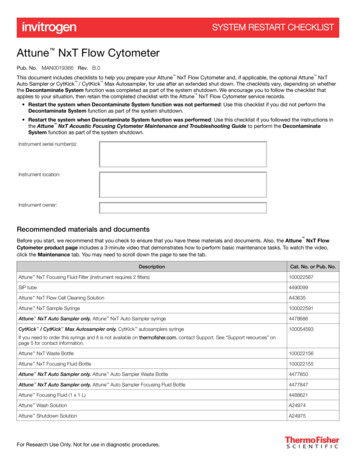
The contents of the New Experiment dialog changes, dependingon the experiment type you select. For more information onthe New Experiment dialog, refer to the Attune NxT SoftwareUser Guide.Note: The New Experiment option is enabled only when theinstrument is not acquiring.Create a Plate Experiment:A Plate Experiment includes one plate, and can also include tube groups and tube samples.1. From the Experiment type dropdown menu on the New Experiment dialog, select Plate.2. Accept the default plate name, or enter a new name.3. From the Plate type dropdown menu, select the type of plate that you are using for theexperiment and enter the plate ID.4. Accept the default workspace and default instrument settings.5. If you are including tubes, enter the number of tube groups tocreate for the experiment.6. If you are including tubes, enter the number of tube samples to create for each tube group.7. Click OK to create the new experiment and close the New Experiment dialog.Note: Plate Experiment function is not available in early access instruments; it will be available with thenext software update.3. Setup the PMT voltagesNOTE: These instructions have been optimized for the plate reader versus single tubes.NOTE: Previously, the optimal voltages for each detection channel were determined using a voltage walkusing capture beads stained with antibodies detected in each channel. These voltages may differ slightlybetween instruments.oooVortex the vial of ‘Raw Beads’ for 30 second to resuspend the beads. To ensure minimal aggregates were present, we prepared beads by water bathsonication for 5 minute, followed by a 1 minute vortex. As you can visualize in Figure 1 & 2, we were able to decrease the debris and aggregatesto their lowest levels ( 5%) using this increased water bath sonication time, denoting itsimportance.Transfer 300 uL of the ‘Raw Beads’ to an empty plate well.Set the flow cytometer flow rate to ’25 ul/min’. The sample volume can be set to 200 uL (240uLdraw) to take up most of the sample well.
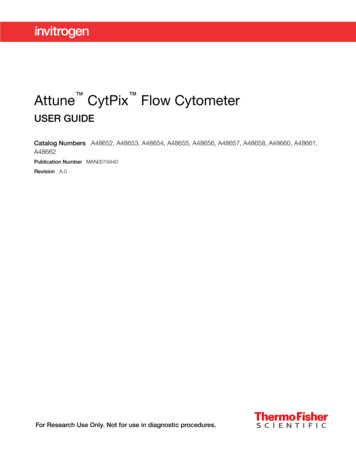
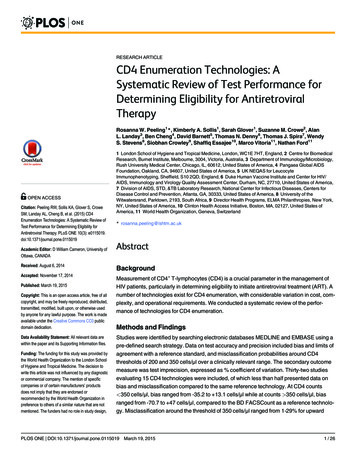
oIf you are confirming instrument setup, as in later runs, you can also use ‘100 uL/min’without a change. This simply allows for more time change the instrument settings ifneeded before running through your sample.Run the ‘Raw Beads’. Adjust the FSC and SSC voltage settings so that both beads populations arevisible (Figure 1 & 2). The best separation of the bead populations, even at higher flow rates, was found to beat least roughly 200K apart without affecting the spread of the bead population(s). The beads presented were run at a flow rate of 100 uL/min. In Figure 1, the median FSC-A is 385k and 640k for Beads A and B, respectively. In Figure 2, the median FSC-H is 370k and 573k for Beads A and B, respectively.Figure 1. FSC-A vs. SSC-A representation of ‘RawBeads’. The instrument in this figure were set toa FSC of 300v and SSC of 280v.ooFigure 2. FSC-H vs. SSC-H representation of ‘RawBeads’. The instrument in this figure were set toa FSC of 300v and SSC of 280v.Move the gates for beads A and Beads B so that the smaller beads fall into Beads A gate and thelarger beads fall into Beads B gate.Adjust the FITC setting so that the FITC signal for the majority of beads in between 1 x 10² and 1x 10³ (Figure 3 & 4).
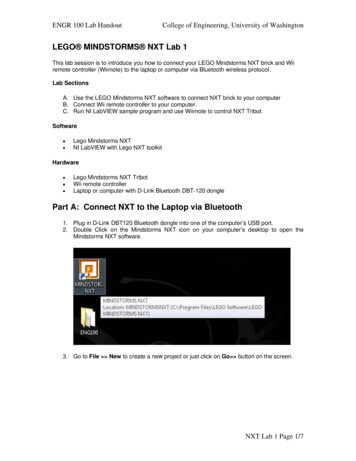
Figure 3. BL1-A vs. RL1-A representation of ‘RawBeads’. The instrument in this figure were set toa BL1 of 375v and RL1 of 325v. The gate incudesboth Beads A and Beads B.oAdjust the PE setting so that the PE signal for the majority of beads in between 1 x 10² and 1 x10³ (Figure 5 & 6).Figure 5. YL1-A vs. RL1-A representation of ‘RawBeads’. The instrument in this figure were set toa YL1 of 350v and RL1 of 325v. The gate incudesboth Beads A and Beads B.oooFigure 4. BL1-H vs. RL1-H representation of ‘RawBeads’. The instrument in this figure were set toa BL1 of 375v and RL1 of 325v. The gate incudesboth Beads A and Beads B.Figure 6. YL1-H vs. RL1-H representation of ‘RawBeads’. The instrument in this figure were set toa YL1 of 350v and RL1 of 325v. The gate incudesboth Beads A and Beads B.Adjust the APC setting so that the APC signal for the majority of beads in between 4 x 10 3 and 7x 10⁵ (Figure 5 & 6).This setup can be saved as a template for future runs.While the FITC and PE Beads are not required for uncompensated runs, additional images areincluded below to show the bead populations for FITC Raw Beads (Figure 7 & 8) and PE RawBeads (Figure 9 & 10). Recall that only Beads A are utilized in the FITC and PE samples, thus, onlya single population of the four populations will show increase fluorescence.
Figure 7. BL1-A vs. RL1-A representation of ‘RawBeads’ & ‘FITC Beads’ mixed 1:1. The instrumentin this figure were set to a BL1 of 375v and RL1 of325v. The gate incudes both Beads A and BeadsB.Figure 8. BL1-H vs. RL1-H representation of‘Raw Beads’ & ‘FITC Beads’ mixed 1:1. Theinstrument in this figure were set to a BL1 of375v and RL1 of 325v. The gate incudes bothBeads A and Beads B.CV% of ( ) population 16.4%rCV% of ( ) population 18.3%CV% of ( ) population 16.1%rCV% of ( ) population 17.9%Figure 9. YL1-A vs. RL1-A representation of ‘RawBeads’ & ‘PE Beads’ mixed 1:1. The instrument inthis figure were set to a YL1 of 350v and RL1 of325v. The gate incudes both Beads A and BeadsB.Figure 10. YL1-H vs. RL1-H representation of‘Raw Beads’ & ‘PE Beads’ mixed 1:1. Theinstrument in this figure were set to a YL1 of350v and RL1 of 325v. The gate incudes bothBeads A and Beads B.CV% of ( ) population 9.7%rCV% of ( ) population 9.9%CV% of ( ) population 9.2%rCV% of ( ) population 9.5%
4. Notes on sample analysis If you are running the sample in the provided kit filter plate with the sample resuspended in150uL. If you want to run the sample twice, or reserve volume in case it needs to be re-run,set the sample run volume to 40uL. Due to the dead volume of the needle, this will draw70uL of sample total.
Attune NxT YL1 585/16 RL1 670/14 No* iQue Plus Screener YL1 586/20 YL3 660/20 Yes *Compensation is not required for the specific flow cytometer when setup properly, but is recommended for consistent results. Using the compensation setup on the instrument (for the Attune NxT) is not recommended as there is no APC compensation particle. 1. Start .