Transcription
The next generation inflow cytometryAttune NxT Flow Cytometer—expand your research capabilitieswith acoustic focusing technology
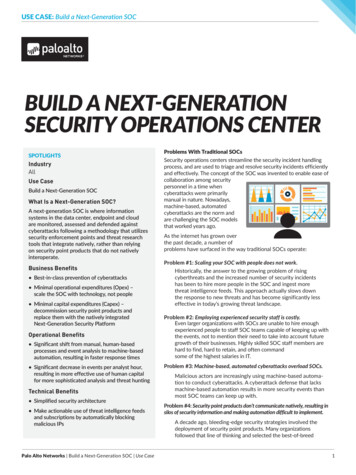
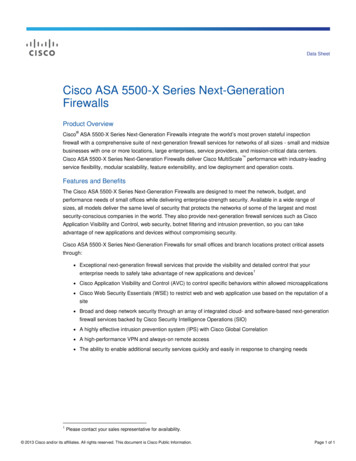
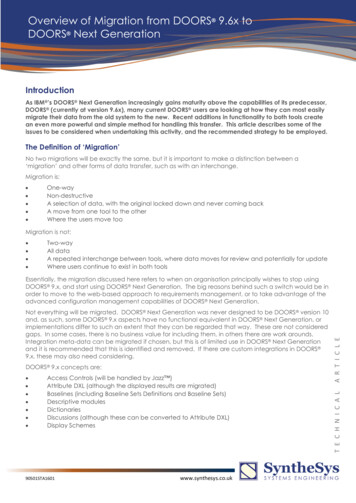
Small in size but big in performanceAttune NxT Flow Cytometerand AutosamplerCombining precision with performance, the Invitrogen Attune NxT Flow Cytometer is a benchtop analyzerconfigurable with up to 4 lasers and 16 parameters whileoffering superior speed (up to 10x faster than traditionalflow cytometers) and clog-resistant engineering (Figure 1).Convert between tubes and plates in seconds and leveragecomplete walkaway automation of 96- or 384-well plateswith the robotic automation capable Invitrogen Attune NxT Autosampler. Together, these systems were designedto help researchers gather data like never before andachieve superior results.Footprint (H x W x D): 16 x 23 x 17 in. (40 x 58 x 43 cm)Figure 1. Front view featuring the light panel and tube loader of theAttune NxT Flow Cytometer.Weight: 64 lb. (29 kg)Electrical requirements: 100–240 VAC, 50/60 Hz, 150 WAll fluids are stored within the instrument (Figure 2) andinclude active level sensors. Flashing lights are displayedwhen fluid levels are low (or high, for the waste tank),allowing users to identify fluid level issues from acrossthe lab.Standard fluid tanks: 1.8 L focusing fluid tankFigure 2. The Attune NxT Flow Cytometer with front door open,revealing the fluid storage containers. 1.8 L waste tank 175 mL shutdown solution tank 175 mL wash solution tankExternal fluid tank option: Configuration for 10 L of fluid (Figure 3) Nominal fluid consumption of 1.8 L/dayFigure 3. Optional external fluid tank with 10 L fluid capacity.2
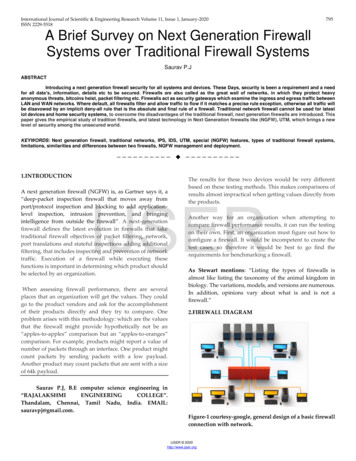
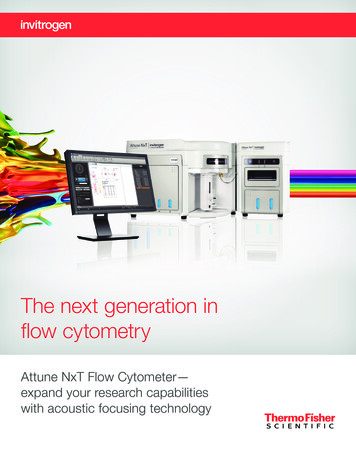
High sensitivity at all sample ratesForward and side scatter resolutionThe Attune NxT Flow Cytometer is designed to discriminateplatelets from noise and is optimized to resolvelymphocytes, monocytes, and granulocytes in lysed wholeblood (Figure 6).The Attune NxT Flow Cytometer enables higher sensitivitywhen you need it most. The system maintains precisealignment, thanks to the acoustic focusing, even at samplerates of up to 1,000 μL/min.Data acquisition rateThe Attune NxT Flow Cytometer is designed to acquiredata at up to 35,000 events/second.Multi-peak fluorescent microspheres are often used in flowcytometry to determine the sensitivity of an instrument.Figure 7 demonstrates the higher sensitivity of the AttuneNxT Flow Cytometer compared to flow cytometers thatuse conventional hydrodynamic focusing at both low(12.5 µL/min) and high (500 µL/min) sample input rates.Particle size rangeThe Attune NxT Flow Cytometer is designed to detectparticles with diameters from 0.5 µm to 50 µm. Figure4 demonstrates its ability to distinguish small particles,sometimes less than 0.5 µm.Predicted molecules of equivalent soluble fluorochrome(MESF):Fluorescence resolutionThe Attune NxT Flow Cytometer is designed to have acoefficient of variation (CV) of less than 3% for the singletpeak of chicken erythrocyte nuclei stained with propidiumiodide (Figure 5). 80 MESF (FITC) 30 MESF (PE)SSCSSC 70 MESF 1102100103 101YL2-AYL2-A104 102105 103 101YL2-AConventional flow cytometer(highest sensitivity 12.5 μL/min)104 102105 103102YL2-A100104103105104 102YL2-A100105 103106 104 102YL2-AYL2-A800800750750500250105 1036 24101010YL2-AAttune NxT Flow Cytometer(12.5 μL/min)75050025010103 5800No. of events100200No. of events200C200No. of events100200300BNo. of events200300No. of events300200Figure 6. FSC and SSC parameters can beused to identify lymphocyte, monocyte,and granulocyte populations in ammoniumchloride–lysed whole blood.No. of events400400No. of eventsNo. of eventsNo. of events400No. of eventsAFSCFigure 5. Chicken erythrocyte nuclei stainedwith propidium iodide and analyzed at asample rate of 100 µL/min.No.No.ofofeventseventsFigure 4. Forward scatter (FSC) and sidescatter (SSC) discrimination of 0.2 µm,0.5 µm, and 0.8 µm particles.10104 6102YL2-A500250105 103106 104 102YL2-A105 103106 104105106YL2-AYL2-AAttune NxT Flow Cytometer(500 μL/min)Figure 7. Sensitivity measurements across flow rates. Fluorescent microspheres (Spherotech Rainbow Calibration Particles, 3.2 μm) were run on(A) a high-end conventional flow cytometer and (B, C) on the Attune NxT Flow Cytometer using a 561 nm laser and (A) 610/20 or (B, C) 610/15 emissionfilters. The conventional cytometer was run using the highest sensitivity setting ( 12.5 μL/min). The Attune NxT Flow Cytometer was run at (B) 12.5 μL/min,which is equivalent to the traditional flow cytometer and at (C) 500 μL/min, a 40x increase in sample flow rate. The Attune NxT Flow Cytometer showedequal or better results even at the highest flow rates.3
What is acoustic focusing?Sample input rates: 12.5 µL/min to 1 mL/min, up to 10 times faster thantraditional hydrodynamic focusing systems241264200 µL/min12.5 µL/min200No. of events200No. of eventsThe Attune NxT Flow Cytometer uses ultrasonic waves(over 2 MHz, similar to those used in ultrasound medicalimaging), in combination with hydrodynamic forces, toposition cells into a single, focused line along the centralaxis of a capillary (Figure 8). Acoustic focusing is largelyindependent of the sample input rate, enabling cells to betightly focused at the point of laser interrogation, regardlessof the sample-to-sheath ratio. This, in turn, allows thecollection of more photons for high-precision analysis atsuperior volumetric sample throughput, as demonstratedby the minimal variation demonstrated in cell cycle analysis(Figure 9).100A A. Acoustic focusing: better precision250500(x 10 3 )PlAcoustically focusedsample stream300100250500(x 10 3 )Pl292µµNo. of eventsthsheasheaththsheasheath(cross-section)No. of eventsLaser200100250400100500(x 10 3 )Pldevice200250500Pl(x 10 3 )300µµB B. Traditional hydrodynamic focusing:compromised data hsheathsheath(cross-section)Figure 8. Acoustic focusing vs. traditional hydrodynamic focusing asparticles pass through the laser. (A) In acoustic focusing, cells remainin tight alignment even at higher sample rates, resulting in less signalvariation and improved data quality. (B) In traditional hydrodynamic focusing,increasing the sample rate results in widening of the sample core stream,resulting in increased signal variation and compromised data quality.4No. of eventsNo. of events300200100500(x 10 3 )Sample rate(μL/min)12.525G0/G1 CV (%)2.993.032.76G2 /M CV (%)1.991.991.99100200250500Pl(x 10 3 )5001,0002.942.702.962.052.052.03Figure 9. Minimal data variation at high sample rates with the AttuneNxT Flow Cytometer. Jurkat cells were fixed and stained with propidiumiodide, treated with RNase, and analyzed at a concentration of 1 x 10⁶cells/mL on the Attune NxT Flow Cytometer at different sample rates. Theleft peak in all graphs reflects cells in G0/G1 phase, while the right peakreflects cells in G2/M phase. Regardless of sample rate, the width of theG0/G1 and G2/M peaks and coefficient of variation (CV) remains consistentfor the Attune NxT Flow Cytometer, even at the highest sample rate of1,000 μL/min.
Dilute your samples, not your data quality0.00.01.0FSC (blue 488 nm) (x106)0.4LeukocytesSSC (violet 405 .0106Leukocytes0 ocytesSSC (blue 488 nm)0.20.40.40.60.60.80.81.01.0Red blood cells6001055001040.80.60.40.20.0–102 1031001030Platelets105106Vybrant DyeCycle Ruby fluorescenceLeukocytes0 s8006004002000.0104300CD45 Pacific Orange fluorescenceSSC (blue 488 nm) (x103)SSC (blue 488 nm)White blood cells400200FSC488(blue488nm)) (x10 )FSC (bluenm)(x101.0 Red blood cells Platelets700Coincident10666C106CD45 Pacific Orange 41.0E1.01061031030.64FSC (blue 488 nm) (x106)AD0.25SSC0.86This feature is also useful for samples that are inherentlylow in concentration, dilute samples such as cerebrospinalfluid (CSF), and stem cell samples with low cell numbers, allof which can take a long time to acquire due to their highvolumes and need to acquire the entire sample. High samplecollection rates of up to 1 mL/min make acquisition of thesesamples possible—you can analyze up to 4 mL in just 4minutes. InCoincidentaddition, no sample loss occurs due to washingand centrifugation of the samples, and full panel testing withup to 14 colors is possible for all precious samples.Glycophorin A FITC fluorescence0.6SSC (violet 405 nm) (x106)0.40.2SSC (violet 405 nm) (x106)0.2Glycophorin A FITC fluorescenceSSC (violet 405 nm) (x106)When working with whole blood, washing of the sampleand lysis of red blood cells (RBCs) can cause significantcell loss and damage. Significantly higher sample collectionrates, due to acoustic focusing, allow the Attune NxTFlow Cytometer to deliver a no-wash/no-lyse protocol tominimize cell loss and simplify sample preparation. Figure 10demonstrates three strategies for identifying leukocytes fromwhole blood: (1) utilizingviolet side scatter to discriminateRed blood cells1.0BCleukocytes from RBCs, (2) utilizing CD45 antibodies to100.8 10“trigger” and gate on leukocytes and (3) utilizing Invitrogen0.6Vybrant DyeCycle dyes to identify nucleated cells (therefore100.4discriminating the 0500FSC (blue 488 nm) (x103)Figure 10. Problematic samples easily analyzed with the Attune NxT Flow Cytometer. (A) Identification of leukocytes in human whole blood usingviolet side scatter is illustrated. Leukocytes are outnumbered 1,000 to 1 by red blood cells in whole blood and generally require enrichment by redblood cell lysis or gradient centrifugation prior to analysis. The rapid sample collection rates and inclusion made possible by the Invitrogen Attune NxTNo-Wash No-Lyse Filter Kit (Cat. No. 100022776) on the Attune NxT Flow Cytometer allow the identification of leukocytes by scatter properties alone.Using both violet and blue side scatter permits leukocytes to be distinguished from RBCs (which contain hemoglobin and absorb light at 405 nm) inwhole blood. When leukocytes are gated based on violet light scatter properties, the 3 main leukocyte cell populations in human blood (lymphocytes,monocytes, and granulocytes) are detected. (B) A fluorochrome-conjugated antibody approach to identifying leukocytes in whole human blood isillustrated. CD45-expressing leukocytes can be targeted with fluorochrome-conjugated anti-CD45 antibodies, in this case Invitrogen CD45 Antibody,Pacific Orange Conjugate (Cat. No. MHCD4530TR). Invitrogen Glycophorin A Antibody, FITC Conjugate (Cat. No. MHGLA01-4) is used to eliminatered blood cell–coincident events. Gating on CD45-positive glycophorin A–negative cells allows the identification of the 3 primary leukocyte populations(lymphocytes, monocytes, and granulocytes), while avoiding glycophorin A–CD45 double-positive coincident events. (C) Identification of leukocytes inwhole human blood using Vybrant DyeCycle dyes is illustrated. Vybrant DyeCycle dyes label live nucleated cells, thus allowing for the identification ofleukocytes in whole human blood. Human whole blood labeled with the cell membrane–permeant DNA dye Vybrant DyeCycle Ruby (Cat. No. V10309)allows the identification of the 3 main leukocyte populations in human blood: lymphocytes, monocytes, and granulocytes.5
Rapid detection of rare cellswith acoustic focusingFSC-ADetection of rare events includes populations of cellscomprising less than 1% of total cells, which includes thedetection of stem cells, minimal residual disease cells,natural killer cells, and fetomaternal hemorrhage cells.Analysis of rare cell populations requires the collection ofhigh numbers of events in order to attain a reliable measureof accuracy, leading to long acquisition times. The AttuneNxT Flow Cytometer allows dilute samples to be processedquickly at sample input speeds of up to 1 mL/min.Conventional cytometers utilize traditional hydrodynamicfocusing technology that allows for maximum sampleinput rates of 60–100 µL/min, limiting detection of rare cellpopulations due to the incredibly long acquisition timesrequired to collect enough cells for analysis. By combiningacoustic and hydrodynamic focusing, the Attune NxTFlow Cytometer can analyze cells at sample input ratesof 500 µL/min or 1 mL/min, allowing for quick collectiontime in experiments involving detection of rare events(Figures 11 and 12).gated PBMC:14,081,410Gated on live CD19– cells at collection rate of 500 µL/mingated CD4 iNKT cells:10,344CD45R/B220 PE fluorescencegated iNKT cells:16,593CD8-APC-Cy7CD8-APC-Cgated CD3 cells:6,817,017PE-CCD3 PE-Cy5CD3 PE-Cy5FSC-H106105104103102LIVE/DEAD AquaTCR Vα24Jα18V PEFluor 700CD4 AlexaFluor0.15% 0.113.7IFN-γ FITC 0.186.20.3IL-17 BV421IL-4 APCGated on CD4 iNKT cells97.90.41.4TNF-α BV605Figure 11. Peripheral blood mononuclear cells (PBMC) were stimulated for 4 hourswith 200 ng/mL PMA plus 1 µg/mL ionomycin at 37 C. Rare cell analysis gating strategy isdemonstrated. Production of 4 different cytokines (IL-4, IL-17, IFN-γ, and TNF-γ) by human peripheralblood iNKT cells that express CD4 was analyzed. Data courtesy of Dr. Andrea Cossarizza (Universityof Modena and Reggio Emilia School of Medicine).6102103104105106CD317 Alexa Fluor 488 fluorescenceFigure 12. Collection of more than 1 millionlive cells and detection of a rare population(0.2%) of dendritic cells. Plasmacytoiddendritic cells (pDCs) are a specialized cellpopulation that produces large amounts oftype I interferons in response to viruses and areidentified using the immunophenotype CD19 –/B220high/CD317 . Four-color staining of mousesplenocytes included CD19 Pacific Blue ,CD317 Alexa Fluor 488, and CD45R/B220 PEantibodies and SYTOX AADvanced DeadCell Stain. A gate was made on live cells usingSYTOX AADvanced Dead Cell Stain, followedby gating on CD19 – cells. A two-parameter plotof CD45R/B220 vs. CD317 was used to identifypDCs. A collection rate of 500 μL/min wasused to acquire 1.3 x 10⁶ total cells with a cellconcentration of 7.5 x 10⁷ cells/mL. pDCs wereidentified as dual B220 /CD317 (upper rightquadrant) and constitute 0.851% of live CD19 –cells, which is 0.194% of total splenocytes.
Volumetric measurementsand cell countsSmooth sample delivery Sample delivered by positive displacement syringe pump(Figure 13) for volumetric analysisVolumetric cell counts for all samples Count cells in a known volume (gated or total events) Live/dead analysis—easily gate out dead cells to countlive cellsSample analysis volume Don’t lose precious sample—choose from 20 μL to 4 mLsample volumesSample flow rates Maximize your sample flow rate for specific applications Choose from flow rates of 12.5, 25, 100, 200, 500, and1,000 μL/minFigure 13. Positive displacement syringe pump.7
Flow that fits: modular designconfigurable to your needs and budgetAttune NxT Flow Cytometer and AutosamplerDesigned to grow in lockstep with the research needsand budgetary confinements of labs, the Attune NxT FlowCytometer features modularity and uncomplicated, rapidupgrade options.Lasers: Choose from 1 to 4 lasers– Violet (405 nm)– Blue (488 nm)– Yellow (561 nm)– Red (637 nm)Up to 16 detection channels: Forward scatter (FSC) Side scatter (SSC) Up to 14 colorsUser-exchangeable bandpass filtersFigure 14. Filters are easy to access on the Attune NxT Flow Cytometer. Easy access to filters (Figure 14)Spatially separated lasers All lasers spatially separated (Figure 15) Improved compensation for multicolor panels– More choices for color combinations– 6-color experiments with no compensationrequired with 4-laser instrument (Figure 17)Minimal compensation for popular dyes FITC (from blue laser) vs. PE (from yellow lasers)(Figure 16)Figure 15. The Attune NxT Flow Cytometer can be configured with upto 4 spatially separated lasers.8
Multicolor analysis in a modular designGlycophorin A PE (YL-1)Side scatterT cell subset panelCD4 FITC (BL-1)Figure 16. With the Attune NxT Flow Cytometer, minimalcompensation is required for popular dyes such as FITC and PE.(A) When FITC and PE use the same excitation and optical detectionpathways after excitation by the 488 nm blue laser, there is a significantamount of spillover of FITC signal into the PE detector, requiringcompensation. (B) When excitation and detection of FITC and PE areuncoupled, using the 561 nm laser to excite PE and the 488 nm laser toexcite FITC, there is little or no spillover of FITC signal into the PE signal,thus no compensation is required.CD62L Pacific Blue (VL-1)CD62L Pacific Blue (VL-1)CD45 Pacific Orange (VL-3)CD8 FITC (BL-1)BCD56 PE (YL-1)CD4 FITC (BL-1)Forward scatterCD45 Pacific Orange (VL-3)BCD3 APC Alexa Fluor 750(RL-3)AACD56 PE (BL-2)With the option to be configured with up to 4 lasers and14 colors for multiparameter analysis, the Attune NxTFlow Cytometer was envisioned as a modular systemto fit most experimental design needs and lab budgets.The novel design of the optical path helps ensure precisefixed alignment of 4 spatially separated lasers onto thesample stream, leading to consistency in data over time,superior performance, and excellent reliability. Minimalcompensation is required for popular dye combinations(Figures 16 and 17).CD4 PerCP Cy5.5 (BL-3)Compensation matrixPacific Blue (VL-1)Pacific Blue (VL-1)Pacific Orange (VL-3)FITC (BL-1)PerCP-Cy5.5 (BL-3)PE (YL-1)APC-Alexa Fluor 750 (RL-3)0.00.00.00.00.0Pacific Orange (VL-3)0.00.00.00.00.0FITC (BL-1)0.00.00.00.00.0PerCP-Cy5.5 (BL-3)0.00.00.00.00.0PE (YL-1)0.00.00.00.0APC-Alexa Fluor 750 (RL-3)0.00.00.00.00.00.0Figure 17. Minimize compensation for multicolor panels. (A) Optimal design of a no-lyse, no-wash 6-color immunophenotyping panel for humanT cell subsets acquired on the Attune NxT Flow Cytometer requires no compensation. Whole human blood was stained with Invitrogen anti-CD45 PacificOrange (Cat. No. MHCD4530TR), anti–glycophorin A PE (Cat. No. MHGLA04), anti-CD3 APC-Alexa Fluor 750 (Cat. No. MHCD0327), anti-CD62L PacificBlue (Cat. No. MHCD62L28), anti-CD8 FITC (Cat. No. MHCD0801), and anti-CD4 PerCP-Cy 5.5 (Cat. No. A15858) antibodies. Samples were acquiredon the Attune NxT Flow Cytometer using 405 nm excitation to detect Pacific Blue and Pacific Orange dyes, 488 nm excitation to detect FITC and PerCPCy5.5 dyes, 561 nm excitation to detect PE, and 637 nm excitation to detect APC–Alexa Fluor 750 dye. A fluorescence threshold was set on the CD45–Pacific Orange conjugate and red blood cell–coincident events were excluded based on glycophorin A–PE positivity. Lymphocytes were gated based onscatter properties, from which T cells were identified by CD3 expression. T cells were then analyzed for their expression of the lineage markers CD4 andCD8 and the activation marker CD62L to identify naive/central memory T cells (CD62L ) and effector memory T cells (CD62L–). (B) Compensation matrixfrom the Attune NxT Flow Cytometer for the 6-color immunophenotyping panel. Zero compensation is needed.9
Novel optical design to minimizeinstrument downtimeThe innovative design of the optical path helps ensureprecise fixed alignment of four spatially separated lasersonto the sample stream, leading to consistency in dataover time, superior performance, and first-class reliability.The instrument can be configured with up to 4 solid-statelasers with flat-top beam profiles (Figure 18) to minimizethe effects of changes in fluidics or optics, which maycause instability and alignment issues potentially leadingto instrument downtime. The light emitted from cells in theflow cell is transported with high efficiency to the detectionoptics through fiber-optic cables with minimal loss of signal.The filters in front of the photomultiplier tubes collect lightsignals and can be easily interchanged and customized tominimize reagent crosstalk and maximize signal.VerticalHorizontalwidthwidth(60 µm @ 1/e2) (13 µm @ 1/e2)Benefits of the state-of-the-art optical design Onboard thermal-electric cooler––No warm-up delay: fiber isn’t affected by instrumentwarm-up Simmer mode: automatic shutoff prolongs laser usagelifetime by 10x––Only on when acquiring samples––Reports hours of usage Pre-aligned and welded fiber to laser interface(permanent) Pre-aligned fiber to beam-shaping optics (BSO) interface(alignment-free) Focus lens per laser: power where you want it Flat-top laser specified at the flow cell Field upgradableBenefits of flat-top lasers 50% reduction in scattered light No problems with lateral shift in alignment10Figure 18. Example of flat-top beam profiles.
Superior reliability and maximumsignal efficiencyInstrument downtime due to laser misalignment is a majorconcern with users of conventional flow cytometers. Mostflow cytometers use lasers that have a Gaussian emissionprofile (Figure 19A), where the intensity increases until it hitsa maximum. The maximum window for alignment is verysmall, so alignment needs to be very precise. Gaussianlasers have very little flexibility and may yield poor resultsdue to slight shifts in the laser alignment (Figure 19B),leading to loss of sensitivity and high CVs. The AttuneNxT Flow Cytometer uses flat-top lasers, with emissionprofiles as seen in Figure 19C, which have an intensityprofile that allows a much wider window of alignment. Withthese lasers, slight shifts in the alignment do not affectsensitivity and CVs, because they have a higher tolerancefor misalignment, allowing them to maintain high sensitivityand low CVs (Figure 19D).ABCV 8CV 1.1MisalignedCDCV 1.71CV 1.71Still alignedFigure 19. Emission profiles of lasers used in flow cytometers. (A) Gaussian laser profile with proper alignment, (B) Gaussian laser profile withmisalignment, (C) flat-top laser profile with proper alignment and (D) flat-top laser profile, still in proper alignment.11
Software that performsto your specificationsInvitrogen Attune NxT Software is designed to providepowerful data acquisition and analysis using an intuitive,user-friendly interface (Figure 20). Experiments can easilybe set up, customized, and saved for future studies.Compensation is automated and can be set up using aguide. The software is designed to maximize efficiency inperforming data analysis, with fast refresh rates for largedata sets (up to 20 million events per sample) with theability to immediately visualize changes on data plots asyou make adjustments. The software has unique tools tosimplify experimental setup, including reagent selectionusing the filter configuration manager. This providesguidance for matching the right reagent to the optimizedchannel on the instrument by selecting reagents from adrop-down menu of prepopulated or customized reagents,which is then applied to plot labels. Compensation—fully automated and manualcompensation Instrument tracking—automated baseline andperformance test for all channels and linearity Automated maintenance—startup ( 15 min),shutdown, rinse, wash, debubble, deep clean, monthlydecontamination User account maintenance—administrative andindividual accounts with user log Gates—standard and customizable gates Plot previews—easy workspace setup Zoom filmstrip viewer—easy visualization andnavigation of plots to set gates and plot attributes File formats—FCS 3.0 and FCS 3.1 Graphics resolution—publication-quality images(customizable)ABDCFigure 20. Intuitive software interface with familiar workflow. The user interface is divided into four panels for simple use: (A) the Top panel usesribbons and tabs for most functions (similar to Microsoft Office products); (B) the Collection panel presents an easy setup window to acquire data; (C) theExperiment Workspace panel offers display of plots and statistics; and (D) the Experiment Explorer panel makes it easy to manage samples and data files.12
Improved ease of operation and maintenanceAutomated processes make startup, cleaning between samples, and shutdown as easyas a push of a button (Figure 21).Figure 21. Instrument control tab on Attune NxT Software.Versatility to meet your analysis needsPowerful Attune NxT Software allows efficient data acquisition and analysis. Attune NxTSoftware provides flexible analysis, offering a variety of plotting tools (Figure 22) and plottypes (Figure 23).Figure 22. Plotting tools available on Attune NxT Software.Figure 23. Customizable plot types on Attune NxT Software.Pre- and post-compensation—automated or manualCompensation results can be easily achieved by utilizing the automated compensationsetup (Figure 24), allowing rapid and accurate compensation, thus eliminating tedioustrial-and-error adjustments of compensation matrix coefficients.Figure 24. Compensation tab on Attune NxT Software.Quality controlPerformance history and Levey-Jennings plots for allchannels are available to track instrument performanceover time (Figure 25).Figure 25. Levey-Jennings tracking plots.13
Rapidly process multiple samplesAn optional accessory for the Attune NxT Flow Cytometer,the Attune NxT Autosampler enables the rapid processingof multiple samples.Key features Compatible with many different plate formats, including96-well, 384-well, and deep-well plates (Figure 26) Intelligent probe design minimizes clogging and carryover( 1%) (Table 1) and helps prevent damage to theinstrument Performs automated cleaning when the instrument isshut down Mixes sample by aspiration to maintain samplehomogeneity and cell viability (Table 2) Helps maintain consistent data while easily switchingbetween use of the autosampler and individual tubes Consistent data across different collection ratesFigure 26. Example of a 384-well heat map.Table 1. Minimal carryover using the Attune NxTAutosampler. Jurkat cells at a concentration of 1 x 10⁶cells/mL were dispensed into a 96-well V-bottom plateand sampled using the Attune NxT Autosampler. Sampleswere analyzed on the Attune NxT FLow Cytometer usingcollection rates in Standard mode (200 µL/min) and HighThroughput mode (500 µL/min). Each sample was mixedonce and the Attune NxT Autosampler was washed 1–3times prior to sampling the next well. Percent samplecarryover was calculated.Number of washes and % carryoverModeTable 2. Gentle sample mixing using the Attune NxTAutosampler: increasing the number of mixing cyclesdoes not adversely affect cell viability. Ammoniumchloride–lysed whole blood (LWB) and NIH/3T3 (live/heat-treated) cells were stained with 2 µg/mL propidiumiodide and loaded in triplicate into a 96-well V-bottomplate. Prior to acquisition, samples were mixed 0–5 timesby the Attune NxT Autosampler and then samples wereanalyzed using Standard mode collection rates (100 µL/minfor NIH/3T3, 200 µL/min for LWB) on the Attune NxT FlowCytometer. Propidium iodide was excited using a 488 nmlaser and fluorescence emission was collected using a640 nm longpass filter. Minimal variation was observedwithin each cell type, regardless of the number of mixcycles used prior to acquisition.Percentage of dead cellsNumber of mix 0.7432.75Standard0.010.010.0140.7433.26High Throughput0.020.020.0250.7531.5814
Invitrogen flow cytometryreagentsWe have been at the forefront of expanding cellular analysis with the continuedinvention and development of fluorescent detection molecules and probes fornearly 40 years. This enabled a new, expanded world of flow cytometry. Fromconjugated antibodies through functional dyes to cell function assays, look toInvitrogen flow cytometry products to elucidate your research.Molecular Probes flow cytometryProducts and resource guideGo to thermofisher.com/flow-cytometry for more informationon Invitrogen flow cytometry products and resources.Instrument setup and calibrationFlow cytometers are designed toperform quantitative measurementson individual cells and other particleswith high precision, speed, andaccuracy. As with all high-performanceinstrumentation, flow cytometersmust be calibrated regularly to ensureaccuracy and reliability. The stability,uniformity, and reproducibility ofInvitrogen microsphere productsmake them excellent tools for flowcytometer instrument setup andcalibration. Learn more about all ofthese products atthermofisher.com/flow-standardsCell analysis—functional dyesAn extensive array of Invitrogen stains and kits have been developedto assess cell function, health, andviability (Figure 27). Whether the healthof cells is your primary question orsimply a critical factor in getting theright answers to other questions,we have a solution for you. For moreinformation and more products, go of cellsNumberof cellsAntigen detection—primary antibodiesWe offer a diverse array of highlyspecific RUO, ASR, and IVD primaryantibodies. From immunophenotypingto rare-event detection, Invitrogen multicolor fluorescently conjugatedprimary antibodies for flow cytometrycan help answer complex cell biologyquestions. Search for primaryantibody conjugates IVE/DEADFixableAqua fluorescence102103104105LIVE/DEAD Fixable Aqua fluorescenceBNumberof cellsNumberof cellsSample preparationQuality data require quality startingmaterial. Invitrogen samplepreparation reagents, which includereagents for blood cell preservation,red blood cell lysis, and samplefixation and permeabilization, aredesigned to help you achieve the bestpossible results. Learn more aboutthese products and get protocols atthermofisher.com/flow-sample150150After fixationAfter VE/DEADFixableAqua fluorescence234101010105LIVE/DEAD Fixable Aqua fluorescenceFigure 27. Retention of Invitrogen LIVE/DEAD Fixable Dead Cell Stains afterformaldehyde fixation. The LIVE/DEAD FixableAqua Dead Cell Stain Kit (Cat. No. L34957)was
The Attune NxT Flow Cytometer was run at (B) 12.5 μL/min, which is equivalent to the traditional flow cytometer and at (C) 500 μL/min, a 40x increase in sample flow rate. The Attune NxT Flow Cytometer showed equal or better results even at the highest flow rates. Attune NxT Flow Cytometer (500 μL/min) Conventional flow cytometer