Transcription
Champaign CountyCommunity Health Plan2021-2023
Executive SummaryThe Champaign-Urbana Public Health District (CUPHD) is the local public health authority for the Citiesof Champaign and Urbana and Champaign County. CUPHD, in conjunction with Carle FoundationHospital, Presence Covenant Medical Center, and United Way of Champaign County, used the Mobilizingfor Action through Planning and Partnership (MAPP) model, a community-based model that necessitatescommunity engagement at all levels to conduct the Champaign Community Health Assessment (CHA)and Community Health Improvement Plan (CHIP). We assessed the current health status of thecommunity, identified needs, and created a comprehensive plan to improve our community’s health byacquiring input from community partners, planners, elected officials, and residents.The MAPP process is composed of four assessments. The use of survey monkey was imperative tocompleting each assessment; approximately 25 community leaders submitted information for theassessment and to review the community health data, set a vision, and identify priorities and goals forthe 2021-2023 Community Health Improvement Plan.Vision: Champaign County will be the Healthiest and Safest, environmentally sustainable communityto live, work, and visit in the State of Illinois.The Four MAPP Assessments:1. The Community Health Status Assessment evaluated the basic demographics and health-relatedstatistics of residents in Champaign County. We used aggregated data accessed fromCountyhealthrankings.org and city and county agencies including the Champaign and Urbana PoliceDepartments. Champaign County had an estimated 209,689 residents in 2019, an increase of 8,608 residentsfrom 2010. The population is 72% White, 14% Black/African American, 11% Asian, and 6%Hispanic. Approximately 18% of Champaign County children live in poverty. 31% of Champaign Residents reported being obese, an increase from 25% in 2017. Violent crime in Champaign County is much higher than the state and national averages. 7% of Champaign County adults are uninsured compared to 10% overall Illinois uninsured rate. The teen birth rate (per 1,000 female population, ages 15-19) is 13, compared to 21 teen birthsper 1,000 in the state of Illinois.2. To perform the Community Themes and Strengths Assessment, we surveyed 634 communityresidents representing different community groups to get an in-depth picture of the strengths andweaknesses of the community. Residents identified mental health, child abuse, gun violence, and infectious disease as the tophealth concerns in the community. The top three adequate community resources were access to healthcare, employment/abilityto find jobs, and funding for schools. The top three resources rated as the most inadequatewere mental health services, affordable childcare, and drug treatment services.2
For both health care and dental care, less than 15% of participants were dissatisfied with thequality of health care and dental care. However, over 25% of participants responded that theywere not satisfied with the access to affordable health care and dental care. Respondentsreported being satisfied with access to high-quality healthcare, although they were dissatisfiedwith the cost of healthcare.Over 12% of participants responded there were times when they ran out of food before theyhad the means to buy more.3. The Local Public Health System Assessment (LPHSA) included 25 community leaders from differentagencies, including local government, community planners, public health professionals, clinicians, policeand fire, local nonprofits, emergency preparedness, and the University of Illinois. This measured how thelocal public health system is addressing the 10 essential public health services. Strengths: enforcing laws, mobilizing partnerships, developing policies/plans,research/innovations, reviewing and improving laws, emergency planning, risk communication,academic linkages, fostering innovations, community partnerships. Needing Improvement: linking community members to health services, evaluating the localpublic health system, assuring a competent and diverse workforce, evaluation of populationhealth, leadership development, and health education/promotion.4. The Forces of Change Assessment identified the changing ACA legislation as a force impacting manysectors; as well as immigration laws, increased used of social media and smartphones, mental healthissues, divisive political climate, lack of state budget, and climate change as major forces of change.Health PrioritiesBased on the four MAPP assessments, community leaders convened to identify priorities. Afteridentifying top health concerns, participants voted to select the top three priorities to address in 20212023 implementation cycle. Special consideration was given to ensure that all priority health actionsalign to include environmental determinants of Public Health. Based on the CDC’s model, SMARTobjectives were used to identify goals and objectives within each priority that were feasible, actionable,and could be implemented in the upcoming years. Workgroups are formed and met separately toformulate goals and action plans to address each of the priorities. Behavioral Health: increase capacity, create behavioral health triage center, promote educationand training on mental and behavioral health to reduce stigma, provide youth-targetedprevention programs.3
Reducing Obesity and PromotingHealthy Lifestyles: improve access tohealthy food options, expand physicalactivity prescription program, andincrease access to physical activity.Violence: promote police-communityrelations, increase communityengagement, and reduce communityviolence through partnering with localinitiativesThe Champaign Regional Executive Committeewould like to thank all of the agencies andindividuals who participated in this process, aswell as the agencies and organizations that make up the Champaign County Local Public Health System.We appreciate their knowledge, collaboration, dedication, and commitment to making our community agreat place to live, work, and visit.AcknowledgementsThe Champaign Regional Executive Committee would like to acknowledge and thank the manyindividuals and organizations that contributed their valuable time and expertise to this report:Elizabeth SilverCarle Foundation HospitalJulianna SellettCarle Foundation HospitalJohn WalshCarle Foundation HospitalAdani SanchezChampaign County Health Care ConsumersMark DriscollChampaign County Mental Health BoardJameel JonesChampaign Park DistrictAwais VaidChampaign Urbana Public Health DistrictCandi CrauseChampaign Urbana Public Health DistrictDebra FruittChampaign Urbana Public Health DistrictJulie PrydeChampaign Urbana Public Health DistrictValerie KoressChampaign Urbana Public Health DistrictDottie Vura-WeisChampaign County Board of HealthCynthia HoyleCU Mass Transit DistrictKaren SimsCU Trauma & ResiliencyEmily YoderEastern Illinois FoodBankJacquelyn EversLand ConnectionKim BryanRattle the Stars Suicide PreventionAmy HuangUnited Way of Champaign CountyBeverley BakerUnited Way of Champaign CountyChaundra BishopUnited Way of Champaign County4
Stephanie AcevadoUniversity of Illinois ExtensionEmily Rae StoneUniversity of Illinois, Interdisciplinary Health ScienceBill BrownUrbana CouncilmanAshley DennisUrbana Park DistrictElsie HedgspethUrbana Park DistrictLinda GibbensUrbana School DistrictKatina WilcherUnit 4 School DistrictGeographic data mapping done by Bill Brown from the University of IllinoisData analysis done by Larry Weinzimmer from Bradley UniversityChaundra BishopCommunity Health Plan CoordinatorThe Champaign Regional Executive Committee Members:Awais VaidChampaign Urbana Public Health DistrictJohn WalshCarle Foundation HospitalElizabeth SilverCarle Foundation HospitalSheri McKiernanOSF HealthcareJulie PrydeChampaign Urbana Public Health DistrictSue GreyUnited Way of Champaign CountyMelissa RomeVermilion County Health DepartmentSheri AskrenUnited Way of Danville AreaJim RussellVermilion County Mental Health BoardLynn CanfieldChampaign County Mental Health Board5
Introduction and FrameworkThe Champaign County Community Health Plan provides a current portrait of the health assets andneeds of the residents of Champaign County. Illinois state law requires every local health department toparticipate in this process, called the Illinois Project for LocalAssessment of Needs (IPLAN). This process must beconducted at a minimum every five years. The detailedassessment and plan provide the foundation for evidencebased health planning and decision-making.The essential elements of IPLAN are:1. An organizational capacity assessment;2. A community health needs assessment; and3. A community health plan, focusing on a minimum of threepriority health problems.The Champaign County Community Health Plan was createdusing a model called Mobilizing for Action through Planningand Partnerships (MAPP). This collaborative approach tocommunity health planning was developed by the NationalAssociation of County and City Health Officials (NACCHO) in cooperation with the Public Health PracticeProgram Office and the federal Centers for Disease Control and Prevention (CDC). MAPP helpscommunities form effective partnerships that can better identify their unique circumstances and needsand use their resources wisely.MAPP is a community-driven process. It is more intense than other approaches in that it requires a highlevel of participation from community organizations and residents. This model employs a variety ofmethods to uncover community health trends, identify gaps in care, evaluate assets, and – mostimportantly – develop and implement a plan that successfully addresses community health needs.The four components of MAPP include:1) The Community Health Status Assessment collects and analyzes health data and describeshealth trends, risk factors, health behaviors and issues of special concern.2) The Community Themes and Strengths Assessment uses participants to make a list of issuesof importance to the community, identify community assets and outline quality of life concerns.3) The Local Public Health System Assessment measures the local public health system’s abilityto conduct essential public health services.4) The Forces of Change Assessment identifies local health, social, environmental or economictrends that affect the community or public health system.6
Since 2013, the Public Health District and Hospitals have moved from independently conducting the CommunityHealth Assessment and Improvement Plan to a truly collaborative model. Both Carle Hospital and OSF Healthcare,the local chapter of United Way along with the Health District formed an Executive Committee to conduct theChampaign Community CHIP and CHA to fulfill the requirements for certification.A diverse group of health providers, civic leaders, and community representatives participate in thisprocess. The goal is for all partners in the local public health system to work together to implement therecommendations outlined in this plan.BackgroundChampaign County is located in East Central Illinois and is 998.39 square miles with a population densityof 208.8 people per square mile. The two major cities, Champaign and Urbana, are home to theUniversity of Illinois, as well as Parkland College and numerous businesses and companies. In 2019 theUS Census Bureau estimated the population of Champaign County to be 209,689 residents, a .15%increase since 2015.Champaign County also include the following villages: Bondville, Broadlands, Fisher, Foosland, Gifford,Homer, Ivesdale, Longview, Ludlow, Mahomet, Ogden, Pesotum, Philo, Rantoul, Royal, Sadorus, Savory,Sidney, St. Joseph, Thomasboro, and Tolono. Townships include: Ayers, Brown, Champaign, Colfax,Compromise, Condit, Crittenden, Cunningham, East Bend, Harwood, Hensley, Kerr, Ludlow, Mahomet,Newcomb, Ogden, Pesotum, Philo, Rantoul, Raymond, Sadorus, Scott, Sidney, Somer, South Homer, St.Joseph, Stanton, Tolono, and Urbana. Champaign County includes the following zip codes: 61820-2,61801-3, 61866, 61874, 61873, 61880, 61864, 61877-8, 61847, 61863, 61871, 61815, 61824-6.Community AssetsParticipating Organizations and Community ResourcesCarle Foundation HospitalCourt Appointed Special Advocates for ChildrenChampaign County Sheriff’s OfficeChampaign County BoardChampaign County Board of HealthChampaign County Head StartChampaign County Healthcare ConsumersChampaign County Mental Health BoardChampaign County Regional Planning CommissionChampaign Park DistrictChampaign Police DepartmentChampaign Urbana Public Health DistrictChristie ClinicCity of ChampaignCity of UrbanaHabitat for HumanityHealth AllianceHealthy Champaign CountyIllinois Dental SocietyLand of LincolnMidwest Center for Investigative ReportingNational Alliance on Mental IllnessParkland CollegePrairie CenterOSF Healthcare SystemPromise HealthcareProsperity Gardens Inc.RosecranceUnited Way of Champaign CountyUniversity of Illinois7
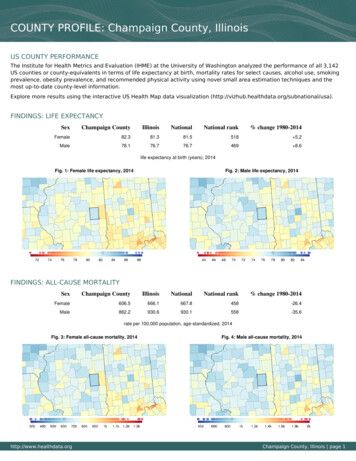
Community Gardens at LeirmanCRIS Healthy AgingCU Mass Transit DistrictCunningham Children’s HomeDevelopment Services CenterFaith in ActionFamily Resiliency CenterFamily Services CenterGreater Community AIDS ProjectUniversity of Illinois Extension OfficeUniversity of Illinois McKinley Health CenterUniversity of Illinois PoliceUrbana Adult EducationUrbana Park DistrictUrbana School DistrictUrbana Neighborhood Connections CenterWells FargoMAPP ASSESSMENTSI. Community Health Status Assessment (CHSA)The CHSA explores how healthy our residents are, and what the health status is of our community. Thisshows the community's health status and ensures that our priorities include specific health status issues(e.g., high lung cancer rates or low immunization rates). The operational definition of health utilized inthis assessment is taken directly from the World Health Organization: Health is a state of completephysical, mental, and social wellbeing and not merely the absence of disease or infirmity. The indicatorsanalyzed represent this philosophy.MethodologyThe Institute of Medicine identifies a need for two kinds of indicators and indicator sets for use in acommunity health improvement plan. The first is a community health profile with indicators proposedby the Institute of Medicine to provide an overview of a community’s characteristics and its healthstatus and resources. The second is the development of indicator sets for performance monitoring.Interpretation of this data through comparison over time or with data from other communities can helpidentify health issues that need to be focused on within Champaign County. We used aggregated dataaccessed from Countyhealthrankings.org, Center for Disease Control, US Census Bureau, IllinoisDepartment of Public Health, Illinois State Police Crime Reports, Illinois Department of Healthcare andFamily Services, and local city and county agencies.Distribution of the Population by Age, Race, and EthnicityLike many areas in the United States, Champaign County is becoming more diverse each year. Being thehome of the University of Illinois at Urbana-Champaign, the county was the home to more than 10,000international students during the 2018-2019 school year, hailing from more than 110 countries. This hasincreased dramatically from only 4,800 in 2005 and has added much diversity to both the campus andChampaign County. This also affects the age distribution of Champaign County, with the 18-24 age rangewell above the state and national average.8
Population Distribution by Age - 201840%35%30%25%20%15%10%5%0%0-1920-39Champaign County40-59Illinois60 United omDemographicsThe total estimated population of Champaign County is 209,689 in 2019 (https://census.gov).Champaign County has 27% of its residents who are below the age of 20 and 13% are over the age of 65.Less than 10% of the residents are Hispanic, while over 70% are White.Champaign County Distribution by Race, 0%0.00%WhiteAfrican AmericanAsianHispanichttps://census.gov9
Racial Diversity, 2018A dot-density plot of the population based on the 2018 US National Census estimates broken down byrace depicts the population density and the racial diversity of their neighborhood. The center of theChampaign-Urbana region is dominated by the University, with a majority of non-residential schoolbuildings and surrounded by a higher percentage of Asian individuals than found in the rest of the region.There is a higher concentration of African Americans represented in the northern part of Champaign asindicated in red. The densest areas are near the center of Champaign-Urbana just within or at the easternand western edges of the University of Illinois campus.10
Socioeconomics and Priority PopulationsThe table below shows the social and economic factors for Champaign County according to the 2017County Health Rankings. Exactly 80.0% of Champaign County residents report some college, comparedto 69.0% of Illinois residents. Violent crimes in Champaign County are substantially higher than theIllinois rate.Social and Economic Factors - 2018High School GraduationSome CollegeUnemploymentChildren in PovertyIncome InequalityChildren in Single-Parent HouseholdsSocial AssociationsViolent CrimeInjury DeathsChampaign althrankings.org11
The below table shows the number of persons enrolled in Medicaid in Champaign County“Number of persons enrolled as of the last day of the State Fiscal Year. State Fiscal Year runs from July 1through June 30. Enrollment data is available 90 days after the end of the State Fiscal Year.Children as defined as persons less than the age of 19. Adults are defined as persons older than 19 andyounger than 65. Seniors are defined as persons age 65 and older.Comprehensive Benefit enrollees are clients who are eligible for all services provided under the State'sMedical Assistance Program.” mprehensive BenefitEnrolleesChildrenAdults with DisabilitiesACAOther 6923,3207,5596,9221,716Total EnrolleesTotal FY201840,686FY201939,743Source: Illinois Department of Healthcare and Family ServicesThe graph below shows unemployment rates for Champaign County and the State of Illinois overall fromJanuary 2010 to January 2020. Over the past 10 years, Champaign County has consistently had a slightlylower unemployment rate than the state average, with the exception of a spike in early 2018.12
The rates of insurance and health resources in 2018 are shown in the table below. Champaign Countyhas a lower rate of uninsured adults than Illinois. Champaign County has a higher number of preventablehospital stays.Health Resources and Indicators 2019UninsuredUninsured AdultsUninsured ChildrenPrimary Care PhysiciansDentistsMental Health ProvidersOther Primary Care ProvidersPreventable Hospital StaysMammography ScreeningFlu VaccinationsChampaign ttps://countyhealthrankings.orgAccording to County Health Rankings, the percentage of Champaign County residents that are uninsuredhas dropped from 7% in 2018 to 6% in 2019, a vast improvement from 18% in 2010.https://countyhealthrankings.org13
The graph below shows the percent of children living in poverty in Champaign County, the State ofIllinois, and the U.S. from 2002 to 2019. Champaign County has a higher poverty rate than Illinois in thepast 10 years except for 2015 and 2016. In 2018, the percent of people living in poverty in ChampaignCounty was 18% and has remained at that level for 2019.https://countyhealthrankings.org14
The map below shows the percentage of families living below the poverty level in Champaign-Urbana,along with the percentage of families with children under the age of 18 living in poverty.15
According to County Health Ranking, the 2019 ratio of dentists in Champaign County is 1 dentist to every1,560 people living in the county. This is fewer dentists available than the state ratio of 1 dentist to every1,280 citizens. However, the graph shows that the ratio of citizens to dentists is decreasing every year.https://countyhealthrankings.orgAccording to County Health Rankings, the ratio of mental health providers per 100,000 has improvedsignificantly over the past decade, moving from 2055:1 in 2010 to 440:1 in 2019; however, there was aslight decrease in the number of providers from 470:1 in 2018. The table below shows the ratio andnumber of mental health providers for Champaign County, the State of Illinois, and the U.S. in 2016.Report AreaEstimatedPopulationNumber ofMental HealthProvidersMental Health Care Provider Rate(Per 100,000 Population)ChampaignCountyIllinoisUnited 3,219182.2194.9Source: University of Wisconsin Population Health Institute and County Health Rankings 201916
Quality of LifeChampaign County residents report relatively good health and quality of life that closely resemble stateaverages.Quality of Life - 2019Poor or fair healthPoor physical health daysPoor mental health daysChampaign thrankings.orgChronic Disease and Health BehaviorsAccess to exercise opportunities continues to sit at 84%, 7% lower than Illinois. Sexually transmittedinfections, food insecurity, and adult smoking are all higher in Champaign County than the State ofIllinois overall.Health Behaviors - 2018Adult smokingAdult obesityFood environment indexPhysical inactivityAccess to exercise opportunitiesExcessive drinkingAlcohol-impaired driving deathsSexually transmitted infections per 100,000Food insecurityLimited access to healthy foodsMotor vehicle crash deathsDrug overdose deathsChampaign thrankings.orgAccess to exercise opportunities measures the percentage of individuals in a county who live reasonablyclose to a location for physical activity. Locations for physical activity are defined as parks (local, state,and national) or recreational facilities, which include gyms, community centers, YMCAs, dance studios,and pools. According to the County Health Rankings, 84% of Champaign County residents have adequateaccess to opportunities for physical activity. Illinois’ percentage is 89% and US Top Performers’ percentageis 91%. Having adequate access to opportunities for physical activity is defined as individuals who:oooReside in a census block within a half a mile of a park, orIn urban census tracks: reside within one mile of a recreational facility, orIn rural census tracts: reside within three miles of a recreational facilityThe map below shows the percent of households with at least one member with a disability in ChampaignUrbana.17
18
Infectious DiseaseThe table below shows communicable diseases in Champaign County and Illinois from 2013 to hampaign n County54707582Illinois6801,558482885Champaign County41543Illinois337233287237Champaign County5746Illinois26142430333Champaign County318203112Illinois312840886592Champaign County23716Illinois731596443469Champaign County10714Hepatitis BHepatitis CInfluenza withHospitalizationLymeMumpsShigellosisChicken Pox21https://iquery.illinois.gov19
Sexually Transmitted InfectionsThe table below shows sexually transmitted infections cases and rates for Champaign County and Illinoisfrom 2013 to ,2231,423Chlamydia 395380315364Gonorrhea Illinois16,46415,97117,13021,199Primary andSecondary SyphilisChampaign66916Primary andSecondary .illinois.gov20
Death, Injury, and ViolenceThe following maps look at the Life Expectancy from 2014-2019 for Champaign County.21
Champaign County crime rate has decreased over the last couple years but remains higher compared tothe State of Illinois and surrounding counties. There are many factors that can contribute to crime in thecommunity: poverty, substance abuse, lack of suitable employment, mental health, and other factors.County or State2016 Rate2017 Rate2018 RateChampaign County3,322.02,982.82,586.0State of Illinois2,418.92,337.42,555.5Total crime rate per 100,000.Source: Illinois State Police Crime Report 2017-2018According to 2019 County Health Rankings the violent crime rate (the number of reported violent crimeoffenses per 100,000 population) is 487 which is substantially higher than the state of Illinois rate of403. The table below shows the total crime index offenses for Champaign County from 2012-2015.ChampaignCounty201620172018% change from2016 – 2018Total CrimeIndex Offense6,9816,2795,42122.3% DecreaseCriminalHomicide116109.1% DecreaseForcible Rape12814516428.1% IncreaseRobbery21119015825.1% IncreaseAggravatedAssault/Battery6816086218.8% DecreaseBurglary1,44495274348.5% DecreaseTheft4,2604,1543,54516.8% DecreaseMotor VehicleTheft22019015828.2% DecreaseArson26342215.4% DecreaseSource: Illinois State Police Crime Reports, 2016-201822
Death Rates in Champaign CountyIn 2018, the leading causes of death nationwide in decreasing number of deaths are heart disease,cancer, accidents, chronic lower respiratory diseases, stroke, and Alzheimer’s disease. The leadingcauses of death in Champaign County are similar, although there are a few differences. Below are listedthe leading causes of death from 2015 to 2018 in Champaign County.Crude Death Rate per 100,000 people in Champaign CountyCauses2015201620172018Heart 37.331.425.227.1Chronic ease3426.235.237.6Diabetes37.86.711.915.2Kidney Disease9.610.010.920.0Influenza .3All causes601.4623.7650.1650.2Source: Illinois Department of Public Health Vital Statistics In 2018, 125.8 per 100,000 people in Champaign County died due to heart disease. Incomparison, Illinois’ heart disease mortality rate was 214.5 per 100,000 people, or about 88.7per 100,000 more than the Champaign County rate.23
The leading cause of death in Champaign County from 2016 to 2018 was heart disease. In 2015,Cancer was the leading cause of death in Champaign County with a rate of 129.8 per 100,000populations.According to Census data, the Champaign County suicide rate in 2018 was 12.9 per 100,000which is higher than the state of Illinois rate of 10.3 but lower than the national rate of 13.4.Alcohol-impaired driving deaths in Champaign County have more than doubled to 32% since2015 and is higher than both the state and national percentages.2019 County Health Rankings24
25
26
Drug-related Deaths in Champaign County, 2011-2015According to the death certificate data compiled by Vital Records, Champaign-Urbana Public HealthDistrict, there were 262 drug-related deaths for the five-year period 2015-2019. Of these deaths, 198were residents of Champaign County and those are the ones included in this analysis.201552201626201733201836201951One hundred forty-one of the deaths (71%) were in white individuals, and 54 (27%) in Black individuals.Over 71% were male, and 29% were female. Ages of those who had drug-related deaths were from 11days old to 73 years old.27
Gun Related Deaths in Champaign CountyThe table below shows the gun-related deaths in Champaign County from 2015 to 2019.Gun Related Deaths in Champaign 19UndeterminedChampaign-Urbana Public Health District Death Certificates28
Maternal and Child HealthThe teen birth rate (per 1,000 female population, ages 15-19) is 13 newborns. Child and Infant mortalityare higher for Champaign County than for the State of Illinois.Maternal Child Health Indicators - 2018Teen birth Rate (per 1,000 female population ages 15-19)Low birth weightInfant mortality (within 1 year, per 1,000 live births)Child mortality (among children under age 18 per 100,000)Champaign nkings.orgEnvironmental HealthChampaign County has more air pollution and severe house problems compared to the State of inIllinois. However, residents of Champaign county are more likely to carpool.Physical Environment - 2014ChampaignCountyIllinoisAir pollution - particulate matterSevere housing problemsDriving alone to workLong commute - driving hrankings.org29
II. Community Themes and StrengthsAssessmentThe Community Themes and Strengths Assessment (CTSA) evaluates what is important to ourcommunity, how quality of life is perceived, and what assets we have that can be used to improvecommunity health. This assessment highlights what issues in the community are particularly importantor concerning.MethodologyWe conducted the Champaign County Community Health Survey by gathering feedback from residentswith surveys. Due to the Coronavirus pandemic, the survey was conducted exclusively online throughSurvey Monkey; residents were surveyed from March 2020 to July 2020, with 634 total surveyscompleted. While the data-collection efforts attempted to stratify by zip code, race, ethnicity, income,and age, due to the COVID-19 pandemic, face-to-face interactions and paper surveys typically collectedin underserved areas was not possible. Consequently, demographic representa
3. A community health plan, focusing on a minimum of three priority health problems. The Champaign County Community Health Plan was created using a model called Mobilizing for Action through Planning and Partnerships (MAPP). This collaborative approach to community health planning was developed by the National