Transcription
Quarterly Quality CallTexas Children’s Health PlanTexas Health and Human ServicesCommissionHealth Policy and Clinical Services DivisionHealthcare Quality Analytics, Research and Coordination SupportAugust 12, 2015
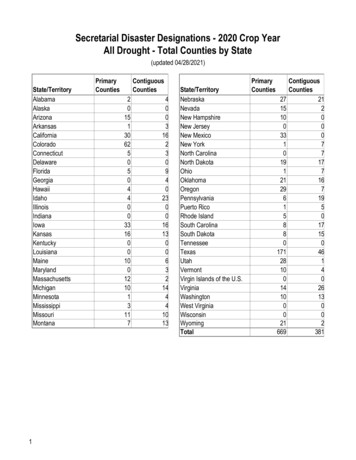
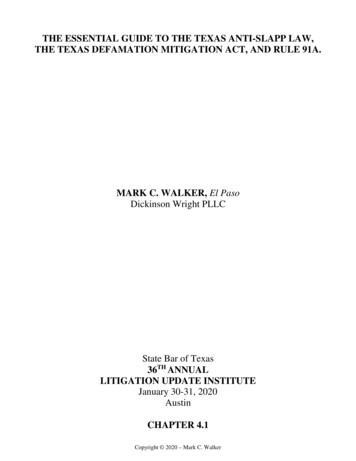
STAR 60.860.720.680.940.730.7201320140.40.2020112012* NOTE: Calendar year 2014 is a partial year of data2
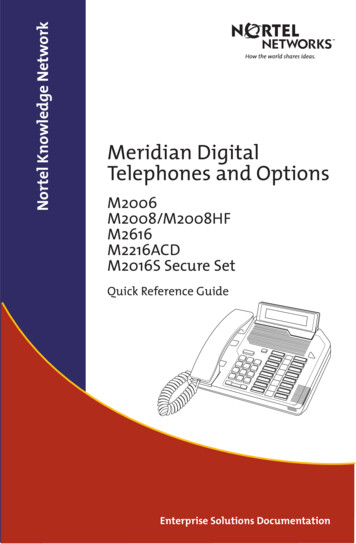
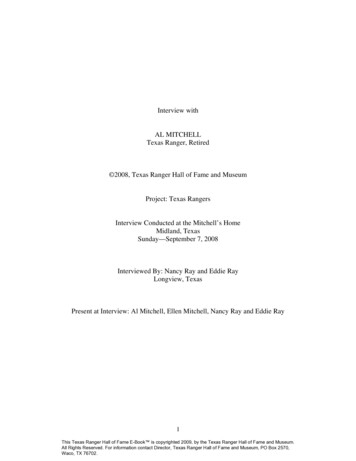
STAR Cost per PPEPPAPPRPPV 18,000 16,604.67 16,000 14,000 12,000 10,000 8,000 6,000 4,000 7,096.15 8,067.15 4,849.83 5,126.34 5,021.58 6,141.00 5,308.30 398.10 317.11 311.88 283.072011201220132014 2,000 03
PPEs definitionPotentially preventable events analyzed by HHSC include: Potentially preventable emergency room visit (PPR): Emergencytreatment for a condition that could have been, treated or prevented by aphysician or other health care provider in a nonemergency setting. Potentially preventable readmission (PPR): A return hospitalization withina set time period that might have resulted from problems in the care during aprevious hospital stay or from deficiencies in a post-hospital dischargefollow-up. NOTE: For the report, PPRs are expressed as PPR chains (one or more PPRs within areadmission window). Potentially preventable admission (PPA): A hospital admission or a longterm care facility stay that might have been reasonably prevented withadequate access to ambulatory care or health care coordination. Potentially preventable complication (PPC): A harmful event or negativeoutcome, such as an infection or surgical complication, that occurs after ahospital admission or a long-term care facility stay and might have resultedfrom the care, lack of care, or treatment provided during the admission orstay.4
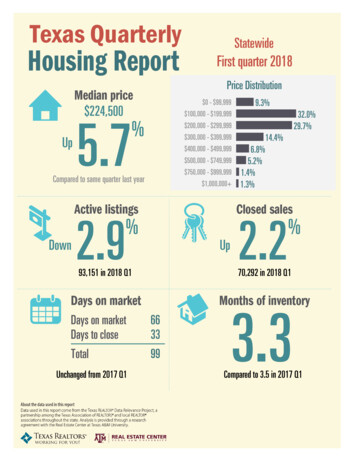
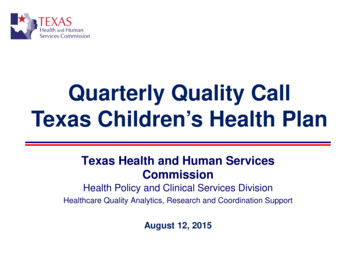
STAR PPR on WebsiteMEDICAID / CHIP MANAGED CARE ORGANIZATION (MCO), POTENTIALLYPREVENTABLE EVENTS (PPE) DATA, CALENDAR YEARS 2011-2014 * 2,5001.40 2,0001.00Actual-to-expected (A/E) ratioPPE costs per 1,000 member months (MM)1.20 1,5000.800.60 1,0000.40 5000.20 0CY11 PPR STAR TexasChildren's Health PlanTOTAL922.5CY12 PPR STAR TexasChildren's Health PlanTOTAL1048.73CY13 PPR STAR TexasChildren's Health PlanTOTAL1992.56CY14 PPR STAR TexasChildren's Health PlanTOTAL798.33A/E Ratio1.021.121.280.86PPEs per 1,000 MM0.130.130.120.13Costs per 1,000 MM0.005
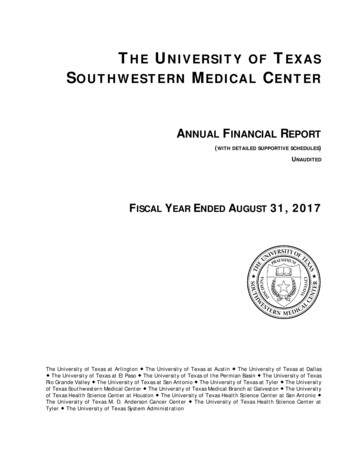
PPR A/E Ratios by Service 320146
Cost per PPR by Service AreaPlanHarris 18,000Jefferson 17,000.42 16,604.67 16,000 16,568.00 14,000 12,000 10,000 8,000 6,000 8,593.75 7,173.85 8,067.15 7,096.15 6,508.47 8,921.00 6,141.00 5,684.08 4,000 2,000 2,379.31 020112012201320147
PPR Cost per 1,000 MM by Service AreaPlanHarrisJefferson 2,500 2,040 2,000 1,993 1,988 1,500 1,427 1,237 1,000 933 923 500 1,049 798 1,031 739 619 020112012201320148
Cost per PPR StatewideSTAR TotalTexas Children's Health Plan 18,000 16,604.67 16,000 14,000 12,000 10,000 8,000 7,096.15 6,000 6,823.33 8,067.15 7,181.60 7,596.6520122013 6,457.48 6,141.00 4,000 2,000 0201120149
PPR Cost per 1,000 MMSTAR TotalTexas Children's Health Plan 2,500 2,000 1,993 1,500 1,436 1,519 1,356 1,228.00 1,000 923.00 1,049 798 500 0201120122013201410
PPR A/E Ratios in Harris SA20142013UnitedHealthCare Community PlanTexas Children's Health PlanMolina Healthcare of Texas, Inc.Community Health ChoiceAmerigroup2012TOTAL STAR201100.20.40.60.811.21.411
Cost per PPR All Plans Harris SAAmerigroupCommunity Health ChoiceMolina Healthcare of Texas, Inc.UnitedHealthCare Community Plan 10,000 9,000 8,000 7,000 6,000 5,000 4,000 3,000 2,000 1,000 0201120122013201412
Cost per PPR All Plans Harris SATOTAL STARAmerigroupCommunity Health ChoiceMolina Healthcare of Texas, Inc.UnitedHealthCare Community Plan 10,000 9,000 8,000 7,000 6,000 5,000 4,000 3,000 2,000 1,000 0201120122013201413
Cost per PPR All Plans Harris SATOTAL STARAmerigroupCommunity Health ChoiceMolina Healthcare of Texas, Inc.Texas Children's Health PlanUnitedHealthCare Community Plan 18,000 16,000 14,000 12,000 10,000 8,000 6,000 4,000201120122013201414
PPR Cost per 1,000 MM Harris SAAmerigroupCommunity Health ChoiceMolina Healthcare of Texas, Inc.UnitedHealthCare Community Plan 2,000 1,800 1,600 1,400 1,200 1,000 800 600 400 200 02011201220132014*MM: Member Months; SA: Service Area15
PPR Cost per 1,000 MM Harris SATOTAL STARAmerigroupCommunity Health ChoiceMolina Healthcare of Texas, Inc.UnitedHealthCare Community Plan 2,000 1,800 1,600 1,400 1,200 1,000 800 600 400 200 0201120122013201416
PPR Cost per 1,000 MM Harris SATOTAL STARAmerigroupCommunity Health ChoiceMolina Healthcare of Texas, Inc.Texas Children's Health PlanUnitedHealthCare Community Plan 2,000 1,800 1,600 1,400 1,200 1,000 800 600 400 200 0201120122013201417
PPR A/E Ratios Jefferson SA20142013UnitedHealthCare Community PlanTexas Children's Health PlanMolina Healthcare of Texas, Inc.Community Health ChoiceAmerigroup2012TOTAL201100.511.522.533.518
Cost per PPR Jefferson SAAmerigroupCommunity Health ChoiceMolina Healthcare of Texas, Inc.UnitedHealthCare Community Plan 9,000 8,000 7,000 6,000 5,000 4,000 3,000 2,000 1,000 0201120122013201419
Cost per PPR Jefferson SASTAR TotalAmerigroupCommunity Health ChoiceMolina Healthcare of Texas, Inc.UnitedHealthCare Community Plan 9,000 8,000 7,000 6,000 5,000 4,000 3,000 2,000 1,000 0201120122013201420
Cost per PPR Jefferson SASTAR TotalAmerigroupCommunity Health ChoiceMolina Healthcare of Texas, Inc.Texas Children's Health PlanUnitedHealthCare Community Plan 18,000 16,000 14,000 12,000 10,000 8,000 6,000 4,000 2,000 0201120122013201421
PPR Cost per 1,000 MM Jefferson SAAmerigroupCommunity Health ChoiceMolina Healthcare of Texas, Inc.UnitedHealthCare Community Plan 3,500 3,000 2,500 2,000 1,500 1,000 500 0201120122013201422
PPR Cost per 1,000 MM Jefferson SASTAR TotalAmerigroupCommunity Health ChoiceMolina Healthcare of Texas, Inc.UnitedHealthCare Community Plan 3,500 3,000 2,500 2,000 1,500 1,000 500 0201120122013201423
PPR Cost per 1,000 MM Jefferson SASTAR TotalAmerigroupCommunity Health ChoiceMolina Healthcare of Texas, Inc.Texas Children's Health PlanUnitedHealthCare Community Plan 3,500 3,000 2,500 2,000 1,500 1,000 500 0201120122013201424
2013 PPR All STAR health plansUnitedHealthCare Community PlanTexas Children's Health PlanSuperior HealthPlanSeton Health PlanSendero Health PlansRightCare from Scott & White Health PlanParkland Community Health PlanMolina Healthcare of Texas, Inc.FirstCareCost per PPREl Paso First Health Plans, IncCost per 1,000MMDriscoll Health PlanCook Children's Health PlanCommunity Health ChoiceCommunity First Health PlansCHRISTUS Health PlanBlue Cross Blue Shield of TexasAmerigroupAetna Better HealthTOTAL 0 2,000 4,000 6,000 8,000 10,000 12,000 14,000 16,000 18,00025
2012UnitedHealthCare Community PlanUNICARE Health Plan of Texas Inc.Texas Children's Health PlanSuperior HealthPlanSeton Health PlanSendero Health PlansRightCare from Scott & White Health PlanParkland Community Health PlanMolina Healthcare of Texas, Inc.FirstCareCost per PPREl Paso First Health Plans, IncCost per 1,000MMDriscoll Health PlanCook Children's Health PlanCommunity Health ChoiceCommunity First Health PlansCHRISTUS Health PlanBlue Cross Blue Shield of TexasAmerigroupAetna Better HealthTOTAL 0 2,000 4,000 6,000 8,000 10,000 12,000 14,00026
2014*UnitedHealthCare Community PlanTexas Children's Health PlanSuperior HealthPlanSeton Health PlanSendero Health PlansRightCare from Scott & White Health PlanParkland Community Health PlanMolina Healthcare of Texas, Inc.FirstCareCost per PPREl Paso First Health Plans, IncCost per 1,000MMDriscoll Health PlanCook Children's Health PlanCommunity Health ChoiceCommunity First Health PlansCHRISTUS Health PlanBlue Cross Blue Shield of TexasAmerigroupAetna Better HealthTOTAL 0 2,000 4,000 6,000 8,000 10,000 12,000 14,000 16,000 18,000* Partial data (5 months)27
PPR ReasonsOverall Plan Number FrequencyMedical readmission for acute medical condition or complicationthat may be related to or may have resulted from care during initialadmission or in post-discharge period after initial admissionMental health or substance abuse readmission following an initialadmission for a substance abuse or mental health diagnosisMedical readmission for a continuation or recurrence of the reason forthe initial admission, or for a closely related conditionAll other readmissions for a chronic problem that may be related tocare either during or after the initial admissionReadmission for surgical procedure to address a complication thatmay be related to or may have resulted from care during the initialadmissionReadmission for surgical procedure to address a continuation or arecurrence of the problem causing the initial admissionReadmission for mental health reasons following an initial admissionfor a non-mental health, non-substance abuse reasonAmbulatory care sensitive conditions as designated by 1.64%20.47%28
DevelopmentsAlternative payment structures VBP contracts (next slide)Performance Improvement Plans 2014: STAR (next slide)Super-utilizers Your plan and targetMedicaid Transformation Waiver Delivery System Reform Incentive Payment (DSRIP)Program projects by RHP (next slide)29
73.090.380.053.256.490.021.7Report Score Average2013 PIP Score2013 Final PIP Report Score Averages by Plan100.030.00.0Health Plan31
2013 PIP Score by Topic2013 Final PIP Report Scores by TopicProgramTopicSTARAsthma EDSTARAWC W34STARPostpartum careFinalScore90.3100.0100.02013 Final PIP Report Topic Count andScoresAverage Minimum .71001570.323.610032
2014 PIPsLine ofBusinessTexasChildren'sTexasChildren'sCY 2014 MCO Performance Improvement ProjectsService AreaMCO PartnersPIP Topic(SA)Asthma Management,measured by asthmaCHC, AmerigroupSTARHarrismedication measures,PPAsSTARHarris,JeffersonFollow-up after HospitalMH (FUH) in 7 daysN/A33
Partnership OpportunityMedicaid Waiver Harris* – RHP 3 Jefferson* – RHP 2*STAR34
Parkland Community Health Plan. RightCare from Scott & White Health Plan. . 10,000. 12,000. 14,000. TOTAL. Aetna Better Health. Amerigroup. Blue Cross Blue Shield of Texas. CHRISTUS Health Plan. Community First Health Plans. Community Health Choice. Cook Children's Health Plan. Driscoll Health Plan . Overall Plan Number . Frequency .