Transcription
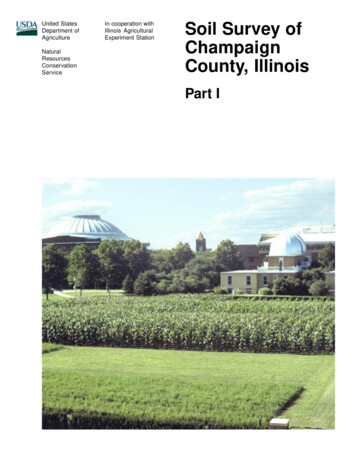
United StatesDepartment ofAgricultureNaturalResourcesConservationServiceIn cooperation withIllinois AgriculturalExperiment StationSoil Survey ofChampaignCounty, IllinoisPart I
NRCS Accessibility StatementThe Natural Resources Conservation Service (NRCS) is committed to making itsinformation accessible to all of its customers and employees. If you are experiencingaccessibility issues and need assistance, please contact our Helpdesk by phone at1-800-457-3642 or by e-mail at helpdesk@helpdesk.itc.nrcs.usda.gov. For assistancewith publications that include maps, graphs, or similar forms of information, you mayalso wish to contact our State or local office. You can locate the correct office andphone number at http://offices.sc.egov.usda.gov/locator/app.
3How To Use This Soil SurveyThis survey is divided into three parts. Part I includes general information about the survey area, descriptions ofthe detailed soil map units and soil series in the area, and a description of how the soils formed. Part IIdescribes the use and management of the soils and the major soil properties. This part may be updated asfurther information about soil management becomes available. Part III includes the maps.Detailed Soil MapsThe detailed soil maps can be useful in planning the use and management of smallareas.To find information about your area of interest, locate that area on theIndex to Map Sheets. Note the number of the map sheet andturn to that sheet.Locate your area of interest on themap sheet. Note the map unitsymbols that are in that area. Turnto the Contents in Part I, whichlists the map units by symbol andname and shows the page whereeach map unit is described.The Contents in Part II showswhich table has data on a specificland use for each detailed soil mapunit. Also see the Contents forsections of this publication thatmay address your specific needs.
4This soil survey is a publication of the National Cooperative Soil Survey, a joint effortof the United States Department of Agriculture and other Federal agencies, Stateagencies including the Agricultural Experiment Stations, and local agencies. TheNatural Resources Conservation Service (formerly the Soil Conservation Service) hasleadership for the Federal part of the National Cooperative Soil Survey.Major fieldwork for this soil survey was completed in 1998. Soil names anddescriptions were approved in 1999. Unless otherwise indicated, statements in thispublication refer to conditions in the survey area in 1998. This survey was madecooperatively by the Natural Resources Conservation Service and the IllinoisAgricultural Experiment Station. It is part of the technical assistance furnished to theChampaign County Soil and Water Conservation District. Funding was provided by theChampaign County Soil and Water Conservation District and the Illinois Department ofAgriculture.Soil maps in this survey may be copied without permission. Enlargement of thesemaps, however, could cause misunderstanding of the detail of mapping. If enlarged,maps do not show the small areas of contrasting soils that could have been shown at alarger scale.The United States Department of Agriculture (USDA) prohibits discrimination in all ofits programs on the basis of race, color, national origin, gender, religion, age, disability,political beliefs, sexual orientation, and marital or family status. (Not all prohibited basesapply to all programs.) Persons with disabilities who require alternative means forcommunication of program information (Braille, large print, audiotape, etc.) shouldcontact the USDA’s TARGET Center at 202-720-2600 (voice or TDD).To file a complaint of discrimination, write USDA, Director, Office of Civil Rights,Room 326W, Whitten Building, 14th and Independence Avenue SW, Washington, DC20250-9410, or call 202-720-5964 (voice or TDD). USDA is an equal opportunityprovider and employer.Cover: The Morrow Plots in an area of Flanagan silt loam, 0 to 2 percent slopes, at the Universityof Illinois. These fields, which were established in 1876, are the oldest continuously used experimentfields in the United States.Additional information about the Nation’s natural resources is available on theNatural Resources Conservation Service home page on the World Wide Web. Theaddress is http://www.nrcs.usda.gov (click on “Technical Resources”).
5ContentsHow To Use This Soil Survey . 3Foreword . 9General Nature of the County . 11History and Development . 11Natural Resources . 12Physiography, Relief, and Drainage . 12Climate . 13How This Survey Was Made . 15Formation and Classification of the Soils . 17Formation of the Soils . 17Parent Material . 17Climate . 18Relief . 18Plant and Animal Life . 19Time . 20Classification of the Soils . 20Soil Series and Detailed Soil Map Units . 21Alvin Series . 22131B—Alvin fine sandy loam, 2 to 5 percentslopes . 23Ambraw Series . 233302A—Ambraw silty clay loam, 0 to 2percent slopes, frequently flooded . 24Ashkum Series . 24232A—Ashkum silty clay loam, 0 to 2 percentslopes . 25Birkbeck Series . 26233B—Birkbeck silt loam, 2 to 5 percentslopes . 27Blackberry Series . 28679B—Blackberry silt loam, 2 to 5 percentslopes . 29Blount Series . 2923A—Blount silt loam, 0 to 2 percent slopes . 3023B2—Blount silt loam, 2 to 4 percent slopes,eroded . 31Brenton Series . 31149A—Brenton silt loam, 0 to 2 percentslopes . 32Bryce Series . 32235A—Bryce silty clay, 0 to 2 percent slopes . 33Camden Series . 34134A—Camden silt loam, 0 to 2 percentslopes . 35134B—Camden silt loam, 2 to 5 percentslopes . 35Campton Series . 36680B—Campton silt loam, 2 to 5 percentslopes . 37Catlin Series . 37171B—Catlin silt loam, 2 to 5 percent slopes . 38Chatsworth Series . 38241C3—Chatsworth silty clay, 4 to 6 percentslopes, severely eroded . 39241D3—Chatsworth silty clay, 6 to 12 percentslopes, severely eroded . 40Clare Series . 40663B—Clare silt loam, 2 to 5 percent slopes . 41Dana Series . 4256B—Dana silt loam, 2 to 5 percent slopes . 4356B2—Dana silt loam, 2 to 5 percent slopes,eroded . 44Drummer Series . 44152A—Drummer silty clay loam, 0 to 2percent slopes . 45Elburn Series . 45198A—Elburn silt loam, 0 to 2 percent slopes . 47Elliott Series . 47146A—Elliott silt loam, 0 to 2 percent slopes . 48146B2—Elliott silty clay loam, 2 to 4 percentslopes, eroded . 49146C2—Elliott silty clay loam, 4 to 6 percentslopes, eroded . 49Flanagan Series . 49154A—Flanagan silt loam, 0 to 2 percentslopes . 50Harpster Series . 5167A—Harpster silty clay loam, 0 to 2 percentslopes . 52Kendall Series . 52242A—Kendall silt loam, 0 to 2 percent slopes . 54Kishwaukee Series . 54623A—Kishwaukee silt loam, 0 to 2 percentslopes . 55La Hogue Series . 55102A—La Hogue loam, 0 to 2 percent slopes . 56830—Landfills . 57Martinsville Series . 57
6570B—Martinsville silt loam, 2 to 5 percentslopes . 58570C2—Martinsville loam, 5 to 10 percentslopes, eroded . 59570D2—Martinsville loam, 10 to 18 percentslopes, eroded . 59Millbrook Series . 60219A—Millbrook silt loam, 0 to 2 percentslopes . 61Mona Series . 61448B—Mona silt loam, 2 to 5 percent slopes . 62Muskego Series . 63637A —Muskego silty clay loam, 0 to 2percent slopes, overwash . 63Ockley Series . 64387B—Ockley silt loam, 2 to 5 percentslopes . 65387C3—Ockley clay loam, 5 to 10 percentslopes, severely eroded . 65Odell Series . 66490A—Odell silt loam, 0 to 2 percent slopes . 66Onarga Series . 67150B—Onarga sandy loam, 2 to 5 percentslopes . 68802B—Orthents, loamy, undulating . 68Ozaukee Series . 69530B—Ozaukee silt loam, 2 to 4 percentslopes . 70530C2—Ozaukee silt loam, 4 to 6 percentslopes, eroded . 70530D2—Ozaukee silt loam, 6 to 12 percentslopes, eroded . 71530E2—Ozaukee silt loam, 12 to 20 percentslopes, eroded . 71Pella Series . 72153A—Pella silty clay loam, 0 to 2 percentslopes . 73Penfield Series . 73687B—Penfield loam, 2 to 5 percent slopes . 74687C2—Penfield loam, 5 to 10 percentslopes, eroded . 75Peotone Series . 75330A—Peotone silty clay loam, 0 to 2 percentslopes . 76865—Pits, gravel . 76Proctor Series . 76148B2—Proctor silt loam, 2 to 5 percentslopes, eroded . 77Raub Series . 78481A—Raub silt loam, 0 to 2 percent slopes . 79Rossburg Series . 793473A—Rossburg silt loam, 0 to 2 percentslopes, frequently flooded . 80Russell Series . 80322C2—Russell silt loam, 5 to 10 percentslopes, eroded . 81Sabina Series . 82236A—Sabina silt loam, 0 to 2 percentslopes . 83Sawmill Series . 843107A—Sawmill silty clay loam, 0 to 2 percentslopes, frequently flooded . 85Selma Series . 85125A—Selma loam, 0 to 2 percent slopes. 86Senachwine Series . 86618B—Senachwine silt loam, 2 to 5 percentslopes . 87618C2—Senachwine silt loam, 5 to 10percent slopes, eroded . 88618D2—Senachwine silt loam, 10 to 18percent slopes, eroded . 88618E2—Senachwine silt loam, 18 to 25percent slopes, eroded . 89618F—Senachwine silt loam, 18 to 35percent slopes . 89Sunbury Series . 89234A—Sunbury silt loam, 0 to 2 percentslopes . 91Swygert Series . 9191A—Swygert silty clay loam, 0 to 2 percentslopes . 9291B2—Swygert silty clay loam, 2 to 4 percentslopes, eroded . 9391C2—Swygert silty clay loam, 4 to 6 percentslopes, eroded . 93Thorp Series . 94206A—Thorp silt loam, 0 to 2 percent slopes . 95533—Urban land . 95
7Varna Series . 95223B2—Varna silt loam, 2 to 4 percentslopes, eroded . 96223C2—Varna silt loam, 4 to 6 percentslopes, eroded . 97223D3—Varna silty clay loam, 6 to 12 percentslopes, severely eroded . 97Wyanet Series . 97622B—Wyanet silt loam, 2 to 5 percentslopes . 98622C2—Wyanet silt loam, 5 to 10 percentslopes, eroded . 99622D3—Wyanet clay loam, 10 to 18 percentslopes, severely eroded . 99Xenia Series . 99291B—Xenia silt loam, 2 to 5 percentslopes . 100References . 103Glossary . 105Tables . 115Table 1.—Temperature and Precipitation . 116Table 2.—Freeze Dates in Spring and Fall . 117Table 3.—Growing Season . 117Table 4.—Classification of the Soils . 118Table 5.—Acreage and Proportionate Extentof the Soils . 119Issued 2001
9ForewordThis soil survey contains information that affects land use planning in this surveyarea. It contains predictions of soil behavior for selected land uses. The survey alsohighlights soil limitations, improvements needed to overcome the limitations, and theimpact of selected land uses on the environment.This soil survey is designed for many different users. Farmers, foresters, andagronomists can use it to evaluate the potential of the soil and the management neededfor maximum food and fiber production. Planners, community officials, engineers,developers, builders, and home buyers can use the survey to plan land use, select sitesfor construction, and identify special practices needed to ensure proper performance.Conservationists, teachers, students, and specialists in recreation, wildlifemanagement, waste disposal, and pollution control can use the survey to help themunderstand, protect, and enhance the environment.Various land use regulations of Federal, State, and local governments may imposespecial restrictions on land use or land treatment. The information in this report isintended to identify soil properties that are used in making various land use or landtreatment decisions. Statements made in this report are intended to help the land usersidentify and reduce the effects of soil limitations on various land uses. The landowner oruser is responsible for identifying and complying with existing laws and regulations.Great differences in soil properties can occur within short distances. Some soils areseasonally wet or subject to flooding. Some are shallow to bedrock. Some are toounstable to be used as a foundation for buildings or roads. Clayey or wet soils arepoorly suited to use as septic tank absorption fields. A high water table makes a soilpoorly suited to basements or underground installations.These and many other soil properties that affect land use are described in this soilsurvey. The location of each soil is shown on the detailed soil maps. Each soil in thesurvey area is described. Information on specific uses is given for each soil. Help inusing this publication and additional information are available at the local office of theNatural Resources Conservation Service or the Cooperative Extension Service.William J. GradleState ConservationistNatural Resources Conservation Service
11Soil Survey ofChampaign County, IllinoisBy Tonie J. Endres, soil scientist, Natural Resources Conservation ServiceOriginal fieldwork by H.R. Mount, C.C. Cochran, and C.E. Wacker, soil scientists,Soil Conservation Service, and S. Engel, soil scientist, Champaign CountyUpdated fieldwork by Tonie J. Endres and Sam E. Werner, soil scientists,Natural Resources Conservation ServiceMap compilation by J.D. Ennis, geographer, and Tonie J. Endres and Sam E. Werner,soil scientists, Natural Resources Conservation Service; Earl E. Voss, CertifiedProfessional Soil Classifier; and the Illinois State Geological SurveyUnited States Department of Agriculture, Natural Resources Conservation Service,in cooperation withthe Illinois Agricultural Experiment StationCHAMPAIGN COUNTY is in east-central Illinois (fig. 1). Itis bounded by Ford County on the north, VermilionCounty on the east, Douglas County on the south, andPiatt and McLean Counties on the west. ChampaignCounty has an area of 638,860 acres, or about 998square miles. In 1990, the population of the countywas 175,179. Urbana, the county seat, had apopulation of 36,081, and Champaign, the largest city,had a population of 64,350 (U.S. Department ofCommerce, 1994).This soil survey updates previous surveys ofChampaign County (Mount, 1982; Alexander andothers, 1974; Hopkins and others, 1918). It providesadditional information and has larger maps, whichshow the soils in greater detail.General Nature of the CountyThis section provides general information aboutChampaign County. It describes history anddevelopment; natural resources; physiography, relief,and drainage; and climate.History and DevelopmentThe area now known as Champaign County wasformerly occupied by the Kickapoo Indians. On July30, 1819, a treaty was entered into between theUnited States and the Kickapoo Indians (Cunningham,1984). Champaign County was established onFebruary 20, 1833, and Urbana was named as thecounty seat.Originally, the survey area had much wet, marshyland. Settlement of Champaign County was curtailedby the extent of land needing drainage. Raising cattlewas the primary early industry. Extensive work ondrainage began in 1878. This drainage system allowedthe cultivation of the wet, marshy areas. As a result,the major land use changed from cattle raising to grainfarming.In 1867, a land grant college, later to become theUniversity of Illinois, was established in theChampaign-Urbana area. The university has been amajor influence in the economic and culturaldevelopment of the county. About 1,900 acres of
12Soil Survey of SPRINGFIELDFigure 1.—Location of Champaign County in Illinois.agricultural experiment fields, including the MorrowPlots, the oldest continuously used experimental plotsin the United States, is adjacent to the campus.Parkland Junior College is also located in ChampaignCounty.Although urban development is likely to continue inthe future, agriculture and agribusiness will remainimportant parts of the local economy. About 86 percentof the acreage in the county is used for cultivatedcrops, primarily corn and soybeans (USDA, 1997).Natural ResourcesSoil is a major and valuable resource in ChampaignCounty. It provides a base for agriculture, the mainstayof the economy in the county. In 1997, there were1,371 farms in the county on 567,697 acres. Theaverage farm size was about 414 acres (USDA, 1997).The major crops are corn and soybeans. Secondaryfarm products include wheat, oats, hay, cattle, hogs,and dairy products. The county has some of the mostproductive farmland in the state. Most of the soils arenearly level or gently sloping and formed in mediumtextured soil material under tall prairie grasses.Combined with a favorable climate, these factors resultin highly productive farmland.About 5,330 acres in the county is forestland(USDA, 1997). Much of this acreage is unimprovedland along the major streams. Wildlife generally isscarce because much of the suitable habitat has beendestroyed. There are no natural lakes in the county.The many manmade ponds and the streams provideopportunities for fishing. Homer Lake and Lake of theWoods are the largest artificial water impoundments inthe county. Sunfish, bass, crappie, catfish, andnorthern pike are the major game fish.Subsurface natural resources include water, sandand gravel, and coal. Most of the water supply ispumped from an aquifer system in the Teays-MahometValley, a major bedrock valley in the northwestern partof the county. Sand and gravel resources in the countyare of glacial origin, deposited by meltwater fromreceding glaciers (Anderson, 1960). Outwash plainsnear the Cerro Gordo and Bloomington moraines area major source of commercial sand and gravel in thecounty. There are about 305 million tons of coal,consisting of the Danville (No. 7) and Herrin (No. 6)seams, below the surface of the county (Treworgy andBargh, 1982).The transportation facilities in Champaign Countyinclude Federal and State highways, county andtownship roads, railroads, and small airports.Interstate Highways 57, 72, and 74 and FederalHighways 45, 136, and 150 cross the county. SeveralState and county roads also provide importanttransportation links. Most of the secondary townshipand county roads are blacktop. Railroads provide bothpassenger and freight service. Several rail lines passthrough the Champaign-Urbana area. A major airportsouth of Savoy provides commercial air service, andseveral smaller airports are throughout the county.Physiography, Relief, and DrainageChampaign County is entirely within theBloomington Ridged Plain of the Central Lowlandphysiographic province (Leighton and others, 1948).The Bloomington Ridged Plain is part of theWisconsinan till plain that is characterized by a seriesof end moraines and ground moraines.Champaign County also lies within two major landresource areas (MLRA’s). MLRA’s are geographicareas that are characterized by a particular pattern ofsoils, climate, water resources, and land uses (USDA,
Champaign County, Illinois—Part I1981). Each MLRA is designated by an Arabic numberand identified by a descriptive geographic name.MLRA 108 (Illinois and Iowa Deep Loess and Drift) isthe most extensive MLRA in Champaign County.Brenton, Catlin, Dana, Drummer, Elburn, Flanagan,Pella, and Raub soils are common in MLRA 108(fig. 2). MLRA 110 (Northern Illinois and IndianaHeavy Till Plain) is in the northern part of ChampaignCounty. Ashkum, Elliott, Ozaukee, Swygert, and Varnasoils are common in MLRA 110 (fig. 3).The Wisconsinan glacier was the most recent stageof glaciation in the county (Willman and others, 1975).This glacier deposited an average of 200 to 300 feet ofglacial drift, forming the present relief in the county(Piskin and Bergstrom, 1967). In most areas, this driftwas covered by as much as 5 feet of windblown silt, orloess.The county is dissected by several end morainesseparated by wide, nearly level ground moraines andoutwash plains. The highest feature in the county isthe Champaign Moraine, which reaches an elevationof 860 feet above sea level, north of Rising. The lowest13elevation, in the area where the Salt Fork leaves thecounty, is about 630 feet above sea level.Most areas are sufficiently drained for the cropscommonly grown in the county. Subsurface drainagesystems have been installed in fields across thecounty, and an extensive system of drainage ditcheshelps to supplement the natural drainage.The county is divided by five major river basins: theEmbarras River, the Little Vermilion River, theVermilion River, the Upper Kaskaskia River, and theUpper Sangamon River. The Upper Kaskaskia Riverbasin and the Upper Sangamon River basin are in thewestern part of the county, and watersheds drain in asouthwesterly direction. Watersheds within theEmbarras River, the Little Vermilion River, and theVermilion River basins drain in a southeasterlydirection.ClimateTable 1 gives data on temperature and precipitationfor the survey area as recorded at Urbana in theFigure 2.—Typical pattern of soils and parent material in MLRA 108 (Illinois and Iowa Deep Loess and Drift).
14Soil Survey ofFigure 3.—Typical pattern of soils and parent material in MLRA 110 (Northern Illinois and Indiana Heavy Till Plain).period 1961 to 1990. Table 2 shows probable dates ofthe first freeze in fall and the last freeze in spring.Table 3 provides data on length of the growing season.In winter, the average temperature is 27.1 degreesF and the average daily minimum temperature is 19.4degrees. The lowest temperature on record, whichoccurred on January 19, 1994, is -25 degrees. Insummer, the average temperature is 73.2 degrees andthe average daily maximum temperature is 83.7degrees. The highest recorded temperature, whichoccurred on July 14, 1954, is 109 degrees.Growing degree days are shown in table 1. Theyare equivalent to “heat units.” During the month,growing degree days accumulate by the amount thatthe average temperature each day exceeds a basetemperature (50 degrees F). The normal monthlyaccumulation is used to schedule single or successiveplantings of a crop between the last freeze in springand the first freeze in fall.The total annual precipitation is about 39.71 inches.Of this, 23.83 inches, or 60 percent, usually falls inApril through September. The growing season for mostcrops falls within this period. In 2 years out of 10, therainfall in April through September is less than 11.95inches. The heaviest 1-day rainfall on record was 5.32inches on August 12, 1993. Thunderstorms occur onabout 48 days each year, and most occur betweenMay and August.The average seasonal snowfall is about 28.1inches. The greatest snow depth at any one timeduring the period of record was 19 inches. On theaverage, 33 days of the year have at least 1 inch ofsnow on the ground. The number of such days variesgreatly from year to year.The average relative humidity in midafternoon isabout 60 percent. Humidity is higher at night, and theaverage at dawn is about 83 percent. The sun shines67 percent of the time possible in summer and 46
Champaign County, Illinois—Part Ipercent in winter. The prevailing wind is from the south.Average windspeed is highest, 11 to 12 miles perhour, from November to April.How This Survey Was MadeThis survey was made to provide information aboutthe soils and miscellaneous areas in the survey area.The information includes a description of the soils andmiscellaneous areas and their location and adiscussion of their suitability, limitations, andmanagement for specified uses. Soil scientistsobserved the steepness, length, and shape of theslopes; the general pattern of drainage; and the kindsof crops and native plants. To study the soil profile,which is the sequence of natural layers, or horizons, ina soil, soil scientists examine the soil with the aid of asoil probe or spade. The profile extends from thesurface down into the unconsolidated material in whichthe soil formed. The unconsolidated material is devoidof roots and other living organisms and has not beenchanged by other biological activity.The soils and miscellaneous areas in the surveyarea are in an orderly pattern that is related to thegeology, landforms, relief, climate, and naturalvegetation of the area. Each kind of soil andmiscellaneous area is associated with a particular kindof landform or with a segment of the landform. Byobserving the soils and miscellaneous areas in thesurvey area and relating their position to specificsegments of the landform, a soil scientist develops aconcept or model of how they were formed. Thus,during mapping, this model enable
Champaign County Soil and Water Conservation District. Funding was provided by the Champaign County Soil and Water Conservation District and the Illinois Department of Agriculture. Soil maps in this survey may be copied without permission. Enlargement of these maps, however, could cause misunderstanding of the detail of mapping. If enlarged,