Transcription
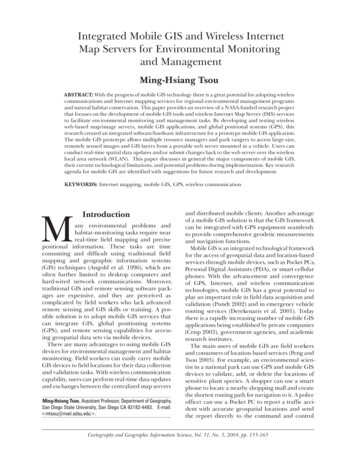
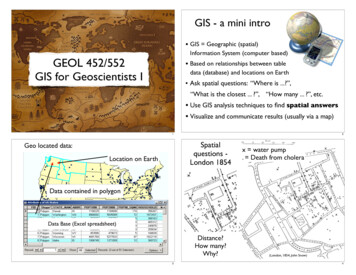
J9.6GIS TOOLS FOR VISUALIZATION AND ANALYSIS OF NEXRAD RADAR (WSR-88D)ARCHIVED DATA AT THE NATIONAL CLIMATIC DATA CENTERSteve Ansari *STG Incorporated, Asheville, North CarolinaStephen Del GrecoNOAA National Climatic Data Center, Asheville, North CarolinaABSTRACTThe NCDC ingests and archives, on average, 80terabytes of NEXRAD Radar Data and productsannually. These data are in high demand globally byboth the public and private sectors. As much as oneterabyte of data have been accessed monthly throughthe NCDC radar resources web page. In an effort toprovide better support to these end users, NCDC hasdeveloped visualization tools for browsing anddisplaying these data.The NCDC NEXRAD Interactive Viewer and DataExporter load NEXRAD volume scan data, known asLevel-II and derived products, known as Level-III, intoan OpenGIS compliant environment [6]. Theapplications are launched via Java Web Start and runon the client machine while accessing the data remotelyfrom the archive at the NCDC [5]. The NEXRADInteractive Viewer provides tools for custom dataoverlays, animations and basic queries. The export ofimages and movies is provided in multiple formats. TheNEXRAD Data Exporter allows for data export in bothvector polygon (Shapefile, GML, Well-Known Text) andraster (GeoTIFF, ARC/INFO ASCII Grid, HDF, NetCDF,GrADS, binary) formats [Appendix A].1. INTRODUCTIONThe NCDC Archive, commonly known as theHierarchical Data Storage System (HDSS), currentlystores 1.2 pedibytes of NEXRAD Radar data from thenetwork of 159 Weather Surveillance Radars – 1988Doppler (WSR-88D). This amount grows at a rate of 480gigabytes per day, with a potential increase to 6.5terabytes per day as new radar technologies areimplemented [3]. The data are acquired in near real-timewith a period of record beginning in 1991 and areprovided at no cost. While radar data are instrumental inclimate research and severe weather analysis, they arealso used in many other disciplines including hydrology,geography, biology and engineering.2. PURPOSEThe NCDC NEXRAD archive data are in a unique binary* Corresponding author address: Steve Ansari, NationalClimatic Data Center, 151 Patton Avenue, Asheville, NC28801; e-mail: steve.ansari@noaa.gov.format. By decoding the data into OpenGIS vectorfeatures and raster grid coverages, the data becomeaccessible to any OpenGIS compliant ApplicationProgramming Interface (API) [6]. The NEXRADInteractive Viewer displays the data in a GeoToolsbased GIS environment while the NEXRAD DataExporter provides the export of data to multiple commonformats [2]. Having NEXRAD data in multiple commonscientific formats promotes interdisciplinary use ofNEXRAD data. The NEXRAD Data Exporter acts as a“bridge” between the NEXRAD data and existingsoftware. Both NEXRAD Level-II and Level-III aresupported.3. INSTALLATIONThe NEXRAD Interactive Viewer and Data Exporter areboth written entirely in the Java programming language.Java programs are system-independent; they may berun without recompilation on a machine that has Javainstalled. Java is easy to install, free and open-source[4]. The Java NEXRAD Viewer and Exporter arelaunched via Java Web Start. Java Web Start allowsJava software applications to be deployed to the user’smachine in one seamless action. When invoked, JavaWeb Start checks for the most current version of theViewer and Exporter and updates are automaticallydownloaded if necessary [5]. To use the Viewer orExporter, follow the instructions on the NCDC JavaNEXRAD Viewer web page at the following ml.4. FEATURESThe NEXRAD Interactive Viewer provides severaldisplay and analysis features:1. Data overlays for states, counties, cities,interstates, airports and NEXRAD sites (Figure1).2. Load custom Shapefiles [1]. This allows for theaddition of high-resolution local data to map.3. Animations: View and save infinite lengthanimations as multiple movie formats.4. Filter NEXRAD Data and compare results to allloaded data.5. Perform grid math operations on rasterizeddata (max, min, avg, sum) (Figure 2, 3).6. Save viewer image to multiple image formats.7. Display Level-III alphanumeric data withgraphic Level-III or Level-II backgrounds(Figures 4, 5).
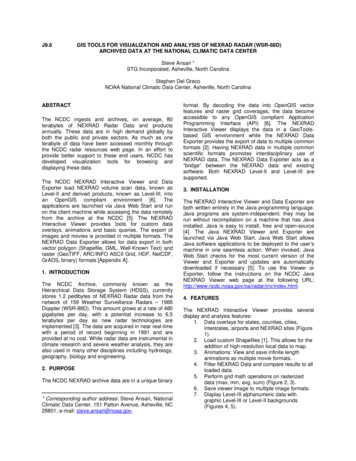
8.Save and load viewer session data andsettings.The NEXRAD Data Exporter adds several analysisfeatures:1. Export data to Shapefile, GML and Well KnownText (WKT) vector formats and GeoTIFF, HDF,NetCDF, ARC/INFO ASCII Grid, GrADS binaryand simple binary raster formats [Appendix A].2. User selectable raster resolution.3. Polygon reduction of vector data. Thissignificantly reduces the size of the outputvector file.Data (Figure 7). Age distributions were created forcensus blocks experiencing 4 or more inches ofprecipitation (Figures 8, 9).8. FUTURE WORKThe following features and functionality will be added tofuture versions of both the Viewer and Exporter.1. Additional export formats.2. Rules-based mosaic process.3. Additional import formats for custom displaylayers.4. User graphical annotations.5. PROCESSING9. CONCLUSIONNEXRAD data are ordered from the NCDC HDSS ov). A typical order takesbetween 15 minutes and one hour to be temporarilystaged on an NCDC FTP server. The Viewer andExporter access the data directly from the NCDC FTPserver. In addition, NEXRAD data in native formats arereadable from local files or any web server. TheExporter can also download ordered data to the usercomputer for permanent use.NEXRAD Level-II products are decoded through theincorporation of the Java IRAS code [7]. Any elevationangle and moment (reflectivity, velocity and spectrumwidth) may be selected. NCDC Decoders are useddecode the NEXRAD Level-III products. The graphicNEXRAD data are decoded into OpenGIS compliantpolygons with no loss of resolution [6]. Level-IIIAlphanumeric products (hail, tornado, storm tracking,etc.) are decoded into point or line vector formats. Allgeometry operations use the Vividsolutions’ JavaTopology Suite (JTS) [8]. The data are rasterized forefficient display. Both the raster and vector (polygon)representation of the data are available for display. Thevector features and raster grid coverage are renderedusing the GeoTools Java GIS API [2] (Figure 6).6. FLEXIBILITYThe Java NEXRAD Viewer and Exporter may be run asinteractive GUI programs, or as batch processes. Bothprograms can process data from the NCDC, the localmachine or any web server. This allows for real-timeanalysis and image creation when used with a real-timedata feed. Furthermore, the Java NEXRAD API may beused to create custom applications such as theintegration into a Web Map Service (WMS). The entireproject is open-source.7. APPLICATIONSThere are many applications of the Viewer and Exporter.For a case study, the NEXRAD Data Exporter was usedto convert the Level-III Storm Total Precipitation productfrom Hurricane Charley (August 13-14, 2004) intoShapefile format. The resulting shapefiles were loadedinto ESRI ArcGIS and compared to 2000 US CensusThe NEXRAD Interactive Viewer and Data Exporterprovide visualization and analysis tools for the NEXRADradar data stored in the NCDC Archive. CurrentViewer/Exporter users include the Federal EmergencyManagement Agency (FEMA), NASA, the Departmentof Defense (DOD) and the National Weather Service(NWS), as well as NCDC operations.The system independence, batch processing featuresand multiple export formats yield a powerful flexibilitythat promotes interdisciplinary use of NEXRAD Radardata in both real-time and historical analysis.10. REFERENCES1. ESRI, 1998: ESRI Shapefile Technical Description[Available from ESRI Website: tepapers/pdfs/shapefile.pdf.2. GeoTools Website: http://www.geotools.org.3. Hall, Alan, 2005: Current and Projected Receipt andArchive of WSR-88D Level II Data at the NationalndthClimatic Data Center., 22 IEEE / 13 NASA Goddard(MSST2005) Conference on Mass Storage Systemsand Technologies, Monterey CA, April 11-14, 2005.4. Java Website: http://www.java.com.5. Java Web Start jws/Readme.html.6. OpenGIS Website: http://www.opengeospatial.org/.7. Priegnitz, D.L., 1995: IRAS: Software to display andanalyze WSR-88D radar data., Eleventh InternationalConference on Interactive Information and ProcessingSystems for Meteorology, Oceanography, andHydrology, Boston, American Meteorological Society,197-199.8. Vividsolutions Java Topology Suite htm.
Figure 1. Map Overlays
Figure 2. 7-hour average Reflectivity for Hurricane Charley (Aug. 13 2004, 17:01-23:57 UTC)Figure 3. 7-hour maximum Reflectivity for Hurricane Charley (Aug. 13 2004, 17:01-23:57 UTC)
Figure 4. Tornado Vortex Signature with Base ReflectivityFigure 5. Tornado Supplemental Data
NEXRADLevel-IIBase oderOpenGIS FeatureCollection(Polygons)RasterizerOpenGISGrid Coverage(Raster)NEXRADInteractiveViewerImage Export: GIF,JPEG, PNG, etc Movie Export: MPEG,AVI, Quicktime (MOV)Figure 6. Java NEXRAD FlowchartNEXRADDataExporterShapefiles, ESRIGrids, GrADS,HDF, GeoTIFF,NetCDF
Figure 7. Census regions with 4.0 in precipitation during Hurricane CharleyFigure 8. Age distribution map for affected regions ( 4.0 inches precipitation) during Hurricane Charley
Figure 9. Age distribution graph for affected regions ( 4.0 inches precipitation) during Hurricane Charley
APPENDIX A1.ESRI Shapefile [1]: “A shapefile stores nontopological geometry and attribute information for the spatialfeatures in a data set. The geometry for a feature is stored as a shape comprising a set of vectorcoordinates.” For more information: http://www.esri.com2. Geography Markup Language (GML): “Geography Markup Language is an XML grammar written inXML Schema for the modeling, transport, and storage of geographic information.” For moreinformation: http://www.opengis.net/gml/3.Well-Known Text (WKT): An ASCII text representation of geometry data. Defined in the OpenGISConsortium “Simple Features for SQL” specification. For more information:http://dev.mysql.com/doc/mysql/en/GIS WKT format.html /index.jsp?topic /com.ibm.db2.udb.doc/opt/rsbp4120.htm4.GeoTIFF: “GeoTIFF represents an effort by over 160 different remote sensing, GIS, cartographic, andsurveying related companies and organizations to establish a TIFF based interchange format forgeoreferenced raster imagery.” For more information: .ARC/INFO ASCII Grid: Simple ASCII text format for raster grids with simple header information embeddedin the beginning of the file. For more information: http://www.geotools.org/ArcInfo ASCII Grid format6.Hierarchical Data Format (HDF): “At its lowest level, HDF is a physical file format for storing scientific data.At its highest level, HDF is a collection of utilities and applications for manipulating, viewing, and analyzingdata in HDF files. Between these levels, HDF is a software library that provides high-level APIs and a lowlevel data interface.” For more information: http://hdf.ncsa.uiuc.edu/7.NetCDF (network Common Data Form): “NetCDF (network Common Data Form) is an interface for arrayoriented data access and a freely-distributed collection of software libraries for C, Fortran, C , Java, andperl that provide implementations of the interface. The netCDF software was developed by Glenn Davis,Russ Rew, Steve Emmerson, John Caron, and Harvey Davies at the Unidata Program Center in Boulder,Colorado, and augmented by contributions from other netCDF users. The netCDF libraries define amachine-independent format for representing scientific data. Together, the interface, libraries, and formatsupport the creation, access, and sharing of scientific data.” For more tware/netcdf/index.html8.GrADS (Grid Analysis and Display System) Binary: Simple floating point binary grid file with additionalGrADS header file containing grid specifications. For more 9.Simple Binary: Floating point binary grid file with ARC/INFO header file containing grid specifications.
J9.6 GIS TOOLS FOR VISUALIZATION AND ANALYSIS OF NEXRAD RADAR (WSR-88D) ARCHIVED DATA AT THE NATIONAL CLIMATIC DATA CENTER Steve Ansari * STG Incorporated, Asheville, North Carolina . Hierarchical Data Format (HDF): "At its lowest level, HDF is a physical file format for storing scientific data.