Transcription
Fast Focus Context Visualizationof Large Scientific DataMartin Gasser VRVis Research Center, Vienna, AustriaAbstractVisualization of high-dimensional and time-dependentdata, resulting from computational simulation, is a verychallenging and resource-consuming task. Here, featurebased visualization approaches, which aim at a usercontrolled reduction of the data shown at one instance oftime, proof to be useful.In this paper, we present a framework for interactivehigh- dimensional visualization and feature specification.We put special emphasis on the design of the data accesslayer and the performance optimization of the highly interactive parts of our system.Keywords: interactive visualization, focus context visualization, feature specification, large data, linked viewsdata points, 10 dimensions of high-precision data and 100time steps would result in a file size of approximately480MBytes. In the future, dataset sizes in a magnitudeof 1.000.000 data points and noticeably more than hundred time steps can be expected, resulting in file sizes ofseveral GBytes. Loading such a dataset entirely to systemmemory usually is not a practical solution, therefore sophisticated data access policies are a crucial requirement.Visualization of high dimensional and large data is avery demanding procedure, requiring several problems tobe solved. Besides the functional requirements posed tothe software (e.g. loading/saving of feature specifications,cached data access), several non-functional-requirementshad to be met as well: Visualization at interactive frame rates1IntroductionCFD simulation (computational fluid dynamics) is amethod frequently employed to gain insight into flow phenomena that cannot be experimentally analyzed (at leastnot without extraordinary efforts).For example, oxidation processes in a catalytic converter are difficult to monitor in reality [4]. Typical questions would be how many toxic substances are present inthe exhaust fumes at a certain point in time or how muchsoot is accumulated during its operation.Besides the overhead for getting data samples that areaccurate enough for the representation of subject state inan experiment, each experiment would require the construction of a new prototype. So it can be stated thatcomputational flow simulation drastically shortens development cycles and allows the involved engineers to optimize their models before a real prototype is built.To efficiently support users during analysis time, adequate visualization of the simulation results is needed.Complex physical and chemical processes imply large result data, since a large number of potentially interestingdata dimensions is involved. Data size also depends onthe duration and the temporal resolution of unsteady simulations. Typical sizes of data sets lie in the range from250.000 to 1.000.000 data points, 15 data dimensions and20 – 100 time steps. For example, a data set with 500.000 Martin.Gasser@VRVis.at Open architecture for addition of new visualizationmethods Best possible exploitation of hardware resourcesIn this paper a framework is presented, which supports interactive visualization and analysis of complex data usingmultiple linked views, combining approaches from scientific visualization (SciVis) and information visualization(InfoVis).2 ConceptsBelow we explain several concepts that were incorporatedin our system.2.1Feature-Based VisualizationDue to the large overall amount of simulation data, not allthe data can be shown simultaneously. Data reduction is acrucial task in many visualization systems. We support afeature based approach, enabling the user to interactivelyselect essential data subsets he or she wants to view in special detail. So, the visual discrimination of data in focusfrom contextual data is supported by Focus Context visualization.
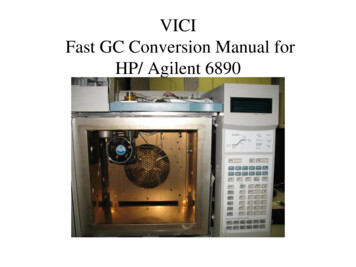
Figure 1: The SimVis application, showing the flow of hot gas through an object. Two scatterplots are used to markregions of interest, which are then visualized in the 3D view as color coded points.2.2Linked ViewsHigh dimensionality is a common challenge in information visualization (InfoVis) that can be effectively handledwith multiple views that show the same data through different projections, allowing the user to discover data clusters and other interesting features with an explorative approach.InfoVis usually is employed for the visualization of economic and other rather abstract data without any spatialdimensions. Scientific visualization (SciVis) usually dealswith spatial data and the reconstruction and visual enhancement of sampled or synthetic geometry. By linkingInfoVis and SciVis views, it is possible to locate a dataitem in the data domain as well as in 3D.Linked InfoVis/SciVis-views can also substantially decrease the perceptual complexity of visualizations, especially when the data dimensionality increases. Multipleviews can be used to localize data items in multiple projections of the data domain as well as in the spatial domain. A brushing widget can be used to mark regions ofinterest in one view, triggering an immediate update in theother views. The here employed technique is also calledLinking&Brushing [3].Figure 1 shows an overview of the application GUI. Twoscatterplots and one 3D rendering view are used. The visualized dataset shows the flow of hot gas through samplegeometry. The views show the data distribution of variousdimensions.2.3Feature DefinitionIn addition to the already existing semi-automatic approaches for feature extraction (see Post et al. [11] foran overview), we follow a highly interactive approach.Users can brush [1, 12] data in the various views bydirectly pointing at the data with an appropriate device(e.g. mouse) and selecting the regions of interest. Simple brushes are defined by giving lower and upper boundsfor data values.Simple brushes can be logically combined (see section3.1 for details) into more complex brushes (i.e. a set ofdata points that satisfy two or more constraints) and itis not only possible to say if something is important butalso how important it is by employing a technique calledSmooth Brushing [3].Conceptually, a brush maps each (n-dimensional) dataitem to some degree of interest (DOI) [6], hence this mapis called the degree-of-interest function. A possible way ofhow to implement this is a mapping from each data itemto a value from the continuous unit interval [0, 1], where 1means maximal importance (or full focus) and 0 means noimportance (or context).During visualization, the views can perform focus context discrimination by modulating the color andthe opacity of data items with respect to their DOI values.To sum up, brushes are represented as logical combinations of ranges on the individual data dimensions. Likefrom simple range selections, a DOI can be derived from
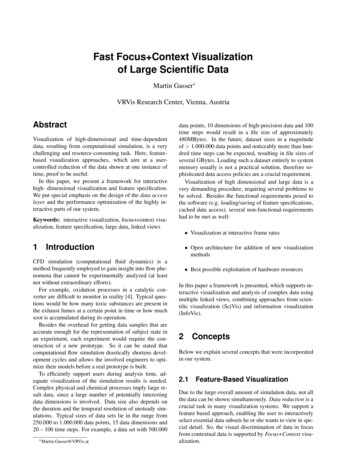
Other FeatureSetsOther FeatureDescriptionsFeature SetImplicit ORDOIFeature DescriptionImplicit ANDVisualizationViewDOIUFDL U NOT SpecificationViewFeature ComponentImplicit ANDDOIOther ionsSimple Selectionon TemperaturSimple Selectionon VelocitySimple Selectionon TimeFigure 2: A example FDL tree with associated DOIthe hierarchical combination of simple brushes, as well.Since this hierarchical structure allows feature definitions of arbitrary complexity in a syntactically and semantically well-defined manner, it was called Feature Definition Language (FDL) [2]. In Figure 2, an example FDLtree is depicted.Feature Definition LanguageA typical FDL specification has a tree structure, as depicted in figure 2. The meaning of the different node typesin the hierarchy can be best described in terms of logicalset operations. Since we need not only a binary classification of features, membership and logical combinationswere designed as fuzzy set operations (see section 3.1).The bottom level of the hierarchy is formed by SimpleSelections. One SimpleSelection constrains the valid datarange for data points in one dimension. The output of aSimpleSelection is a DOI function that classifies all datapoints that match the criterion as belonging to the feature.A ComplexSelection can compute the intersection, theunion, or the complement of sets of points, resulting in aDOI function that classifies all data points matching thecombined criterions of the child nodes. For an illustrationof the possible set operations, see figure 3. Since complexselections can be recursively combined, feature specifications of arbitrary complexity and dimensionality can beconstructed.Feature Components, Feature Descriptions, and Feature Sets are specializations of Complex Selections andwere designed to provide additional support for the needsof users in analysis sessions.Typically, a user specifies one feature in highdimensional space by exploring the data in multiple projections of that space and brushing interesting structures inselected projections. A brushing of data items in one viewFigure 3: Possible set operationsis then immediately reflected in the other views by coloring the affected points. Individual features are identifiedwith Feature Descriptions. Each view involved in the definition of a feature is bound to a Feature Component, providing a bidirectional mapping between views and FDLtree nodes. Additionally, the user may view the combination of all features she or he specified in a top level view(usually the 3D view), which is provided by a Feature Set.In order to distinguish points which are marked only inthe current view (but are not present in the combination ofconstraints as generated by other views) from points thatare marked in all views, a multi-level DOI concept was introduced. Views used to specify features show two pointsets as described by DOI functions, one resulting fromthe Feature Component which the view is bound to andone from the Feature Description that is build up by theindividual components. View discrimination is then performed by coloring data points from the Feature Set in redtones, while data points from the Feature Component onlyare drawn in yellow tones (see the scatterplot views in Fig.1 for an example).External RepresentationTo store and load feature definitions, an external representation of the FDL has been designed. Due to the inherenthierarchical nature of the FDL, it has been implementedas an XML [17] application. Since XML was designedto be human readable, this realization enables power usersto script feature definitions by directly manipulating theXML files with an ordinary text editor or a special XMLediting application.However, the average user does not formulate FDLstatements directly. The views automatically produce feature definitions during user interaction. Sometimes, this isnot fully appropriate (e.g., if known data boundaries haveto be entered with high precision).To provide mid-level feature manipulation without theneed to start an external text editor, an additional viewhas been designed that shows the tree structure directlyin a tree-like interface. Tree node attributes (like selection bounds or the different logical combinations) can bemanipulated manually and entire subtrees can be movedwith standard interaction techniques like copy&paste anddrag&drop.
5.015.030.280.0012345678.Degree of interest1Data access layerFeature DefinitonFramework0Min -3.0HUM FileData 3.20.1-3.0.0.010.00.00.00.341.00.00.00.0.Max 100.0Figure 4: Main software components2.4Time Dependent DataSpecial UI elements had to be designed to support the handling of time-dependent data. It is now possible to define aspecific time interval in each view. Data from this intervalis then visualized in the view, with successive time stepspainted one over the other.To allow more specific selections in the time dimension,we have added the time values for each data point as a firstorder dimension.2.5Data File FormatWe have defined the HUM (High performance unstructured mesh) file format for storing the simulation data andthe corresponding geometry. A separate converter application has been implemented to enable the conversion ofdata from our main industrial partner in this project to ourown data format. The internal representation of the data(see section 3.3) is closely related to that format.3Software ArchitectureFigure 4 shows the data flow between the main softwarecomponents. The Data Access Layer implements transparent data access and caching. The Views and the FeatureDefinition Framework perform bidirectional communication, relying heavily on the data access services.3.1Figure 5: On the lowest level of the feature definitionframework, each n-dimensional data point is mapped toa DOI value, according to its value in one dimensionDOI functions derived from simple selections can belogically combined to selections of higher dimensionality. Logical operations are currently realized as fuzzy minimum t-norms (for AND) and maximum t-conorms (forOR) and the complement on one (for negations) [8].d1 d2 min(d1, d2)d2 d2 max(d1, d2) d 1 d3.2ViewsEach feature specification stores a reference to the viewwhich created it and views can be opened and closed ondemand. Changes to tree nodes fire events that are propagated up the tree, resulting in an update of each view associated to a tree node in the path from the affected nodeto the root. The views act as Observers [7] that are notified whenever changes occur in the observed objects (feature specifications). Hence the feature specification hierarchy can be seen as a hierarchic hub, forwarding updaterequests only to those views that are affected by it and realizing implicit linking of all views that belong to the currentsubtree.In the following, a short overview of some of the viewsthat we already integrated into our system, is given.Feature Definition FrameworkThe FDL framework is built around a hierarchicaltree structure which logically combines simple onedimensional selections to more complex feature specifications following a descriptive and modular approach.From each node in the tree, a degree of interest functioncan be recursively derived.Each SimpleSelection (forming a leaf of the tree) defines a trapezoidal DOI function (see Fig. 5) that can beinterpreted as a fuzzy membership function.ScatterplotA (2D) scatterplot shows two-dimensional projections ofthe data space. Two components of an n-dimensional datapoint are interpreted as coordinates in a Cartesian coordinate system. Figure 6 shows a scatterplot that draws thetemperature values of the data points versus their relativepressure values. Points with medium relative pressure andhigh temperature have been classified as features with asmooth brushing widget.
TemperatureScatterplotMemory poolVelocityPressure3D view.Data channelsFile systemFigure 9: Overview of the data access layerHistogramFigure 6: A cluster in the combined distribution of temperature and pressure is selected in a scatterplotA histogram counts the frequencies of occurrences of datavalues in a particular data dimension. Since this is notdirectly possible for continuous data, the data range has tobe segmented into bins (small subranges) that represent adiscretized version of the data space.We implemented TimeHistograms as described inKosara et al. [9]. TimeHistograms offer special support fortime-dependent data, like visualization of trends or threedimensional histograms with time as third axis (see figure7).3D ViewFigure 7: Peaks in the distribution of velocity in x-directionare selected in a histogramThe 3D view is, as opposed to the previous two InfoVisviews, an extended SciVis view. It shows the distributionof the data points classified as belonging to a feature in 3Dspace but also gives hints about their position in data spacevia customizable color coding (e.g., the temperature rangeof points can be mapped to a color gradient from red togreen).Since continuous DOI functions are supported, theopacity of the displayed points is modulated by the corresponding degree-of-interest values. Data points with highDOI values are drawn opaque while a low degree of interest results in a rather translucent appearance, discriminating data in focus from context data.In figure 8, a 3D view shows hot and fast regions in asimulation of a catalytic converter.3.3Figure 8: The 3D view, showing hot regions in a catalyticconverterData Access LayerAs already stated, the data access part of the application isof particular importance for the efficient operation of thesoftware. Figure 9 illustrates the main system componentsand the data flow between them.In our data representation, data from one time step isstored in Channels. The channel class encapsulates an array of data values and provides bounds-checked accessorfunctions for those values. Multiple Channels can be collected in a TimeChannel. A TimeChannel organizes individual time steps, represented as channels and providessome meta data. Basically, one dimension can be associated with a TimeChannel.Channels are implemented following a Virtual Proxypattern [7], making transparent lazy loading (activating)
if (not QueueIsEmpty()) {LRUProxy el GetChannel(LRUProxy);AssignChannel(aProxy, EmptyChannel);}else {EmptyChannel GetChannelFromPool();AssignChannel(aProxy, nelProxyViewSwapIn(aProxy);ChannelPoolCacheFigure 10: The components associated with the data activation processof data possible. Figure 10 illustrates the data activationprocess and the associated components.Due to the fact that it is impossible (or at least very expensive in terms of system resources) to leave all channelsactivated, a caching algorithm based on a LRU queue hasbeen implemented.The following requirements were the cornerstones forthe design of the caching subsystem: Minimize the usage of the page replacement systemprovided by the OS Minimize the number of harddisk read accesses Minimize allocation/deallocation of large memoryblocksActivated ChannelProxies are stored in a global queue,with the last accessed proxy always at the head of thequeue. Whenever a ChannelProxy is accessed, the cachinglayer ensures that it is either moved to the front of theLRU queue or activated and then inserted at the front ofthe queue. If the channel has been already activated, thefunction immediately returns.The activation function itself tries to get the least recently used ChannelProxy from the queue and reuses itsConcreteChannel. If the channel stores read-only datafrom a file, the Cache can just reload the data if it isneeded. Generated data (e.g., data that has been derivedfrom existing data by applying a filter) is swapped out toanother file if needed.If the queue is empty – because all data channels are currently in use – the caching layer allocates an empty ConcreteChannel from the ChannelPool. The acquired ConcreteChannel is assigned to the ChannelProxy, which isthen loaded with the requested data.In the following, the caching algorithm is sketched.4Implementation issuesThe application was implemented in C (Visual C .NET) and Java (j2sdk 1.4.2). We combined the advantages of C – mainly the high optimizability of the code– and the advantages of Java – rapid user interface design– as good as possible.Essentially, all performance-critical parts were implemented in C . These parts include low level data access, OpenGL rendering, DOI calculation, and data filtering. The user interface components were implemented inJava.4.1Java-native BindingWe implemented the binding of native C object instances to their corresponding Java objects with JNI [15]and an adapted proxy [7] pattern. All Java objects thathave a native counterpart, act as proxies by just forwarding requests and caching values for succeeding read operations.Basically, our concept is simple: A Java object storesthe address of its corresponding C native object. Whenever a method of this object is called, another method withthe same signature, but marked as native, is called; thismethod is implemented in plain C (since JNI is a C API).In this C function, a pointer to the corresponding C native object is constructed from the address stored in theJava object and the object property is set. The obviousdrawback of this solution was the large coding overheadfor the C wrapper functions (which could be easily avoidedwith a code generation utility).Since it was a requirement to use OpenGL for the rendering part of the views, we needed a way of how to natively render to Java UI components. Since the JNI APIdid not expose native UI handles from the AWT before thearrival of JDK1.3, the first prototype of the system usedthe GL4Java API. Due to the developement stop of thisOpenGL implementation Java we soon decided to moveto a less proprietary solution. The JAWT interface (JavaAbstract Windowing Toolkit native interface) introducedcalls that returned handles to native windowing resourceswith the release of JDK1.3, which made it possible to create OpenGL rendering contexts [13].
55.1Performance OptimizationsHigh Level OptimizationsThe first version of the software was strictly synchronous,resulting in a blocking behaviour due to the fact that 90%of the computing time was spent in the calculation of theDOI values and mouse interaction continuously triggereda recomputation of the DOI values. Large datasets leftthe system completely unusable because mouse interaction was impossible.Our solution was to decouple the DOI computation fromthe user interface in a main thread and a DOI computationthread. The following pseudo code segment illustrates thealgorithm:function Recompute(Node) unInThread(RecomputeRec(Root));}function RecomputeRec(TreeNode) {foreach (child of TreeNode) {if IsDirty(child) etClean(TreeNode);}During the recursive depth-first traversal of the tree, eachcompleted node fires an update event for the r FindFirstGreaterThan(SortedData,lower);IndexUpper ft mic OptimizationsAn important optimization came with the algorithm in theprevious section: Only affected tree paths are recomputedbecause only the path from the updated node to the root isset dirty.The fundamental DOI functions in the simple selectionsare computed by calculating the value of the trapezoidalfunction for each data value in the corresponding data dimension. A straightforward implementation would loopthrough all the values and calculate the DOI value for eachof them. Since the trapezoidal function can be divided into4 regions we can split up the algorithm as well. In a preprocessing step, we have to sort the data along each dimension vk . This can be efficiently done with double-indexingvia a permutation array pk , so that vk [pk [i]] vk [pk [i 1]]is true for each dimension. Now we can perform binarysearch on each data dimension and find the indices of thebounds. Then we can construct the trapezoidal functionwith two linear interpolations and one constant period.Brush(DOI, {lowerSoft, lower,upper, upperSoft}) {IndexLowerSoft ndexUpper);InterpolateOneToZero(DOI,IndexUpper 1,IndexUpperSoft);}This yields a runtime of 4 O(log2 (n)) (versus O(n) withthe straightforward approach).5.3Low Level Programming OptimizationsDOI computationDue to the fact that the DOI computation subsystem isbased mainly on componentwise vector arithmetics, it waspossible to highly optimize that part of the software bytaking into account standard optimization techniques (loopunrolling, code inlining) as well as special features of thehardware the system was developed for. Our current production environment has the following technical details: OS: Windows XP Professional Intel Pentium 4, 2.8GHz 333 MHz FSB Hyperthreading support enabled Geforce FX 5900 2GB RAM 2x80GB S-ATA RAID0Intel processors from the Pentium III upwards support apowerful SIMD instruction set (Streaming SIMD Extensions [5]) that can perform calculations on four 32 bit floatvalues simultaneously. It was possible to heavily optimizethe calculation of the DOI function based on this extension, since it packs 4 operations into one.The Pentium IV supports the hyperthreading technology [14] that offers thread-level parallelism, enablingmulti-threaded applications to make much better use ofCPU resources than single-threaded applications. Therefore it was mandatory to implement the performancecritical parts of our software in a multi-threaded fashion.A quite obvious way how to do this was to partition the setof affected time steps per brushing operation in two partsand let two threads compute the DOI function in parallel.
3D renderingDue to the large amount of points to be rendered forone time step, simple immediate mode rendering ofGL POINTS is too slow. Through the employment of Vertex Arrays it is possible to render mesh geometries with1.000.000 geometry cells and more at interactive framerates. We also used the Vertex Buffer Objects (VBO) extension [16] that provides fine grained control over the vertexarray memory management and allows for tuning of thecaching policies for the vertex/color/index data arrays according to their update frequencies.Since we modulate the opacity of the rendered fragments with the DOI function, the hardware z-buffer cannot be used and rendering in back-to-front order is necessary to support hardware based alpha blending. The sorting is performed with an hybrid QuickSort/HeapSort algorithm that has running time O(n · log(n)) in the worst case(IntroSort, see [10]). Although the sorting performancedecreases when very large geometries are rendered, datasizes of up to 250.000 geometry cells can be rendered interactively ( 15 frames/second) with this algorithm. Anapproach based on using an approximate ordering basedon BucketSort (running time O(n)) during user interaction and exact sorting in idle periods has been consideredbut not yet been implemented.6ConclusionsWe have developed a system for the visualization and analysis of high-dimensional and time-dependent data. It allows users to interactively explore data space and specifyfeatures with multiple views. We have shown how it ispossible to handle large data sets in interactive applications on common PC hardware. Furthermore we have defined an extensible and scalable feature definition framework with a graphical as well as a text-based user interface. This generic approach allows a wide range of applications in the fields of scientific visualization (especiallyflow visualization) as well as information visualization.We have already proven the high usability of our systemin everyday life of researchers from the field of automotive engineering [4]. In the future, we hope that we canintensify our efforts in this direction as well as in otherapplication areas, such as the visualization of rather abstract data describing stock exchange courses and othereconomic data.7AcknowledgementsThis work has been carried out as part of the basic researchon visualization at the VRVis Research Center in Vienna,Austria (http://www.VRVis.at/vis/), which is partly fundedby an Austrian research program called KPlus. The authorwould like to thank Helmut Doleisch, Robert Kosara, andHelwig Hauser for supervision of this work.References[1] R. Becker and W. Cleveland. Brushing scatterplots. Technometrics, 29(2):127–142, 1987.[2] H. Doleisch, M. Gasser, and H. Hauser. Interactive feature specification for focus context visualization of complex simulation data. In Proc. of the 5th Joint IEEE TCVG- EUROGRAPHICS Symposium on Visualization (VisSym2003), pages 239–248, Grenoble, France, May 2003.[3] H. Doleisch and H. Hauser. Smooth brushing for focus context visualization of simulation data in 3D. In Journal of WSCG, volume 10, pages 147–154, Plzen, 2002.[4] H. Doleisch, M. Mayer, M. Gasser, R. Wanker, andH. Hauser. Case study: Visual analysis of complex, timedependent simulation results of a diesel exhaust system.In Proc. of the 6th Joint IEEE TCVG - EUROGRAPHICSSymposium on Visualization (VisSym 2004), Konstanz, Germany, 2004.[5] Intel Streaming SIMD Extensions. See URL: http://x86.ddj.com/articles/sse pt1/simd1.htm.[6] G. W. Furnas. Generalized fisheye views. In Proc. of theACM CHI ’86 Conf. on Human Factors in Computing Systems, pages 16–23, 1986.[7] E. Gamma, R. Helm, R. Johnson, and J. Vlissides. DesignPatterns: Elements of Reusable Object-Oriented Software.Addison-Wesley, Reading, MA, 1995.[8] E. P. Klement, R. Mesiar, and E. Pap. Triangular Norms,volume 8 of Trends in Logic. Kluwer Academic Publishers,Dordrecht, 2000.[9] R. Kosara, F. Bendix, and H. Hauser. Timehistogramsfor large, time-dependent data. In Proc. of the 6th JointIEEE TCVG - EUROGRAPHICS Symposium on Visualization (VisSym 2004), Konstanz, Germany, 2004.[10] David R. Musser. Introspective sorting and selection algorithms. Software Practice and Experience, 27(8):983–993.[11] F.H. Post, B. Vrolijk, H. Hauser, R.S. Laramee, andH. Doleisch. Feature extraction and visualization of flowfields. In Eurographics State of the Art Reports, pages 69–100, 2002.[12] M. O. Ward. XmdvTool: Integrating multiple methods forvisualizing multivariate data. In Proc. of IEEE Visualization ’94, pages 326–336.[13] The awt native interface.See URL: http://java.sun.com/j2se/1.3/docs/guide/awt/AWT Native Interface.html.[14] Hyper-threading technology architecture and microarchitecture.See URL: ssue01/vol6iss1 hyper threading technology.pdf.[15] The java native interface. See URL: http://java.sun.com/j2se/1.3/docs/guide/jni/.[16] Specification of arb vertex buffer object.See URL:http://oss.sgi.com/projects/ogl-sampl
Fast Focus Context Visualization of Large Scientific Data Martin Gasser VRVis Research Center, Vienna, Austria Abstract Visualization of high-dimensional and time-dependent data, resulting from computational simulation, is a very challenging and resource-consuming task. Here, feature-based visualization approaches, which aim at a user-