Transcription
Computer Networks 54 (2010) 2809–2824Contents lists available at ScienceDirectComputer Networksjournal homepage: www.elsevier.com/locate/comnetManaging networks through context: Graph visualization and explorationQi Liao , Andrew Blaich, Dirk VanBruggen, Aaron StriegelDepartment of Computer Science and Engineering, University of Notre Dame, Notre Dame, IN 46556, United Statesa r t i c l ei n f oArticle history:Available online 10 August 2010Keywords:Enterprise network managementSecurityVisualizationContextGraphsVisual miningInteractive explorationForensicsa b s t r a c tWith the increasing prevalence of multi-user environments in distributed systems, it hasbecome an increasingly challenging task to precisely identify who is doing what on an enterprise network. Current management systems that rely on inference for user identity andapplication are not capable of accurately reporting and managing a large-scale networkdue to the coarseness of the collected data or scaling of the collection mechanism. We propose a system that focuses data collection in the form of local context, i.e. the precise userand application associated with a network connection. Through the use of dynamic correlation and novel graph modeling, we developed a visualization tool called ENAVis (the workappeared in earlier form in [1] and received USENIX best paper award). (Enterprise NetworkActivities Visualization). ENAVis aids a real-world administrator in allowing them to moreefficiently manage and gain insight about the connectivity between hosts, users, applicationsand data access offering significant streamlining of the management process.Ó 2010 Elsevier B.V. All rights reserved.1. IntroductionDistributed systems are inherently complex and hard tomanage due to the large scale of inter-related heterogeneous system components. In addition to hosts, other components such as users, applications and data also play animportant role in the overall picture of network activities.In contrast to traditional point-to-point network flowmonitoring, these user/application components are highlydynamic. The sheer number of network connections inlarge scale enterprise networks form ever evolving interdependency graphs. Tracking down precisely who (users) andwhat (applications) are responsible for the generation ofthis network connectivity is a non-trivial task. The causesfor this problem are due to the specific data not beingavailable to capture the user and application level of network activities and/or the inability to capture the interrelationships of such data that can bridge daily networkmonitoring and high level decision making [2].Understanding one’s own network, such as knowingwhat is going on in the network, is usually the first step to Corresponding author. Tel.: 1 5746318720; fax: 1 5746319260.E-mail address: qliao@nd.edu (Q. Liao).1389-1286/ - see front matter Ó 2010 Elsevier B.V. All rights reserved.doi:10.1016/j.comnet.2010.07.015wards improved network management. Despite the abundant amount of data available from point-to-point logging,the coarseness of the data does not make it particularlyuseful. For example, current logging schemes such as CiscoNetFlow data provide activity details in terms of IP addresses and ports, but are unable to tell which users andwhat applications are running on the managed network.In a multi-user environment with increasing port dynamics of distributed applications, the many-to-many relationships between IPs and users and also between ports andapplications make network addresses and port numberspoor identifiers for network activities [3]. While host ornetwork intrusion detection systems (HIDS/NIDS) are useful as a first step to identify attacks, these alerts normallyneed additional context data for further analysis [4]. Sinceit is the actual applications run by users that are the mostactive components in networks, we argue that the rightcontext of network connections (i.e. which users and whatapplications are responsible, what data they access, etc.) isessential for network monitoring.Context monitoring nevertheless increases the complexity of network dependency graphs due to the dynamicinteractions between users and applications as well as thescale of the data collected. The key challenge becomes how
2810Q. Liao et al. / Computer Networks 54 (2010) 2809–2824the value of context can efficiently help us gain insight andknowledge. With the complexity of the context data,administrators need a tool that allows them to sift throughmassive amounts of traffic logs in a visually appealing andinteractive manner that encourages data explorationrather than hindering it. In the network management domain, however, the gap between the daily network monitoring and the high level of decision making is currentlynot well bridged by any interactive tool [2]. Smart visualanalysis is the key to solving the above problem. A properlydesigned visual representation and human–computerinteraction can expedite data understanding and improvethe exploration process [5,6].To facilitate solving the above problems, we present ENAVis (Enterprise Network Activities Visualization). ENAVis is atool for visualizing the network activities among hosts/domains, users and applications, which is possible throughthe gathering of local context information. ENAVis offers interesting, ready-to-use, and invaluable functions for monitoring, correlating, exploring, visualizing and analyzing theactivities on a network by real-world network administrators. Through the use of a highly detailed local context datacollection system spanning over a wide diversity of machineson our campus since 2007, we have collected terabytes ofcontext information and developed ENAVis to allow anadministrator to explore this informative data set.With ENAVis, the administrator is presented with a wealthof user and application connectivity graphs, statistical chartsand reports on how the network is being used. To assist theinvestigator in understanding the many possible visualization modes, we provide a novel meta-visualization whichcompactly represents and controls how data is represented.Unlike most flow visualizations which are only capable ofplotting the entire static host-only graphs, ENAVis allowsthe user to easily expand, contract, and explore a very richdata space in a visually appealing and highly interactive manner via the Host-User-Application-File (HUAF) interactions.In addition, being able to interactively explore the causalrelationships of the user and system events, i.e. gaining insight on what is occurring, is also important. For example,if an account on a network is compromised then it needs tobe known what hosts that user account attempted to loginto, along with the applications and programs they attempted to run, and files that may have been modified ortouched. Knowing exactly who (users) and what (applications), not inferring from IP and port, at both sides of connections is of particular interest in policy complianceauditing. Being able to present all of this information in asingle visually appealing and manageable view would bea tremendous asset for network administrators. The keyhighlights of this paper include: Data collection: The light-weight, easy-to-deploy monitoring agent collects the local context information(who, what, when, and where) associated with eachnetwork connection in an enterprise network. Graph model: Our novel hierarchical graph representation of context data in terms of domain/hosts, users,applications and files (HUAF) captures the dynamicrelationship and interaction between machines, userapplications and data flows. Visualization and interactive exploration: Rather than static graph visualization, an easy-to-use yet powerfulgraphical interface makes exploration of large amountsof network connectivity interactive and manageableand helps administrators quickly drill down to the rootcause of connectivity and security problems. Visual mining: Clever combination of interactive visualexploration with automatic data mining, machinelearning algorithms and statistical graph theory bridgesday-to-day network monitoring and high level decisionmaking. The significant improvement over our priorwork [1] includes a new, intelligent module for visualmining and graph analysis, streamlining the visualexploration, and the inclusion of files to context information in addition to hosts, users, and applications.Most significantly, the data mining algorithms andgraph theory incorporated in ENAVis facilitate and guidethe manual visualization process to provide moreinsight and detect the root cause of network management problems more efficiently.2. ObjectivesIt is usually a good practice for administrators to logsystem events and network activities [7]. However, thelarge amount of data accumulated each day is difficultfor human beings to understand and explore. Visualizationis therefore an important topic in network managementand system adminstration since visualization can not onlyease the manual process of going through log data and correlating events but can also present the relationships in ameaningful and easy-to-understand way. Therefore, theobjectives of ENAVis are threefold. First, ENAVis should correlate and visualize the events and the local context (hosts,users, applications, data accesses, etc.) of network connections. The tool should also plot various combinations of thefeature/attribute vectors in the log data for a quick overview of the network activities within the enterprise network. Second, the visualization tool provides acustomizable and interactive interface for human auditorsto explore and investigate the activities that occurred ontheir networks. The exploration feature of ENAVis would allow the investigator to easily drill down to the root causeof abnormal or suspicious activities. Most importantly, aunique inter-hosts/users/processes matching capability included in ENAVis provides the administrator with intuitiveinformation on the dependant relationships, which mayhelp many other important problems such as security tracing and fault localization. Third, an intelligent graph datamining module should ideally be built into ENAVis thatcan automate part of the manual examination processand guide the human investigator to look at only thingsof most interest and consequently facilitate his decisionmaking.2.1. Problem statement and solutionThere are two problems that we tackle in this paper.First, there is a lack of tools and data to capture the userand application level of network activities. Second, thereis also a lack of interactive tools to visualize and capture
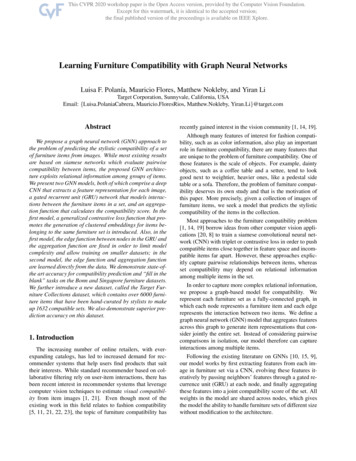
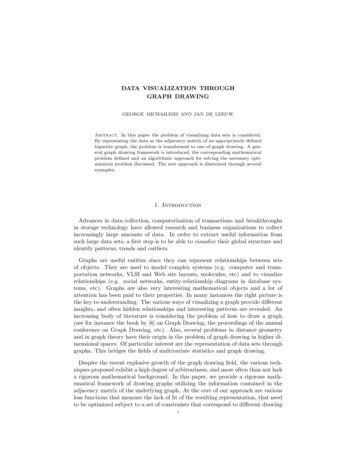
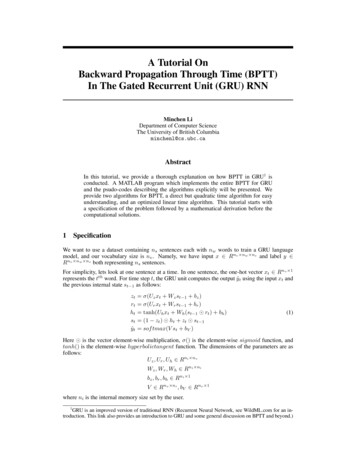
Q. Liao et al. / Computer Networks 54 (2010) 2809–2824the inter-relationships of such data that can bridgedaily network monitoring and high level decision making[2].In addressing the first problem, administrators do notusually lack log data for security measurement [8]. However, administrators are facing a dilemma that on one sidethere is an overwhelming amount of data, but on the otherside much of the data is not at the level of detail administrators would like. Although there are tools to log networkactivities in either packet or flow format, there is no lightweight mechanism in current practice to monitor the network at a finer granularity than host-to-host. For example,the network IP addresses included in the packet headeronly serve as locators for the machines. They tell nothingabout the identities of the end-users. On the other hand,the transport layer’s port numbers are also less meaningfulin determining the actual end-processes [3]. Using deeppacket inspection (DPI) [9] requires an understanding ofall known protocols, but this expensive practice is still oflittle help because which users and applications are sending those data still remains unknown.Motivated by the observation that the end host has fullvisibility of the user’s processes, our approach to the firstproblem is to deploy a simple agent on the end hosts tocollect the missing local context data for each networkconnection. The agent is easy to deploy and lightweightin that it is a bash script that calls commonly available system tools such as netstat and ps and requires absolutelyno changes to the underlying system. Through carefulmapping between each TCP/UDP socket with the user IDand process ID, we associate users and applications witheach network connection. The data is then sent securelyvia scp from each host to a central database server for correlation, analysis and audit.The second problem, independent of the data collection mechanism, is how to understand and interpret thedata. The natural question to ask is how should we correlate and visualize the rich context information associatedwith each network connection in a more intuitive andeasy-to-understand manner? With the amount of workload on a busy system administrator, being able to quicklybrowse through the data, view summary statistics andcharts, and interact with connectivity graphs can be veryhelpful.Visualization is the key to solve the second problem,which is the focus of this paper. It is commonly recognized that many of the human errors are due to the lackof domain knowledge [10]. A properly designed human–computer interaction can expedite data understandingand improve knowledge and insight. Our solution is to develop a powerful yet friendly graphic user interface thatallows the network administrators to view their networkactivities at the user and application levels in additionto the topology created by the host connectivity. The design principles of our system are described in the nextsection.2.2. Design principlesThe target of the system, namely what is to be achievedby this tool, is detailed below:2811 Know who, what, when and where (4 W): Know what ishappening on the network, i.e. who (which users) arerunning what (applications) on where (which hosts) atwhen (what time). Context information relevant to theconnection needs to be recorded. Compute, trace, and visualize heterogeneous graphs: Inorder to visualize the 4W aspects of the data, the toolneeds to transform the raw data into an animated graphtopology view. The graph is considered heterogenousbecause each node in the graph can be either a domain,host, user, application or data. Fig. 1 shows an exampleof such a graph. Investigate interactively: Static graph visualization is lessflexible and desirable in network management. Basedon user events (such as clicking, querying or applyingfiltering rules), the graph is instantly regenerated toreflect the changes. Through only a few mouse operations, the administrator is able to make queries to thedatabase, Domain Name System (DNS), and LightweightDirectory Access Protocol (LDAP) servers for moredetailed information, analogous to ‘‘please tell me moreabout this”. Make it simple, efficient and customizable: The toolshould be simple yet powerful, usable for real-worldadministrators. While most users will not need to modify the base set of views, the ability to customize via amodular viewer is a powerful feature. Ideally, userswould be able to customize their configuration andbuild an environment in which they are most interested(e.g. top 10 applications, current connectivity of humanresource (HR) users, status of grid compute nodes, etc.). Make it intelligent: To delineate with traditional visualization techniques, this visualization tool will not simplytry to ‘‘visualize” the data. It should be intelligent meaning the tool can automatically ‘‘learn” and ‘‘guide” thehuman operator to visually explore only things towhich attention should be paid. We will bring visualization and data mining together into the daily networkmonitoring and management practice. One examplewould be to build decision trees to classify networkevents, or compute and visualize clusters for understanding similar behaviors by users or applicationsand identifying potential problems.Fig. 2 shows how ENAVis brings the above parts together to form a powerful tool for administrators. In summary, the design objective of the framework of ENAVis is toseek clever ways to collect, correlate, visualize, explore andautomatically analyze the dynamic interactions amongimportant network components, i.e. hosts, users, applications and files that can maximize the insight for networkoperators and the management team.3. Network context graphsThis section describes the first two important components of the system, i.e. local context data collection andnovel network graph model. First, we introduce and definethe meaning of local context followed by a description ofwhat type of data we have been collecting and an overview
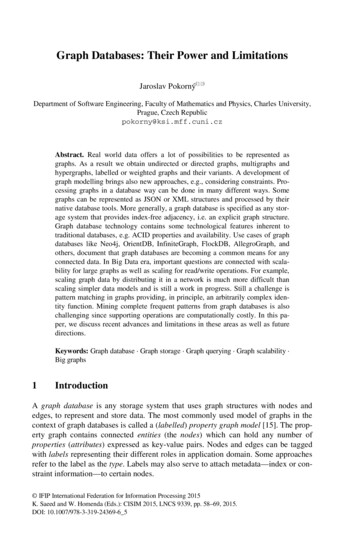
2812Q. Liao et al. / Computer Networks 54 (2010) 2809–2824Fig. 1. A screenshot from ENAVis showing connectivity between hosts, users, and applications.3.1. A hierarchy for gathering local contextFig. 2. Overview of the components of ENAVis that performs visualanalysis on the context data.of the entire system. As discussed earlier in Section 2, thefirst problem we are trying to solve is how to collect themissing context information, i.e. to capture the user andapplication level of network activities (4W). The systemwe propose ties the user and application identities intothe enterprise network management by utilizing existingtools (netstat, ps, lsof), which together build a hierarchical gathering of local context related to networkconnectivity.Second, also in this section, we lay out the theoreticalfoundation for the graph representations of the data wecollected. We make a unique contribution using a heterogenous graph model that involves mappings between hosts,users and applications (HUA). This interesting graph modelcan have applications in the area of enterprise networkmanagement, security, auditing, problem debugging andfault localization.We now briefly describe the three major tools used inour data gathering system, what each supplies, and howthe supplied information can be fused together to providea complete view of the local context associated with eachnetwork connection. The local context is defined as theinformation fully detailing a network connection (protocol,src/dst IP/port), time, user, application, application arguments, and network-related file accesses. While the abovedefinition is the ‘‘standard” version of the local context, thepowerfulness of the idea of local context lies on the easyexpandability. It is very important to note that the localcontext associated with each network connection can beextended to include any additional context information thatis relevant to the network connection depending on thechanging needs of organizations.The data gathering component utilizes commonly available tools in order to take advantage of developmentrobustness and administrator familiarity. The tools shouldaugment the existing data significantly, i.e. not just another method to report IPflows or Simple Network Management Protocol (SNMP) data. A natural fit for these criterionis the netstat tool, in essence the equivalent of whois fornetwork connectivity. In the base tier, netstat is the mostimportant command utilized to capture each instance ofnetwork connectivity occurring on the monitored system.In comparison to the standard rules in the firewall,netstat provides the additional user and process ID associated with the network sockets as well as similar information with regards to the connection tuple (protocol, src/dstIP and src/dst port). netstat can be coupled with other
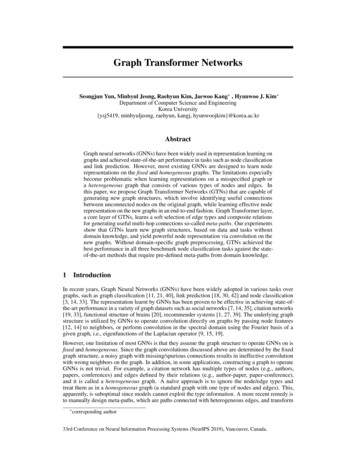
Q. Liao et al. / Computer Networks 54 (2010) 2809–2824tools such as the process table via ps (linking process ID tothe application and arguments). As the second tier command, ps is used to supplement the application information from netstat as well as the process tree. Moreover,the context information can be further correlated withthe open file handles via the tier 3 command (linking theapplication to files). The most important insight offeredby the lsof command is regarding potential informationflow, i.e. what files a connected process is touching. Another interesting aspect of lsof is the discernment of anapplication’s location. From a policy management standpoint, centrally served (e.g. Network/Andrew File System(NFS/AFS) mount) or validated local versions (e.g. MD5,SHA1 hash) can reduce the ambiguity associated withapplications. The notion of classifying according to application location can offer an additional mechanism for extracting characteristics such as versions of applications. In abroad sense, one could view applications as existing inone of three forms, user local (local directory or user path),machine local (root-level install, e.g./usr/bin), and enterprise served (root-level mounted). The concept of the fusion of the data forming the context information for eachnetwork connection conceptually shown in Fig. 3.The data collection agent was implemented as a bashscript that calls Unix commands netstat, ps, lsof, anddiff on the current and previous set of outputs at a customized interval (Tdiff 5 s in our case for a good balanceof granularity and system overhead) and every Tout 15 min pushes out the collected data securely to the centralserver. In addition, when the agent component initializesfor the first time, it collects an array of system-wide information such as OS version, iptables rules, network interfaces and other hardware info. The system has beendeployed throughout our campus with a mix of facultyand student office computers, scientific grid computingnodes, and engineering lab machines since April 2007.The cost of agent deployment is minimal in terms of CPU,file size and bandwidth [1]. It is important to note thatthe lightweight nature of the system comes from the factthat it provides local context with regards to the presence2813of connectivity (network and files), not the content passedin the connectivity itself (data payloads, packet headers,etc.). The benefit of implementing the agent as a script isits immediate deployability without any special changesto the network or hosts. While it is understood that thedata collected in this polling scheme may not be perfectand could miss some transient events such as TCP connection state changes or file system accesses, it is possible thatthe reports from the end hosts can be combined with theNetFlow data for more accuracy in connection time, direction, packet size, etc. Moreover, we note that the full visibility at the end hosts provides a richer context (in termsof users and applications) of network connectivity that isnot readily available from inline monitoring.3.2. Heterogenous graph model (HUA control)With ENAVis, the administrator is presented with a variety of choices for connectivity graphs. While we have a richFig. 4. Meta graph showing state transitions among Hosts, Users, andApplications (HUA) for modeling and constructing network connectivitygraphs. Being able to visualize the various combinations of HUA is one ofcontributions of ENAVis.Fig. 3. A hierarchical structure of local context (users, applications, data, etc.) associated with each IP/port pair from network connections (flows) can bereadily achieved through correlating a set of widely available, robust (and free) system tools.
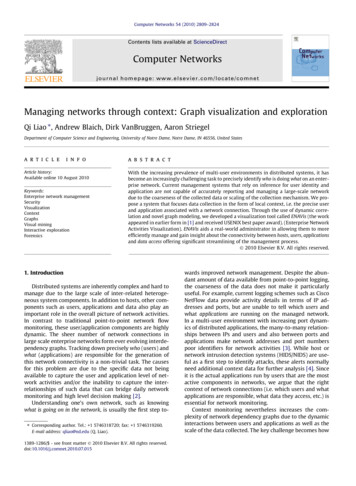
2814Q. Liao et al. / Computer Networks 54 (2010) 2809–2824pool of data containing the entirety of host, user, and application connectivity, it is not always desirable to view allthe data at once. To assist the investigator in understanding the many possible visualization modes, we propose anovel meta-graph visualization, which compactly repre-Fig. 5. Examples involving only two network components (i.e. biparitegraphs): HU, HA and UA.sents and controls how data is represented. By adjustingthe Host-User-Application (HUA) control (Fig. 4), the usermay easily expand, contract, and explore a very rich dataspace in a visually appealing and highly interactive manner. We can imagine a 4D space, where the time, host, userand application interact with each other. The administratormay quickly switch between views and filter out any irrelevant information in a customizable level of granularity. Aconcrete example of the HUA graph model is illustrated inFig. 5.At the top layer in Fig. 4, we have H denoting the hostconnectivity, basically described by traditional IP/portpairs among servers and clients. Using H only is analogousto a connectivity view offered by NetFlow data. At themiddle layer, we have U denoting the user connectivitychaining, in which we can observe the connectivity relationships solely among the users. Because there aremany-to-many relationship between hosts and users,namely multiple users can log onto the same machineand a single user can log onto multiple machines, bytreating an enterprise user (no matter how many physicalhosts they have logged on) as one single entity node, weare able to observe the overall network activities for anyspecific user. At the bottom layer, we have A denotingthe application connectivity, in which we can observethe connectivity relationships solely among applications.A simple example would be which browsers are interact-Fig. 6. Popup implemented to display node properties and to provide detail-on-demand and ‘‘please tell me more” function by querying database.
Q. Liao et al. / Computer Networks 54 (2010) 2809–2824ing on my intranet web server (i.e. Firefox 2.0, InternetExplorer 7, etc.) without worrying about user-agent spoofing. Similarly, what applications (and their versions) arechecking out licenses from my license server? As statedearlier, since an user can log onto multiple hosts and ahost has multiple users simultaneously logged in, a mixmode (HU) of interaction between users and hosts canprovide insights on who is responsible for the traffic. Anedge is added between the user and the host only if thatuser has made at least one connection on that host. Theuser is then connected with another user on another host.Similarly, with HA, hosts and applications can be combined to construct a connectivity graph when users areof less concern. Also, H can be temporarily filtered outand only leave UA if we are more interested in who (users)and what (applications) are running on the network andless concerned about the physical location of hosts. Lastly,with HUA, building hosts, users and applications into onegraph provides the most comprehensive view as we showin later case studies.Beyond HUA, the local context can be extended to include any relevant information associated with each network connection. An interesting consideration is the datafiles accessed by networked applications. Fig. 7 conceptually illustrates an augmented graph containing hosts,users, applications and files (HUAF), in which normal andmalicious users can be visually identified by comparingthe data access patterns on any given host. This is especially useful for those organizations that care most abouttheir data flows and sensitive data access across networkssuch as financial and credit card information, classifieddocuments, etc.With the HUA graph model, the identity of parties atboth ends of network connection can be linked together.The motivation for doing user and application level chaining comes from the question: what are the foreign applications and users behind the other side of the connection? It isof particular interest as the traditional packet analysis isnot of any usefulness in knowing the identity of applications or users. With our system, the identity (user/application) of both sides of the end-to-end connection can belinked together assuming both hosts are monitored. Inits simplest form, a bipartite matching is found if anestablished connection recorded on Host A with srcA anddstB matches another established connection record onHost B with srcB and dstA within the same time frame.The time frame can be from a single hour to several daysdepending on the granularity requirement. Each chainingrecord begins with the start and stop time of each connection and is further divided into the local identity/contextand foreign identity/context in terms of source and destination host names, IP/Port pairs, users, and applicationsassociated with both ends of the connection. WithoutENAVis, the identity of who is connecting to whom is vaguely inferred from the IP/Port pair. With the contextinformation at hand, the identity can now be preciselytracked down through the bipartite matching, i.e. whichuser and what application are revealed at both sides of connection. This is useful in evaluating the effectiveness ofthe enforcement of the existing policy on the enterprisenetwork.2815The ENAVis visualization tool1 was implemented usingJava. The function of graph visualization and exploration ofthe context information is built on top of Prefuse [11], agraph rendering library for Java. Rather than static graphplots, Prefuse provides easy extendibility for highly interactive graph data exploration, queries and visualization. Someof the graph algorithms are from the Java Universal Network/graph framework (JUNG) and JFreeChart is utilized toplot the trend and statistical charts by taking advantage ofactive open-source projects and relative robustness and scalability of those libraries. Various data analysis algorithmsand interactive exploration mechanisms were built in andFig. 6 shows an interactive feature by querying graph nodes.4. Application discussion and case studiesWe discuss several case scenarios in which ENAVis canbe helpful in local network management. The graphicalexploration reduces the tedious, error-prone nature of logchecking and mapping down to a few mouse clicks, whichmakes administrators’ lives much easier. With the capability of central correlating hosts, users and applicationsthrough interacting with HUA graphs and straightforwardstatistical charts offered by ENAVis, the investigation carried out by the system and network adminstration can beconfined to O(1) steps and does not have to hop throughO(n) hosts in scale of a distributed system. The investigation supported by ENAVis is a
Graph model: Our novel hierarchical graph representa-tion of context data in terms of domain/hosts, users, applications and files (HUAF) captures the dynamic relationship and interaction between machines, user applications and data flows. Visualization and interactive exploration: Rather than sta-tic graph visualization, an easy-to-use yet .