Transcription
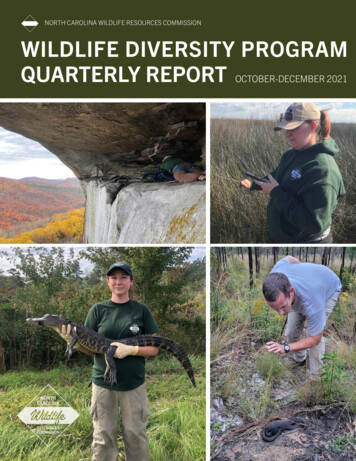
MANAGING FOR WILDLIFE HABITATAND CONNECTIVITY IN THE DUKE FOREST:CASE STUDIES OF BOBCATS AND THREE SALAMANDER SPECIESbyKendra SultzerDr. Nicolette Cagle, AdvisorApril 29, 2021Masters project proposal submitted in partial fulfillment of the requirements forthe Master of Environmental Management degree in The Nicholas School of theEnvironment of Duke University
2EXECUTIVE SUMMARYOverview. Landcover within the Piedmont ecoregion of North Carolina has been greatly impacted byurbanization. Duke Forest is one of the largest remaining forest habitat patches within this mostly urbanlandscape matrix. This project assisted Duke Forest with its comprehensive wildlife management planthrough the synthesis and analysis of past work and provided future recommendations. Specifically, thisproject combined a previous regional wildlife connectivity report, a salamander distribution report, anda new examination of mammal occurrences using species distribution modeling to promote wildlifemonitoring and management of potential wildlife corridors within the Duke Forest. Research questionsincluded: Where should wildlife management be prioritized in the Duke Forest to maximize overlapbetween Duke Forest land, regional connectivity plans, and the distributions of priority species?What are some best practices for how to manage priority hotspots identified in the Duke Forestfor each species?Answering these two questions allows this project to be useful for Duke Forest, but also useful on alarger scale for applying regional connectivity plans on the ground with a single landowner. Inparticular, combining connectivity models and species distribution models to predict important habitatfor fauna is a valuable tool to better assess where animals may be on the ground or where they have thepossibility to be, if managed correctly.Methods. The first step was to determine how to crosswalk a regional wildlife habitat connectivityanalysis with available species distribution models (e.g., Tuttle et al. 2019 and Geschke 2019). To begin,I evaluated the habitats and representative species modeled in the connectivity plan. The connectivityplan used a habitat guild approach in which a suite of indicator species (i.e. a guild) corresponded with aparticular habitat type, and a single focal species from each guild was selected to further refine themodel. Focal species included the bobcat (representing the sparsely settled mixed habitat guild),eastern box turtle (representing the dry-wet hardwood and mixed forests habitat guild), and four-toedsalamander (representing the general wet-mesic hardwood forest habitat guild). I then looked forcorresponding Maxent-based species distribution models from Geschke (2019). A four-toed salamandermodel was available, but there was not one for the bobcat or the box turtle. However, the box turtlerepresents an animal habitat guild that includes marbled and spotted salamanders; species distributionmodels for these species were available from Geschke. Since a Maxent bobcat model was not available,I created one by researching habitat variables and collecting bobcat occurrence points from a variety ofsources.Amphibians are of particular concern since their prevalence is declining worldwide, and Duke Forest iscurrently employing citizen science to help monitor their populations. Bobcats are of salience sincethere have been 2 sightings within the forest recently, but otherwise the species is secretive andpresumed to be rare.The species distribution model results for each indicator species were overlaid with the connectivitypriority areas determined by the regional wildlife connectivity plan to generate maps of “hotspots.”These hotspot locations could then be used by Duke Forest to prioritize and focus habitat managementactivities specific to the habitat types and animals that use them. In addition, a final overlay mapshowing the salamander hotspots for all salamander species was created because these animals are
3most sensitive to changes created by forest management. To provide recommendations for DukeForest, literature was consulted, and Duke Forest’s future management areas were considered.Results & Conclusions. This project resulted in maps of predicted habitat for the bobcat, for both DukeForest and for Durham, Orange, and Chatham counties. Other results included connectivity and speciesoverlay maps for the three guilds and a combined salamander hotspot overlay. This last salamanderhotspot overlay showed where Duke Forest needs to prioritize its sensitivity for management. Therewere 2 main areas of conservation in Duke Forest in the Blackwood and Durham divisions. Pine harvestsare planned adjacent to both hotspots, which is where the management recommendations would bebest utilized.Recommendations included management pertaining to timber harvest, prescribed fire, streamsidemanagement zones, and vernal pools/constructed wetlands. These recommendations are mainlyproviding more specifics for Duke Forest in regard to their current management practices such as timingand associated effects that may not have been considered. With these recommendations, Duke Forestmay be able to develop management protocols that protect land within its forest that will ensurewildlife movement within the Triangle region.For more information, contact kendrasultzer@gmail.com
4Table of ContentsIntroduction . 8Objective . 11Materials & Methods. 121. Study Areas . 121.1. Study Organisms . 152. Bobcat Modeling . 152.1. Literature Review . 152.2. Geospatial Data Collection . 162.3. Bobcat Occurrence Data . 162.4. Maxent Habitat Modeling . 173. Connectivity Overlay . 203.1. Species and Regional Connectivity Overlay . 203.2. Literature Review on Management Action Effects by Representative Species . 203.3. Management Recommendations . 21Results . 211. Bobcat Modeling . 211.1. Literature Review . 211.2. Maxent Habitat Modeling . 232. Connectivity Overlay . 282.1. Species and Regional Connectivity Overlay . 282.2. Literature Review on Management Action Effects by Representative Species . 43Discussion . 451. Bobcat Modeling . 451.1. Literature Review . 451.2. Maxent Habitat Modeling . 452. Connectivity Overlay. 462.1. Species and Regional Connectivity Overlay . 462.2. Literature Review on Management Action Effects by Representative Species . 532.3. Management Recommendations for Duke Forest . 53Conclusion. 56References . 58GIS Data Sources . 63Appendix . 641. Bobcat Habitat Literature Review Table . 652. Bobcat Occurrence Points . 673. Focal Habitat Layers . 684. Correlation Score of Variables . 695. Bobcat Maxent Thresholding . 706. Management Action Effects Literature Review Table . 71
5List of TablesTable 1. Maxent predicted habitat area (in acres) for both study areas . 23Table 2. Maxent predicted habitat area divided by division in Duke Forest . 23Table 3. Maxent predicted four-toed salamander habitat overlap with connectivity areas . 28Table 4. Four-toed salamander hotspots divided by Duke Forest division . 28Table 5. Amount of four-toed salamander hotspot acreage within different SEGAP habitat types. 30Table 6. Amount of four-toed salamander hotspot acreage within 10 highest Duke Forest (DF) covertypes. 31Table 7. Maxent predicted marbled or spotted salamander habitat overlap with connectivity areas . 32Table 8. Marbled or spotted salamander hotspots divided by Duke Forest division . 32Table 9. Amount of marbled or spotted salamander hotspot acreage within different SEGAP habitattypes. 34Table 10. Amount of marbled or spotted salamander hotspot acreage within 10 highest Duke Forest (DF)cover types . 35Table 11. Maxent predicted bobcat habitat overlap with connectivity areas . 36Table 12. Bobcat hotspots by Duke Forest division . 36Table 13. Amount of bobcat hotspot acreage within different SEGAP habitat types . 38Table 14. Amount of bobcat hotspot acreage within 10 highest Duke Forest (DF) cover types . 39Table 15. Salamander hotspots by Duke Forest Division . 40Table 16. Amount of salamander hotspot acreage within different SEGAP habitat types . 42Table 17. Amount of salamander hotspot acreage within 10 highest Duke Forest (DF) cover types . 43Table 18. Recommendations for Duke Forest to provide for wildlife connectivity within theirmanagement types . 57Appendix 1, Table 1.1. Literature review of relevant habitat variables for the bobcat . 65Appendix 2, Table 2.1. Bobcat occurrence points used in analysis . 67Appendix 3, Table 3.1. Development of focal habitat layers from the SEGAP land cover layer . 68Appendix 4, Table 4.1. Correlation scores between variables for bobcat habitat model . 69Appendix 5, Table 5.1. Confusion matrix used to determine the bobcat Maxent model threshold . 70Appendix 6, Table 6.1. Effects of management actions (timber harvest, prescribed burning, streamsidemanagement zones (SMZs), constructed wetlands, and food plots) on bobcats, four-toedsalamanders, marbled, or spotted salamanders . 71
6List of FiguresFigure 1. Map of 3-counties study area (top) and Duke Forest study area (bottom) . 14Figure 2. Predicted likelihood of bobcat habitat within 3 counties from a Maxent model . 24Figure 3. Predicted likelihood of bobcat habitat within Duke Forest from a Maxent model . 25Figure 4. Predicted bobcat habitat within 3 counties from a Maxent model . 26Figure 5. Predicted bobcat habitat within Duke Forest from a Maxent model . 27Figure 6. Four-toed salamander hotspots within Duke Forest determined from Maxent model andregional connectivity analysis. 29Figure 7. Marbled or spotted salamander hotspots within Duke Forest determined from Maxent modeland regional connectivity analysis . 33Figure 8. Bobcat hotspots within Duke Forest determined from Maxent model and regional connectivityanalysis . 37Figure 9. Salamander hotspot overlay within Duke Forest determined from Maxent model and regionalconnectivity analysis . 41Figure 10. Priority areas for Duke Forest management consideration for habitat and connectivity . 47Figure 11. Salamander hotspot overlay with Registered Natural Heritage Areas . 48Figure 12. Salamander hotspots overlay with pine core areas representing future pine timber harvest(colored by 10-year segments) . 49Figure 13. Bobcat hotpots with Registered Natural Heritage Areas . 51Figure 14. Bobcat hotspot with pine core areas representing future pine timber harvest (colored by 10year segments) . 52Appendix 5, Figure 5.1. Frequency distribution of habitat probabilities predicted by bobcat Maxentmodel . 70Appendix 5, Figure 5.2. Frequency distribution of nonhabitat probabilities predicted by bobcat Maxentmodel . 70
7AcknowledgmentsI’m grateful to so many people for help in this project. First, I’d like to thank my advisor, Dr. Nicki Cagle,for her professional and personal support over the last two years. Her joy and patience have beengreatly appreciated, and I’m very glad she was able to guide me! I would also like to thank Sara DiBaccoChilds, Duke Forest Director, for her willingness to take me on as an assistant and spend time chattingwith me about the Forest. Julie Tuttle was another individual who this project would not have beenpossible without; data from her and the rest of the Eno- New Hope Landscape Conservation Group wasindispensable to providing a place to start with connectivity in the area. Julie also spent extra time withme discussing the semantics of the dataset. In addition, the salamander Maxent models were providedby Julia Geschke: none of the overlays with the connectivity data would have been possible without her!The Maxent modeling was fueled by other bobcat occurrences from eMammal, the Triangle LandConservancy (specifically Bo Howes), and the Duke Forest staff. Dr. Dean Urban, lastly, helped withrefining my Maxent model and with its thresholding, so thank you to him for sharing his landscapeecology wisdom with me.
8INTRODUCTIONWildlife conservation in increasingly fragmented urbanized areas is becoming a necessary considerationtoday. Due to rising human population and the resulting development, contiguous wildlife habitat hasbecome divided or “fragmented” into smaller patches on the landscape (Hilty et al. 2019). The isolationof these patches makes it difficult for animals to move among them for food, water, and reproduction(Cosgrove et al. 2018); furthermore, looming climate change exacerbates isolation effects since smallerareas are less resilient to ecological disturbances and threats (Ament et al. 2014).However, linking these isolated patches with wildlife corridors allows for movement of animals dailywithin their home range, for migration, and for future necessary movement due to climate change ornatural disasters (Ament et al. 2014). Besides being necessary for wildlife, conserving habitat withinhuman landscapes can also provide ecosystem services and financial gain for companies. For example,conversion of medians and roadsides from grass to wildflowers will save transportation departmentsmoney, reduce their carbon emissions from maintenance, and help support pollinator populations(Conniff 2018). Natural habitats may provide an ecosystem service like clean water, and it is cheaper tobuy this land and protect it than have to treat the water after it is polluted from human land usage(Conniff 2018).An ideal study area for wildlife conservation within an urban-forest matrix is Duke Forest in Durham, NC.This master’s project delves into wildlife connectivity on the Duke Forest and beyond. Protectinghabitat corridors for movement through its land will enable Duke Forest to prioritize wildlifeconnectivity and management. Duke Forest is suspected to be a hotspot of regional connectivitybecause it has several large patches of natural and managed habitat totaling just over 7,000 acres(Office of the Duke Forest 2020). Connection among Duke Forest patches and other patches is vital toensure wildlife proliferation. In addition, Duke Forest has over 1,200 acres over 12 sites that areincluded in the North Carolina Registry of Natural Heritage Areas, maintained by the NC NaturalHeritage Program (NCNHP). The agreement between the registry and Duke states that the Forest should“maintain these areas for the perpetuation of natural processes, natural communities, and rare speciespopulations” (Office of the Duke Forest 2020). Timber harvesting is not permitted in these sites unlessharvesting is shown to have great benefit to the ecological community, and the NCNHP is consulted.Moreover, Duke Forest has prioritized wildlife management within its overall management plan, withthe goal of providing habitat for as diverse an amount of native Piedmont species as is possible (Office of
9the Duke Forest 2020). However, this goal is situated within Duke Forest’s teaching and researchmissions and must be compatible with silvicultural prescriptions promoting these missions (Office of theDuke Forest 2020). Management on the Duke Forest is certified to Forest Stewardship Council (FSC)guidelines which consider environmental, social, and economic standards (Office of the Duke Forest2021).Duke Forest’s current wildlife management plan is targeted at landscape and stand levels becausespecies lists and population estimates are not available for the forest overall (Office of the Duke Forest2020). Work is currently under development to incorporate the results of a 2017 Master’s Projectevaluating alternative management approaches for Duke Forest (Office of the Duke Forest 2020). Primetenets include doing no harm or minimizing negative impacts to wildlife from timber harvest andrecreation use. The forest uses work from citizen science, master’s projects, and class projects to betterunderstand wildlife diversity and movement and establish baseline wildlife information. Inherent to thisproject is the Forest’s desire to use management interventions to promote particular species, taxa, orguilds of importance.Timber management may have great implications on wildlife habitat or connectivity, and specificguidelines pertaining to harvesting include harvesting irregularly shaped areas, leaving oak mast species,retaining snags for cavity nesters, and retaining coarse woody debris such as slash piles as cover. Half ofthe regeneration on the forest stems from clearcutting and then planting, which is needed for researchand teaching. However, clear cut areas are limited to 40 acres unless necessary for research. Prescribedfire is implemented on a 3-4 year interval as a silvicultural research and teaching tool. Duke Forestbuffers ephemeral streams by 50 feet as a riparian management zone (RMZ) while for perennial andintermittent streams and surrounding wetlands, 100 feet (50 feet wider than the BMP streamsidemanagement zone) is employed. Harvesting may still occur within these zones, but the Forest is sure toclosely examine management within these areas (Office of the Duke Forest 2020).Past Master’s Projects have worked on directing the course of wildlife management within the DukeForest. A 2017 Master’s Project helped focus wildlife management efforts onto citizen scienceherpetofauna efforts due to the limited staff and funding of Duke Forest and high prioritization of thesespecies (Kramer et al. 2017). In this way, wildlife monitoring can involve the research and teaching goalsof the Duke Forest while establishing baseline data to determine how management affects species andto show trends in species populations over time.
10This project will build upon Kramer et al.’s (2017) wildlife management approach objective of usingresearch outputs to focus management efforts to promote a particular species, taxa, or guild (Office ofthe Duke Forest 2020). Other past Master’s Projects including those of Geschke (2019), have provideduseful habitat distribution information, which is incorporated into the current project. In this, I identifyareas to manage based on the species and the value of their habitat connectivity to regional landscapesbeyond the Duke Forest.Duke Forest is located within the larger subset of the Eno River and New Hope Creek-Jordan Lakewatersheds, where there are over 65 Natural Heritage Natural Areas (Tuttle et al. 2019). A recentregional wildlife connectivity plan, A Landscape Plan for Wildlife Habitat Connectivity in the Eno Riverand New Hope Creek Watersheds, North Carolina, used habitat guilds to map habitat connectivity withinthese watersheds to determine habitat-corridor networks that have high connectivity value and shouldbe conserved (Tuttle et al. 2019).Choosing focal or indicator species to monitor habitat is often done in connectivity work (Hilty et al.2019). Focal species are those that warrant special protection. These may consist of ecologicalindicators (species that share habitat requirements), keystone species (species which have adisproportionate impact on the landscape), umbrella species (species that require large areas), flagshipspecies (species that are popular or will retain public interest), and vulnerable species (threatened orrare species) (Noss 1990). Indicator species for the regional wildlife connectivity plan had similar habitatand movement needs and responded similarly to landscape fragmentation; to select these indicatorspecies, habitat and movement characteristics, barriers to movement, sensitivity to development andfragmentation, and primary stressors were all incorporated (Tuttle et al. 2019). In addition, in theregional analysis, focal species were selected for further model refinement from each of the three mainguilds.This project incorporated four species from all three habitat guilds, with two of those species being focalspecies. I used modeled species habitats of three salamander species and one mammal species andoverlaid these with the connectivity priorities from the Eno-New Hope Plan to provide Duke Forest areasto monitor and manage that will be beneficial to creating corridors for wildlife to move or migrate.While there are many ways to model species distributions, I used maximum entropy models using theprogram Maxent to model bobcat, Lynx rufus, species distributions.
11The Maxent statistical modelling program requires presence-only species occurrence points as well asenvironmental layers to determine the difference between habitat and non-habitat. While Maxent hasbeen promoted as a “presence only” model, it actually fits the difference between the speciesdistribution (presences) and a large random sample of “background” points (pseudo-absences). Maxentis easy to use and is particularly useful, when compared to other modeling strategies, if there is a smallamount of occurrence data (Elith et al., 2006). Bobcats are useful to examine here, particularly whenconsidering fire and timber harvest effects at a larger scale since bobcats are one of the top predators inthe region; indicators by bobcats may show responses at multiple trophic levels (McNitt et al. 2020). Thebobcat overlay in addition will be useful for Duke Forest to prioritize where to focus its camera trapdeployment to verify mammal presence and the potential for management effort.The other three species distributions came from Julia Geschke’s 2019 master’s project, ModelingSalamander Habitat and Connectivity in Durham and Orange Counties, North Carolina. I used thespecies distributions from three species mapped in this project: marbled salamanders (Ambystomaopacum), spotted salamanders (Ambystoma maculatum), and four-toed salamanders (Hemidactyliumscutatum). Amphibians, in general, are useful for examination because they have a variety of life cycles,limited dispersal capability, and specific habitat requirements: thus, they are good bioindicators(Semlitsch et al. 2009). Four-toed salamanders are a species of special concern in North Carolina, andDuke Forest might consider adding small impoundments or transplanting individuals to new sites so thespecies can proliferate (Office of the Duke Forest 2020).This project will help inform and support both the Duke Forest wildlife management plan andconnectivity plan through the synthesis and analysis of past work, integration of original work, andsuggestions of recommendations for the future. Considering overlay between these four speciesdistributions and the connectivity project, I will be able to propose recommendations for areas for DukeForest to manage to achieve connectivity and wildlife goals.ObjectiveWith this project, I aim to determine where wildlife management should be prioritized on the DukeForest to maximize overlap between Duke Forest land, regional connectivity plans, and the distributionsof priority species. Within this overall framework, I address the question of where wildlife managementshould be prioritized in the Duke Forest to maximize overlap between Duke Forest land, regionalconnectivity plans, and four species: bobcats, four-toed salamanders, spotted salamanders, and marbled
12salamanders. To accomplish this, I create a bobcat distribution model for Durham, Orange and Chathamcounties at large. I then overlay this and three other salamander distribution models onto the regionalconnectivity data to determine hotspots or priority management areas.A secondary aim of this project is to conduct a literature review to determine best practices for how tomanage priority areas identified in the Duke Forest for each species. By fulfilling these objectives, I canprovide the Duke Forest with the tools it needs for species-specific wildlife management in the contextof regional habitat connectivity planning.MATERIALS & METHODSOverviewFor this project, I first had to determine how to crosswalk the regional connectivity analysis withavailable species distribution models. I used species from a previous salamander distribution report torepresent two out of the three habitat guilds, and then I created a bobcat model for the third habitatguild. I used Maxent to create a bobcat distribution model for Duke Forest from a larger model
AND CONNECTIVITY IN THE DUKE FOREST: CASE STUDIES OF BOBCATS AND THREE SALAMANDER SPECIES by Kendra Sultzer Dr. Nicolette Cagle, Advisor April 29, 2021 Masters project proposal submitted in partial fulfillment of the requirements for the Master of Environmental Management degree in The Nicholas School of the Environment of Duke University

