Transcription
1Combining Mouse and Keystroke Dynamics Biometrics for RiskBased Authentication in Web EnvironmentsIssa Traore, Member IEEE, Isaac Woungang, Member IEEE, Mohammad S. Obaidat, Fellow of IEEE,Youssef Nakkabi, and Iris LaiAbstract—Existing risk-based authentication systems rely onbasic web communication information such as the source IPaddress or the velocity of transactions performed by a specificaccount, or originating from a certain IP address. Suchinformation can easily be spoofed, and as such, put in questionthe robustness and reliability of the proposed systems. In thispaper, we propose a new online risk-based authentication systemthat provides more robust user identity information bycombining mouse dynamics and keystroke dynamics biometricsin a multimodal framework. Experimental evaluation of ourproposed model with 24 participants yields an Equal Error Rateof 8.21%, which is promising considering that we are dealingwith free text and free mouse movements, and the fact that manyweb sessions tend to be very short.Index Terms—Risk-based authentication, network security,mouse dynamics, keystroke dynamics, biometric technology,Bayesian network model.I.INTRODUCTIONRisk-based authentication consists of using both contextualinformation (e.g. computer mapping, IP address, IP geolocation) and historical information (e.g. user’s transactionpatterns), along with data provided during Internetcommunications to determine the probability of whether or nota user interaction is genuine [1-4]. However, much of thehistorical and contextual data used in existing risk-basedauthentication systems may be subject to fraud [2]. Forinstance, a criminal could poll a user's computer and thenreplicate the settings on a different machine with the intentionof fooling the authentication system.Furthermore, existing systems use ad hoc or simplistic riskmanagement models along with rule-based techniques for userbehavioral and transactional patterns analysis. These systemsare operationally ineffective due to the rapidly evolving natureof online fraud patterns as well as the fact that new and unseenfraud cases are emerging frequently. Such cases cannot becompletely covered by static rules from a rule based system.In this work, we propose a new risk-based authenticationsystem that uses a combination of mouse dynamics biometricsand keystroke dynamics biometrics data captured in onlinesessions.A key characteristic of risk-based authentication is that theprocess must be virtually invisible to end users. This meansthat in our model, mouse and keystroke dynamics must becaptured and processed freely.Although keystroke dynamics biometric has been studiedextensively and used for authentication since the early 1980’s,most of the existing proposals have focused primarily on fixedtext recognition [5-6]. Fixed text recognition consists ofenrolling the user using a predefined text or phrase, andperforming the detection by asking the user to type exactly thesame string. While fixed text recognition may be used in staticauthentication (i.e. login), it is not appropriate in risk-basedauthentication, where the user must be authenticated in a nonintrusive way. Under such scenario, the user must beauthenticated based on text freely typed, which does notnecessarily match the enrolment sample. This is referred to asfree text detection [7]. Free text detection in webenvironments is very challenging because of the limitedamount of keystrokes involved in many web sessions (e.g.online banking). Similar challenges are involved in free mousedynamics biometric analysis [8-9].In this work, we tackle the above challenges by developingan online risk-based authentication scheme that integratesmouse dynamics and free text analysis using a Bayesiannetwork model. Due to the limited amount of mouse actions orkeystrokes involved in a typical web session, relatively lowerperformance is achieved when using each of the individualmodalities in isolation in our Bayesian network model.However, by combining the two modalities, the overallperformance is improved significantly. The performance ofthe proposed scheme is computed by measuring the FalseAcceptance Rate (FAR), the False Rejection Rate (FRR), andthe Equal Error Rate (where FAR FRR).The experimental evaluation of the proposed multimodalframework with 24 participants yields an EER of 8.21%.The rest of the paper is organized as follows. Section 2provides a summary of the related work. Section 3 introducesour proposed approach and model. Section 4 describes theexperimental evaluation of our approach. Section 5 makessome concluding remarks.II. RELATED WORKA. On Risk-based AuthenticationTo our knowledge, most of the published proposals in theresearch literature on risk-based authentication have been atthe transactional level [1, 10].In this context, Dimmock et al. [10] introduced acomputational risk assessment technique for dynamic andflexible access decision-making. The proposed approachallows basing access control decisions on risk and trust ratherthan on credentials only. However, the approach assumes aprior knowledge of outcomes of all possible combinations ofstates and actions during the decision-making process, whichis not realistic. Furthermore, the subjects in their model areautonomous agents, not humans; and we know that human
2identity and behavior are essential aspects of risk-basedauthentication.Diep et al. [1] presented a framework for contextual riskbased access control for ubiquitous computing environments.In their scheme, access control decisions are made byassessing the risk based on the contextual information, thevalue of requested resources or services, and the consequencesof unauthorized system transactions. A mathematical riskassessment and scoring technique called MultifactorEvaluation Process (MFEP) is proposed, in which numericalweights are assigned to risks factors in terms ofconfidentiality, integrity, and availability of the relatedoutcomes.Cheng et al. [11] proposed a new risk based access controlmodel named Quantified Risk Adaptive Access Control(QRAAC)) that uses a quantitative risk assessment techniquebased on fuzzy logic. QRAAC replaces the traditional binarydecision-making used in access control scheme with adynamic, multi–decision access control based on objectiverisk measures. The scale of the quantified risk estimates isdivided into several risk ranges, each associated with aspecific decision and action assigned according to the risktolerances.B. On Keystroke DynamicsMost existing literature on keystroke dynamics focused onfixed text detection [7, 13]. Limited amount of works has beenaccomplished on free text detection. Representative ones arecaptured in [7, 14, 17].Monrose and Rubin [17] proposed an approach for free textanalysis of keystrokes using clustering based on a variation ofthe maximin-distance algorithm. By collecting over a period of7 weeks the typing samples from 42 users performingstructured and unstructured tasks in various computingenvironments, 90% correct classification was obtained forfixed text detection while only 23% correct classification wasachieved for free text detection.Dowland et al. [14] collected keystroke dynamics samplesby monitoring the users during their regular computingactivities without any particular constraints imposed on them[15]. A user profile was determined by calculating the meanand standard deviation of the digraph latency and byconsidering only the digraphs that occur a minimum numberof times across the collected typing samples. An experimentalevaluation of their scheme with five participants yieldedcorrect acceptance rates in the range of 60%.Gunetti and Picardi [7] introduced and used a metric basedon the degree of disorder of an array for free text analysis ofkeystrokes. An experimental evaluation of their schemeinvolved 40 users considered as legal users who provided 15typing samples each, and 165 users considered as imposterswho provided one sample each, by entering their loginidentifier and then freely typing some text through a webbased interface. Overall, a FAR of 0.00489%, a FRR of4.8333%, and an EER in the range 0.5-1% were achieved. Itmust be noted that although the performance obtained in thiscase is excellent, the average length of the samples variedfrom 700 to 900 characters. Determining what theperformance of the proposed scheme would be with sessionsize as small as 100 characters (which is typical in webenvironments) is still an open problem.C. On Mouse DynamicsThe last decade has witnessed an increasing interest inmouse dynamics biometric research [18-20]. Next, we discusssome of these proposals.The Mouse-lock system proposed by Revett et al. [18] usesmouse dynamics biometric for static authentication (at thelogin time). The user interface consists of thumbnail imagesoriented in a circle. By using the mouse, the user enters apassword by clicking 5 of the displayed images in the correctsequence similar to the rotary lock. An experimentalevaluation of the proposed scheme involving 6 users providing100 genuine samples each and 20 impostor samples yieldedFAR and FRR between 2% to 5%.Bours and Fullu [19] proposed a login system using mousedynamics based on a specially designed graphical interface inthe form of a maze. To log in, users have to move the cursorby following the paths. An experimental evaluation of theproposed approach involving 28 participants achieved an EERranging between 26.8% and 29%.Ahmed and Traore [20] proposed a mouse dynamicsbiometric recognition approach in which 39 mouse dynamicsfeatures were extracted and analyzed using neural networks.The proposed approach was evaluated by conducting variousexperiments involving both free and fixed mouse movements.An overall FAR of 2.4649% and FRR of 2.4614% wereobtained in the main experiment with 22 participants, in whichtests were conducted on various hardware and softwaresystems. Seven test users participated in a second experimentproviding 49 sessions. In this experiment, the same hardwareand software applications were used. The test results consistedof FAR and FRR of 1.25% and 6.25%, respectively. A thirdexperiment was limited to the same machine and while theprevious 7 participants were asked to use the same applicationand perform the same predefined set of actions. FAR and FRRof 2.245% and 0.898%, respectively, were obtained in thisexperiment.Like keystroke dynamics, most of the existing works onmouse dynamics target predefined or fixed mouse movement.Under this category fall the MouseLock system introduced byRevett et al. [18], and the maze-based login scheme by Boursand Fullu [19] as outlined above. In the few works where freemouse movements were studied, like in [20], the mainchallenge has been the degradation of the accuracy as thesession length decreases. Such challenge must be addressed inonline environments where small sessions are common.III. APPROACH AND MODELA. Approach OverviewAs mentioned above, we consider in our work two differentbiometric modalities, namely, mouse and keystroke dynamics.We extract a separate model of the user behavior for each ofthe individual biometric modalities using a Bayesian network[21]. The global user profile is obtained by fusing the outcomeof the individual Bayesian networks using the Bayesian fusionscheme explained in the next section.
3To enroll a user, we extract for each separate modality aspecific Bayesian network model from the enrollment sample.The extracted Bayesian network structure is stored as part ofthe user profile. Hence, each user will have different Bayesiannetwork structures for each of the two modalities.To authenticate a user, we apply the monitored sample tothe Bayesian network structures corresponding to the profilefor the claimed identity and compute the individual biometricscores. The individual scores are then fused giving the globalmatching score, which is compared to a threshold for decisionmaking purpose.B. Bayesian FusionLet n denote the number of different modalities involved inour multimodal framework, and let 𝑠𝑠𝑖𝑖 denote the matchingscore between a monitored sample and an individual profilefor modality 𝑖𝑖 (1 𝑖𝑖 𝑛𝑛). We estimate the a posterioriprobabilities using Bayes rule as follows:𝑃𝑃(𝑠𝑠1 , , 𝑠𝑠𝑛𝑛 𝐺𝐺)𝑃𝑃(𝐺𝐺)𝑃𝑃(𝐺𝐺 𝑠𝑠1 , 𝑠𝑠𝑛𝑛 ) 𝑃𝑃(𝑠𝑠1 , , 𝑠𝑠𝑛𝑛 𝐺𝐺)𝑃𝑃(𝐺𝐺) 𝑃𝑃(𝑠𝑠1 , , 𝑠𝑠𝑛𝑛 𝐼𝐼)𝑃𝑃(𝐼𝐼)where P(I) and P(G) are the prior probabilities of the impostorand genuine classes, respectively; and 𝑃𝑃(𝑠𝑠1 , , 𝑠𝑠𝑛𝑛 𝐼𝐼) and𝑃𝑃(𝑠𝑠1 , , 𝑠𝑠𝑛𝑛 𝐺𝐺) are the conditional probabilities of theimpostor and genuine classes given score 𝑠𝑠𝑖𝑖 (1 𝑖𝑖 𝑛𝑛).Assuming a conditional independence between the matchingscores for the different modalities, given G or I, we obtain thefollowing:𝑃𝑃(𝐺𝐺) 𝑛𝑛𝑖𝑖 1 𝑃𝑃(𝑠𝑠𝑖𝑖 𝐺𝐺)𝑃𝑃(𝐺𝐺 𝑠𝑠1 , 𝑠𝑠𝑛𝑛 ) 𝑃𝑃(𝐺𝐺) 𝑛𝑛𝑖𝑖 1 𝑃𝑃(𝑠𝑠𝑖𝑖 𝐺𝐺) 𝑃𝑃(𝐼𝐼) 𝑛𝑛𝑖𝑖 1 𝑃𝑃(𝑠𝑠𝑖𝑖 𝐼𝐼)Often, the prior probabilities of individual modalities P(x)are unknown. It is customary in this case to assume that allconcepts are equally likely, which gives the following: 𝑛𝑛𝑖𝑖 1 𝑃𝑃(𝑠𝑠𝑖𝑖 𝐺𝐺)𝑃𝑃(𝐺𝐺 𝑠𝑠1 , , 𝑠𝑠𝑛𝑛 ) 𝑛𝑛 𝑖𝑖 1 𝑃𝑃(𝑠𝑠𝑖𝑖 𝐺𝐺) 𝑛𝑛𝑖𝑖 1 𝑃𝑃(𝑠𝑠𝑖𝑖 𝐼𝐼)This can also be expressed as:𝑃𝑃(𝐺𝐺 𝑠𝑠1 , 𝑠𝑠𝑛𝑛 ) 𝑛𝑛𝑖𝑖 1 𝑃𝑃(𝑠𝑠𝑖𝑖 𝐺𝐺) 𝑛𝑛𝑖𝑖 1 𝑃𝑃(𝑠𝑠𝑖𝑖 𝐺𝐺) 𝑛𝑛𝑖𝑖 1(1 𝑃𝑃(𝑠𝑠𝑖𝑖 𝐺𝐺))The above represents the Bayesian fusion score for 𝑛𝑛 differentmodalities.C. Keystroke Dynamics ModelKeystroke dynamics biometric analysis consists ofextracting unique behavioral patterns from how a user typeson a keyboard. Two main types of information are usuallyextracted from the keystrokes, namely, the dwell time and theflight time. The dwell time (also called the hold time) is thetime between pressing a key and releasing it. The flight time(also called inter-key time) is the time between pressing twoconsecutive keys. The dwell and flight times can be used tocompute the times associated with monograph (i.e. dwelltime), digraph (i.e. flight time) or n-gram (in general).In this work, keystrokes are divided into four categoriesbased on the character ASCII codes and the mechanicalkeyboard layout 1: Upper Case Keystrokes, Lower CaseKeystrokes, Control Keystrokes, and Other Keystrokes.Keystrokes print characters such as “%”, “&” and capitalizedletters are categorized as Upper Case Keystrokes. The reasonis that users must either press Caps lock key ahead or pressShift key at the same time to print these characters. All UpperCase Keystroke characters are listed in Table 1.TABLE 1: UPPER CASE KEYSTROKE CHARACTERSABCDEFGHIJKLMNOPQRSTUVWXYZ!“# %&()* : ?@ {} Lower Case Keystrokes allow printing lower case letters onthe computer screen; characters from “a” to “z” fall under thiscategory. Control Keystrokes do not result in printingcharacters. Examples of Control Keystrokes are tab key, backspace key, and delete keys. The remaining keystrokes aregrouped into the Other Keystrokes category. For each categoryof keystrokes, we calculate the mean and standard deviation ofthe dwell times as well as the distribution of each type ofkeystrokes within a sequence of keystrokes. The extractedkeystroke dynamics features are listed in Table 2.We extract the keystroke dynamics features by processingbatches of consecutive keystrokes. By default, we considerbatches of size n 10. From each batch, we extract a featurevector consisting of 20 features organized under 11 keystrokedynamics factors listed in Table 2. Each factor is representedby one or several features.Hence, each factor can be considered as a separate featurevector. The concatenation of these individual feature vectorsyields our global feature space for keystroke dynamics. Everysession consists of a number of keystroke dynamics featurevectors or records. Every record corresponds to a sequence ofn 10 consecutive keystrokes.For the mean and standard deviation of the flight timefeature vectors M FT and SD FT mentioned in Table 2, weonly consider the down – down (DD) flight times and therelease – down (RD) flight times. Each of these categoriesyields a separate feature.For the percentage of occurrences per keystroke category(i.e. PER TP feature vector), we consider all four categories.When a user is typing a capitalized letter, he/she might beholding the Shift key and the letter key at the same time. Forthis type of behaviour where the user is holding multiple keys,we calculate the percentage of occurrences within a sequenceof keystrokes. This is represented as the PER MUL feature inTable 2.We compute the means for two different types offlight times based on the mechanical keyboard layout and theuser behaviour in typing consecutive keys. The first type offlight time is the flight time corresponding to when bothconsecutive keys belong to the Upper Case Keystrokescategory, or neither of the consecutive keys is from the UpperCase Keystrokes category.1In this work, we consider the most popular keyboard layout, which is theUnited States keyboard layout for Windows, Mac OS, and Linux.
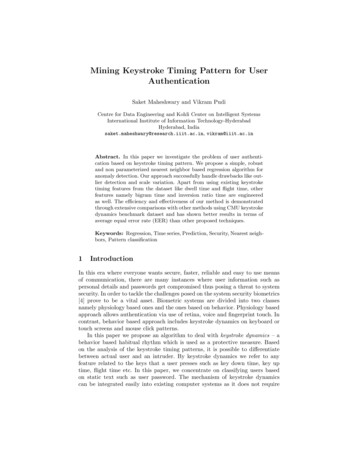
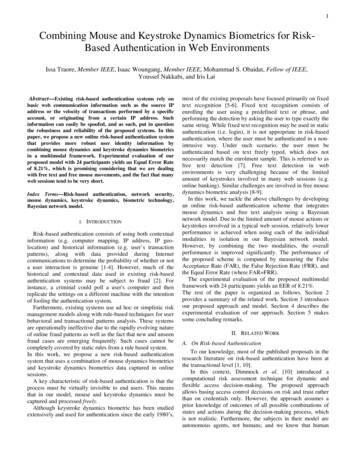
4TABLE 2: KEYSTROKE DYNAMICS BIOMETRICS FEATURESAcronymUnitNumberofFeaturesDescriptionMean of dwelltimeM DTSecond1The meandwell time ofa sequence ofkeystrokes.Mean of flighttimeM FTSecond2The meanflight time ofa sequence ofkeystrokes.M TRITSecond1The meantrigraph timeof a sequenceof keystrokes.1The standarddeviation ofdwell time ofa sequence ofkeystrokes.2The standarddeviation offlight time ofa sequence ofkeystrokes.1The standarddeviation oftrigraph timeof a sequenceof keystrokes.4The mean ofdwell time foreachkeystrokecategory in asequence ofkeystrokes.4Thedistributionof eachkeystrokecategory in asequence ofkeystrokes.1Thepercentage ofoccurrencesof holdingmultiple keysin a sequenceof keystrokes.FactorMean of trigraphTimeStandarddeviation ofdwell timeStandarddeviation offlight timeStandarddeviation oftrigraph timeMean of dwelltime per categoryPercentage ofoccurrences percategoryPercentage ofoccurrences ofholding multiplekeysAverage TypingSpeedMean of flighttimes per type ofuser behaviourSD DTSD FTSD TRITM DTTPPER TPPER MULATSM FTTPSecondSecondSecondSecond%%Character/ SecondSecond1The averagetyping speedof a sequenceof keystrokes.2The mean offlight time foreach type ofuserkeystrokebehaviour.The second type of flight time is when only one key out oftwo belongs to the Upper Case Keystrokes category (i.e. whilethe other keystroke does not). These two types of means arerepresented as the M FTTP feature vector in Table 2.D. Mouse DynamicsMouse dynamics biometric analysis consists of extractingunique behavioural characteristics for a user based on hismouse actions, which consist of mouse movements and mouseclicks.Figure 1. Mouse movement directions.The raw mouse data consist of mouse movementcoordinate, movement angle, the time to move the mouse fromone location to the other, and the time of mouse clicks. Asproposed in [20], the mouse movement directions can bedivided into eight areas of 45 each as shown in Figure 1.Mouse features are extracted from batches of consecutivemouse actions. By default, we consider batches of size n 30.We extract 66 features from the raw data organized under the10 factors listed in Table 3. Each factor is represented by aseparate feature vector consisting of one or several features.The concatenation of these individual feature vectorscorrespond to a 66-dimentional feature vector or record.Likewise, each session consists of several mouse records, eachcorresponding to (n 30) consecutive mouse actions.In Table 3, the factors PER MAD, PER DD, PER MTD,ADD, ASD, AVXD, AVYD, and ATVD are calculated foreach of the 8 movement directions (identified above). As aresult, each of these factors is represented by eight featurevalues, each corresponding to a separate direction.A silence occurrence is identified when the mouse movedistance is 0. The percentage of silence occurrence in asequence of mouse actions is represented by the feature SR.E. Data AnalysisAfter extracting the features, noise reduction is performed onkeystroke dynamics biometric features and mouse dynamicsbiometric features as explained in the following.As mentioned above, flight time is defined as the timebetween two consecutive keystrokes. For instance, the flighttime (down-down) is the time between pressing the first keyand pressing the second key. First, the flight time value mustbe positive since the keys are pressed consecutively.Second, by analyzing sample collected raw data for 5 randomusers (from our experiment), we observed that only a smallamount of samples involve flight times beyond 3 seconds.The percentage of records with flight time (down-down)greater than 3 seconds is 5.34% in the corresponding
5keystroke sample. As a result, we applied a filter by removingthe data that is outside the range [0, 3 seconds].TABLE 3: MOUSE DYNAMICS BIOMETRIC FEATURESFactorAverageclick timeSilence ratioPercentageof mouseaction permousemovementdirectionPercentageof distanceper mousemovementdirectionPercentageof mousemove timeper CTSecond1The average ofmouse clickstime.1The percentageof silenceoccurrence of asequence ofmouse actions.8The percentageof mouse actionoccurrence of asequence ofmouse actions ineach mouse movedirection.8The percentageof mouse movedistance of asequence ofmouse actions ineach mouse movedirection.SRPER MADPER DDPER MTD%%%%Description8The percentageof mouse movetime of asequence ofmouse actions ineach mouse movedirection.Averagedistance permousemovementdirectionADDPixel8The averagedistance in eachmouse movementdirection.Averagespeed permousemovementdirectionASDPixel /Second8The averagespeed in eachmouse movementdirection.AVXDPixel /Second8The averagevelocity in X axisin each mousemovementdirection.AVYDPixel /Second8The averagevelocity in Y axisin each mousemovementdirection.8The averagetangentialvelocity in eachmouse movementdirection.Averagevelocity in Xaxis permousemovementdirectionAveragevelocity in Yaxis permousemovementdirectionAveragetangentialvelocity permousemovementdirectionATVDPixel /SecondFor mouse dynamics data, we apply two types of filters.First, we apply the moving average filter on the capturedmouse move position data: computer screen x-y coordinates,and remove noise data on mouse dynamics feature values.Using the moving average, we take the means of 5 points asthe new values of the center point. We apply the movingaverage filter on x-coordinates and y-coordinates separately.The second filter applied on mouse dynamics data is similar tothe filter applied on keystroke dynamics. The mouse dynamicsdata considered are mouse move time and speed. In the mousedynamics data set collected for the above sample users, weobserved the percentage of data with mouse move time lessthan 1.5 seconds and mouse move speed less than 5,000 pixelsper second to be 97.44%. Therefore, we filter out as noisemouse move time and mouse move speed falling out of therange [0, 1.5 seconds] and [0, 5000 pixels], respectively.As discussed earlier, we learn a Bayesian network to buildthe user profile, and then use it to classify the monitoredsamples. In the Bayesian network learning step, it is assumedthat variables are discrete and finite. Since most of the featuresextracted from keystrokes and mouse actions are continuous,we convert them into nominal features through datadiscretization.IV. FRAMEWORK EVALUATIONA. Experimental Method and SetupThe experimental evaluation was conducted on a simplerversion of a social network website through which users sharepersonal information such as family events or photos withfriends. The main page is a normal user log on page, usinguser name and password authentication. After accessing anaccount, the website allows a user to perform the followingactions: Post status, Post pictures, Add comments on accountowner’s pictures, Browse friends list, Add comments onfriends’ statuses, and Add comments on friends’ pictures.Each user was required to log in the web site as themselves(genuine user) or other users (intruder). For each login session,the logging type was recorded. Users have access to theusernames and passwords of other users, in order to allowimpersonation attacks.The architecture of the website consists of a web server anda database server. The web server and the database serverwere set up on a computer with Dual CPU 3.2 GHz andmemory 2.00 GB RAM in our lab. The server was WindowsServer 2008. The database server was MySQL server. Usersused their own desktops, laptops or handheld devices (i.e.iPhone) to access the website. Requests originated from fourdifferent geographic locations, including Victoria (BritishColumbia, Canada), Toronto (Ontario, Canada), Oslo(Norway), and Shanghai (China).B. Collected DataIn total, 24 users with different background and computerskills participated in the experiment. The experiment lasted forabout 8 weeks. In total, 193 legitimate visits and 101 intrusivevisits were contributed by the test users. Table 4 provides abreakdown of the sample keystroke and mouse data collected.In Table 4, the data collected under each of the differentmodalities (keystroke, mouse actions) were grouped by
6sessions. Here, a session corresponds to a regular login sessionwhich spans from the time the user logs in to when he/she logsout. The samples collected within one session were groupedby a unique session ID.In the experiment, every test user contributed differentnumbers of sessions. Although the total numbers of samplesprovided by test users were high, the number of samples foreach session was low. For example, 62.6% of genuinekeystroke sessions contain less than 100 keystrokes.TABLE 4: COLLECTED SAMPLES STATISTICSKeystrokesNumber ofSamplesMouse 41719,0076,205FAR was computed as the average of the individual FAR overall the genuine users.D. User Enrollment and VerificationWe used stratified 10-fold cross validation to train theBayesian network corresponding to a user profile. Thevalidation steps are briefly explained in the following. First,randomize the records and divide them into 10 equal sizesubsets (or 10 folds). Each fold has similar class distribution.TABLE 5: BAYESIAN NETWORK TRAINING RECORDS AND VALIDATION RESULTSFOR LEGAL USERS (PCCR STANDS FOR THE PERCENTAGE OF CORRECTLYCLASSIFIED RECORDS).User2Averageper userTotal number of samples(all users)22,5856,69344,005103,6206User3User5C. Evaluation MethodFor each of the users, a reference profile was generated foreach individual modality based on a training set consisting ofpositive and negative records. Only genuine records were usedin the training sets. Genuine data is divided into enrolmentdata and test data based on the timeline. The earliest data(received in time) was used for enrolment while the datacollected subsequently was used for testing. For each of thelegal users, the positive records in the training set consisted ofgenuine enrolment samples for that user while the negativetraining records consisted of enrolment data from otherrandomly selected legal users. The numbers of selected users(for training per user) varied for each modality: the number ofselected legal users for keystroke dynamics was 8 whereas thenumber of selected users for mouse dynamics was 4.By analyzing the sample data, we found that the minimumnumber of positive records required to effectively train theBayesian network for each of the different modalities varies;the minimum number of keystroke dynamics records was 200and the minimum number of mouse dynamics records was2,500.To test for false rejection, for each of the genuine users, wecompared one-by-one the rest of their genuine sessions (notinvolved in building their profiles) against their own profile.The FRR for each of the genuine user was obtained as theratio between the number of false rejections and the totalnumber of trials. The overall FRR was obtained as the averageof the individual FRRs obtained for all the genuine users.To test for false acceptance, for each of the genuine users,we compared one-by-one against his/her profile the attacksessions generated for this user. The individual FAR wascomputed for each user as the ratio between the number offalse acceptances and the number of test trials. The ynamicsMouseDynamicsPositive TrainingNumber NumberofofSessions Records2579Negative TrainingNumber NumberofofSessions 32,38299.2245,1551429,22096.84
7This type of validation is called stratified validation. Second,repeat the run tests for 10 times. In each round i (1 i 10),the ith subset is removed from the training set and is used as atest set. We then obtain the correctly classified records for 10tests. The correctly classified records are the records whosepredicted class probability is over 50%. The total number ofcorrectly classified records is the sum for 10 tests. Thepercentage of correctly classified records (PCCR) is the totalnumber of correctly classified records divided by the totalnumber of records. Table 5 lists the numbers of sessions andrecords in each training set and the PCCR corresponding tolegal users’ profiles.Figure 2 displays the trained keystroke Bayesian Networksfor two different users; User 2 and User 7. In the verificationstage, we apply sample keystroke dyn
biometric modalities, namely, mouse and keystroke dynamics. We extract a separate model of the user behavior for each of the individual biometric modalities using a Bayesian network [21]. The global user profile is obtained by fusing the outcome of the individual Bayesian networks using the Bayesian fusion scheme explained in the next section.