Transcription
Mining Keystroke Timing Pattern for UserAuthenticationSaket Maheshwary and Vikram PudiCentre for Data Engineering and Kohli Center on Intelligent SystemsInternational Institute of Information Technology-HyderabadHyderabad, Indiasaket.maheshwary@research.iiit.ac.in, vikram@iiit.ac.inAbstract. In this paper we investigate the problem of user authentication based on keystroke timing pattern. We propose a simple, robustand non parameterized nearest neighbor based regression algorithm foranomaly detection. Our approach successfully handle drawbacks like outlier detection and scale variation. Apart from using existing keystroketiming features from the dataset like dwell time and flight time, otherfeatures namely bigram time and inversion ratio time are engineeredas well. The efficiency and effectiveness of our method is demonstratedthrough extensive comparisons with other methods using CMU keystrokedynamics benchmark dataset and has shown better results in terms ofaverage equal error rate (EER) than other proposed techniques.Keywords: Regression, Time series, Prediction, Security, Nearest neighbors, Pattern classification1IntroductionIn this era where everyone wants secure, faster, reliable and easy to use meansof communication, there are many instances where user information such aspersonal details and passwords get compromised thus posing a threat to systemsecurity. In order to tackle the challenges posed on the system security biometrics[4] prove to be a vital asset. Biometric systems are divided into two classesnamely physiology based ones and the ones based on behavior. Physiology basedapproach allows authentication via use of retina, voice and fingerprint touch. Incontrast, behavior based approach includes keystroke dynamics on keyboard ortouch screens and mouse click patterns.In this paper we propose an algorithm to deal with keystroke dynamics – abehavior based habitual rhythm which is used as a protective measure. Basedon the analysis of the keystroke timing patterns, it is possible to differentiatebetween actual user and an intruder. By keystroke dynamics we refer to anyfeature related to the keys that a user presses such as key down time, key uptime, flight time etc. In this paper, we concentrate on classifying users basedon static text such as user password. The mechanism of keystroke dynamicscan be integrated easily into existing computer systems as it does not require
any additional hardware like sensors thus making it a cost effective and userfriendly technique for authenticating users with high accuracy. It is appropriateto use keystroke dynamics for user authentication as studies [7][9] have shownthat users have unique typing patterns and style. Moreover, Syed et al. [7][9] hasproven some interesting results in their research work as well. First hypothesisSyed et al. [7][9] proved is that the users present significantly dissimilar typingpatterns. Second they have shown details about the relationship between usersoccurrence of sequence of events and their typing style and ability. Then theyexplained sequence of key up and key down events on the actual set of keys.They have also shown that there is no correlation between users typing skills andthe sequence of events. Hence all these factors make it difficult for intruders tomatch with the actual users typing patterns. Keystroke dynamics is concernedwith users timing details of typing data and hence various features could begenerated from these timing patterns. In this paper we are using timing featuresonly on static text.The rest of the paper is organized as follows. In section 2 we discuss relatedwork and our contribution. In section 3 we discuss the details of how featuresare engineered from the dataset and in section 4 we discuss the concept of optimal fitting line. In section 5 we present our proposed algorithm for keystroketiming pattern which is divided into two sub sections where first subsection discusses proposed approach and second subsection discusses the scaled Manhattandistance metric for anomaly detection. In section 6 we experimentally evaluateour algorithm and show the results. Finally, we conclude our study and identifyfuture work in Section 7.2Related WorkClassifying users based on keystroke timing patterns has been in limelight whenForsen et al.[26] first investigated whether users could be distinguished by theway they type on keyboard. Researchers have been studying the user typingpatterns and behavior for identification. Gaines et al. [27] investigated the possibility of using keystroke timings as to whether typists could be identified byanalyzing keystroke times as they type long passages of text. Monrose and Rubin[11] later extracted keystroke features using the mean and variance of digraphsand trigraphs. Peacock et al. [28] conducted a detailed survey on the keystrokedynamics literature using the Euclidean distance metric with Bayesian like classifiers. Bergadano et al. [29] and later Gunetti et al. [30] proposed to use therelative order of duration times for different n-graphs to extract keystroke features that was found to be more robust to the intra-class variations than absolutetiming. Some neural network based techniques have also been undertaken in thelast few years. While the back-propagation models used yield favorable resultson small databases, neural networks have a fundamental limitation that everytime a new user comes into the database the network needs to be retrained.Gunetti and Picardi [30] published great results for text-free keystroke dynamics identification where they merge relative and absolute timing information on
features. Zhong et al. [5] proposed a new distance metric by combining Mahalanobis and Manhattan distance metrics. Many machine learning techniqueshave been proposed as well for keystroke dynamics as an authentication system.Keystroke dynamics can be applied with variety of machine learning algorithmslike Decision Trees [22], Support Vector Machines [10], Neural Networks [23],Nearest Neighbor Algorithms [24] and Ensemble Algorithms [25] among others.One problem faced by researchers working on these type of problems is thatmajority of the researchers are preparing their own dataset by collecting datavia different techniques and the performance criteria is not uniform as well hencecomparison on similar grounds among the proposed algorithms becomes a difficult task. To address this issue, keystroke dynamics benchmark dataset is publicly provided with performance values of popular keystroke dynamics algorithms[3] to provide a standard universal experimental platform. Killourhy et al. [3]collected and published a keystroke dynamics benchmark dataset containing 51subjects with 400 keystroke timing patterns collected for each subject. Besidesthis they also evaluated fourteen available keystroke dynamics algorithms onthis dataset, including Neural Networks [24], KNNs, Outlier Elimination [13],SVMs [10] etc. Various distance metrics including Euclidean distance [3], Manhattan distance [20] and Mahalanobis [3] distance were used. This keystroketiming pattern dataset along with the evaluation criteria and performance values stated provides a benchmark to compare the progresses of new proposedkeystroke timing pattern algorithms on same grounds.2.1Our ContributionThe performance study of the fourteen existing keystroke dynamics algorithmsimplemented by Killourhy et al. [3] indicated that the top performers are theclassifiers using scaled Manhattan distance and the nearest neighbor classifier.In this paper we present a new nearest neighbor regression based algorithm foranomaly detection that assigns weight to the feature vector. Finally we usedscaled Manhattan distance metric for anomaly detection. Our algorithm has thefollowing desirable features:– Parameterless: We first design our nearest neighbor based regression algorithm and then show how the parameter can be automatically set, therebyresulting in a parameterless algorithm. This removes the burden from theuser of having to set parameter values – a process that typically involvesrepeated trial-and-error for every application domain and dataset.– Accurate: Our experimental study in Section 6 shows that our algorithmprovides more accurate estimates than its competitors. We compare ourapproach with 14 other algorithm using the same evaluation criteria forobjective comparison.– Robust/Outlier Resilient: Another problem with the statistical approachesis outlier sensitivity. Outliers (extreme cases) can seriously bias the resultsby pulling or pushing the regression curve in a particular direction, leading to biased regression coefficients. Often, excluding just a single extreme
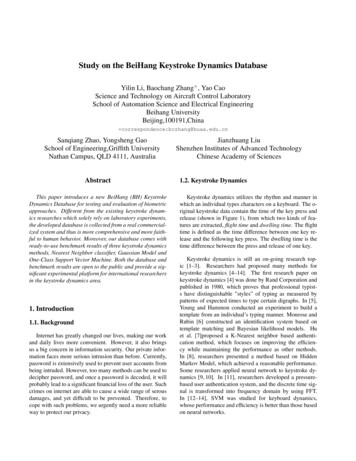
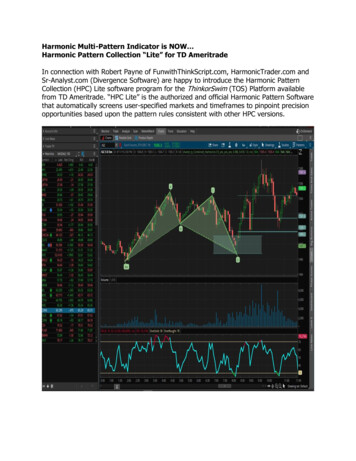
case can yield a completely different set. The output of our algorithm fora particular input record is dependent only on its nearest neighbors henceinsensitive to far-away outliers.– Simple: The design of our algorithm is simple, as it is based on the nearestneighbor regression. This makes it easy to implement, maintain, embed andmodify as the situation demands.Apart from our proposed algorithm we have engineered two new features namelyBigram time and Inversion Ratio time as discussed in Section 3.3Feature EngineeringWhat are good timing features that classifies a user correctly? This is still anopen research problem. Though keystroke up, keystroke down and latency timingare the commonly used features, in this paper we have generated two new featuresfrom the given dataset besides the existing features. The dataset [3] providesthree types of timing information namely the hold time, key down-key downtime and key up-key down time. Besides these three existing features, two newfeatures namely Bigram time and Inversion ratio time are engineered. Followingare the details of five categories of timing features which is used to generate 51features using keystroke timing dataset [3]. Figure 1 illustrates various timingfeatures where up arrow indicates key press and down arrow indicates key release.– Hold Time also known as dwell time, is the duration of time for which thekey is held down i.e. the amount of time between pressing and releasing asingle key. In figure 1, H i represents the hold time. Hold time contributes toeleven features (where ten features are corresponding to the ten charactersof static text and one feature corresponds to the return key).– Down-Down Time key down key down time is the time from when key1was pressed to when key2 was pressed. In figure 1, the times DDi depictsthe down down time. It contributes to ten features in our feature space.– Up-Down Time key up key down time is the time from when key1 wasreleased to when key2 was pressed. This time can be negative as well. Infigure 1, the times UDi depicts the up down time. It contributes to tenfeatures in our feature space.– Bigram Time is the combined time taken by two adjacent keystrokes i.e.the time from pressing down of key1 to releasing to key2. In figure 1, thetimes B i depicts the bigram time. It contributes to ten features in our featurespace.– Inversion Ratio Time it is the timing ratio of hold time of key1 and key2where key1 and key2 are the two continuous keystrokes. In figure 1, H i 1 /H iis the inversion ratio time. It contributes to ten features in our feature space.Hence these five categories of timing features combines to give a 51 dimensionalfeature vector.
Fig. 1: Illustration of generated keystroke timing features where A,B,C,D are the keys4Optimal Fitting LineRegression algorithms are used for predicting (time series data, forecasting),testing hypothesis, investigating relationship between variables etc. Here in thissection we discuss how the optimal fitting line [2] attempts to predict the relationship between one variable from one or more other variables by fitting alinear equation to observed data.Here in this paper we assume that to construct the line of best fit, withincrease or decrease in each independent variable value the dependent variablechanges smoothly. Thus this helps us in achieving almost linear relationshipbetween dependent and independent variables thus allowing us to optimally fita line onto the points in a small neighborhood. The line which minimizes themean squared error is referred to as optimal fitting line. A low value of errorindicates that the line is optimally fitted to the neighborhood and has capturedthe linearity of the locality. Let the k points have values {(x1 , y 1 ), ., (xk , y k )}in dimension x and y and let the variable to be predicted be y. Let the equationof line be of the form y ax b. Hence, dependent variable will take the valueaxi b corresponding to tuple i. Let the error in prediction for tuple i be denotedas ei and is equal to y axi b . Hence the local mean error (LME) is denotedas,PkPk(y axi b)2i 1 eiLM E(a, b) i 1(1)kk
By minimizing LME where a and b are the parameters denoted by,Pka j 1 y jPkj 1 xjPkPki 1 xi ki 1 xi y iPkPk2i 1 xi ki 1 xi(2)PkPky i a i 1 xib (3)kThus, we get the equation of the optimal fitting line. Now after constructingthe line of best fit, we are able to predict the dependent values for test tuple.Then we compare the actual and the predicted values of dependent variableto calculate least mean error for the given test tuple. Now based on the meanerror, we are assigning weights to our feature vector in inverse proportion whichis discussed in section 5.i 155.1Our Proposed ApproachProposed AlgorithmIn this section we discuss our proposed nearest neighbor regression algorithm indetail. Our algorithm successfully eliminates nearest neighbor algorithm problems like choice of number of neighbors k by choosing the optimal k value corresponding to minimum error thus making our algorithm to be non parametric innature. Our algorithm uses a unique weighing criteria (Algorithm 2) to assignweights to the feature vector hence enabling us to determine the relative importance of dimensions. The notation used for the algorithm is as follows: Thetraining data has d dimensions with feature variables (A1 , A2 , ., Ad ) and thevalue of the feature variable for the j th feature variable Aj corresponding to theith tuple can be accessed as data[i][j]. The value of the dependent variable of thetraining tuple corresponding to id value i can be accessed as y[i]. The value ofthe dependent variable is calculated using the cosine similarity and k representsthe number of nearest neighbors. For a given test tuple T the value of its knearest neighbors is determined using an iterative procedure (line 4 of algorithm1) hence making our algorithm to be non parametric in nature. The range forvalue k is from low to high where low is set to value 5 (sufficiently small value)an high is set to size of training data data/2 (sufficiently large value). Now wedescribe our algorithm using the pseudo code below shown in Algorithm 1-2.We iterate for k in range 5 to size of training data set/2 and calculate thek nearest neighbors for test data. The k evaluated neighbors are stored in listClosestNeighbors (line 6 of Algorithm 1). Now Algorithm 2 constructs an optimalfitting line Linei for each dimension of our feature vector (the dataset used byus has 51 features) by fitting a linear equation to observed ClosestNeighbors list,in the plane of feature variable and the dependent variable. The regression lineis constructed as discussed in section 4. Using the parameters from the equationof the line a and b (equation 2 and 3) we predict the dependent value of testdata (line 4 of Algorithm 2). Based on the predicted and actual values of thedependent variable squared error E i is calculated (line 5 of Algorithm 2).
Algorithm 11:2:3:4:5:6:7:8:9:10:11:12:13:14:procedure KNN based Dimensional RegressionM inimumError , Errorf orK OutputW eights 1 // All d dimensions have same weight initiallyfor each k low to high doErrorf orK 0ClosestN eighbors GetN eighbors(data, k, T )DimensionalRegressor(T ) // Algorithm 2if M inimumError Errorf ork thenM inimumError Errorf orkOutputW eight W Tend ifend forreturn OutputW eightend procedureAlgorithm 21: procedure Dimensional Regression2:for each i 1 to d do // d is the number of dimensions3:Linei ConstructLine(ClosestN eighbors, i) // As discussed in Secton 44:P redictedT estV ali T i a b5:E i (P redictedT estV ali ActualT estV ali )26:end for7:if i E i is equal then8:WT 19:else10:for each i 1 to d do11:weighti max(E i )/E i12:W T weighti13:end for14:end ifdPEj15: Errorf ork j 116: return W T17: end procedureIt would be appropriate to state that a lower error value in predicting the lineindicates that the constructed regression line is optimal in nature and fits theneighborhood of test data. Hence we conclude that the value of dependent variable predicted via the line of best fit is approximately correct and thus a higherweight should be assigned for a more optimal line or we can say a line withlower squared error. This intuition is captured by assigning weights in inverseproportion to the error in prediction for this dimension, hence a feature withhigh error value is assigned lower weight and and the feature with lower errorvalue is assigned higher weight. The squared error in prediction of neighbors(line 15 of Algorithm 2) is computed and stored in Errorf ork. A lower value
of the squared error indicates that the weight values chosen using the nearestneighbors are appropriate. We then select the value of the parameter k for whichthe calculated error is minimum and hence assigns the corresponding weight vector W T (line 8-10 of algorithm 1). On this weighted feature vector we evaluatethe anomaly score via a scaled Manhattan distance metric as discussed in thesection below. The approach demonstrated in Algorithm 2 is a completely novelidea for dimension wise assigning weights in inverse proportion to error.5.2Scaled Manhattan Distance MetricAfter the weights have been assigned to the feature vector via our proposedapproach, we calculate the anomaly scores as described by Killourhy et al. [3]for evaluating our model. For calculating anomaly score we are using a scaledManhattan distance metric as described by Araujo et al. [20]. The anomaly scoreis calculated as:Pni 1 xi y i (4)αiwhere for ith feature xi is the test vector and yi is the mean vector calculatedfrom training phase and αi is the mean absolute deviation from the trainingphase. From the equation 4 we can see that each dimension is scaled by a factorof αi hence making our algorithm capable to handle scale variation.6Experimental Setup and ResultsIn this section we discuss the evaluation criteria used and the performance of ourproposed model. We evaluated our approach on the CMU keystroke dynamicsbenchmark dataset [3]. 51 users are designated this task and average equal errorrate(EER) is used as the performance measure for this dataset.6.1Evaluation CriteriaWe frame keystroke dynamics based authentication as a one- class classificationproblem which learns a model for a user, rejects anomalies to the learned modelas imposters, and accept inliers as the genuine user. Although the use of negativeexamples in training could significantly improve the accuracy of the classifier,it is unrealistic to assume prior knowledge about the keystroke features fromimposters, let alone the availability of their training data. In order to ensurecomparison on same grounds we have used exactly the same evaluation criteriaas stated by Killourhy et al. [3] on our proposed approach. The data consistof keystroke timing information of 51 users, where each user is made to typea password 400 times. The .tie5Roanl password used for typing is a strongten character static text. All the 51 users enrolled for this data collection tasktyped the same password in 8 different sessions with 50 repetitions per sessionthus making each user to type 400 times in total. Following are the four stepsthat are used to evaluate the algorithm for classification of a single (called as a
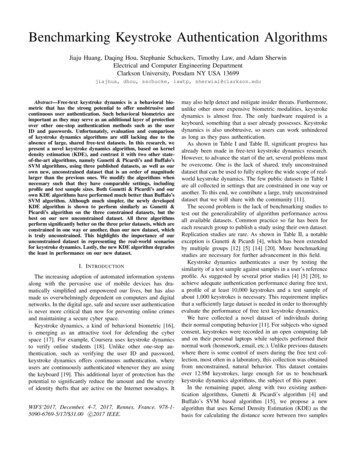
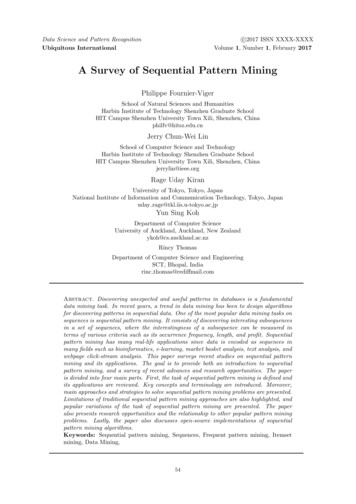
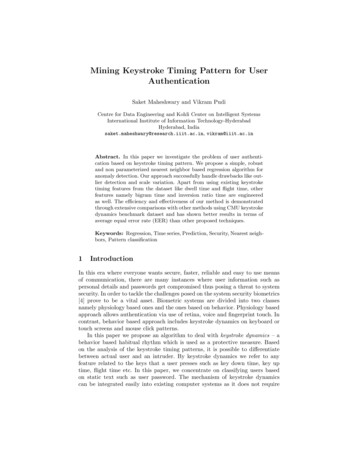
genuine user) from the other 50 users (called as the impostors). Repeating foursteps for all 51 users is to make sure that each user have been attacked all 50other users.– Model training Extract 200 initial timing feature vectors for a genuine userfrom the dataset. Our proposed approach is used to build a model depictingthe timing behavior of the users.– Testing genuine users Extract last 200 passwords typed by the genuineuser from the dataset. Now this is the testing phase for our proposed approach where these 200 timing feature vectors acts as test data. Scores generated in this step acts as the user scores.– Testing impostors Extract initial 5 passwords typed by each of the 50impostors (i.e., all subjects other than the genuine user) from the dataset.Based on our proposed algorithm and the model build in step 1 another setof scores are generated. Scores generated in this step acts as the impostorscores.– Assessing models performance Based on the genuine user scores andimpostor scores generated in the steps above, the ROC curve is generatedfor the actual (genuine) user. The equal error rate is calculated from the ROCcurve where the equal error rate corresponds to that point on the curve wherethe false positive rate (false-alarm) and false negative rate (miss) are equal.Repeat the above four steps, in total of 51 times where every time each ofthe subsequent user is taken as the genuine user from the 51 distinct users inturn, and calculate the equal-error rate for each of the genuine users. Thencalculate the mean of all 51 equal-error rates thus giving us the performancevalue for all users, and calculate the standard deviation which will give usthe measure of its variance across subjects.6.2ResultsFigure 2 shows ROC curve for different users with their Equal Error Rate (EER)value and user number where user number corresponds to the user as stated inCMU dataset1 . Table 1 shows the comparison of various proposed keystroketiming algorithms with our proposed approach. Comparison is shown with 14other algorithms which used the same dataset and the same evaluation criteria[3] thus assuring an objective comparison. Our proposed algorithm with andwithout two new engineered features (as discussed in Section 3) is able to achievean average equal error rate (EER) of 6.98% and 7.39 % respectively with astandard deviation (stddev) of 0.044 and 0.047 across 51 subjects. The averageequal error rate (EER) shown in the table below are the fractional rates between0.0 and 1.0, not the percentages. Clearly from Table 1, our proposed approachperforms superior than other proposed techniques in comparison.1Dataset available at http://www.cs.cmu.edu/ keystroke/
Fig. 2: Shows ROC curve for different users with their Equal Error Rate(EER) valuewhere user number corresponds to the user as labeled in CMU dataset.Table 1: Comparison of 16 different keystroke timing pattern algorithms that uses thesame CMU keystroke timing dataset and evaluation criteria in terms of Average EqualError Rate(EER)(with standard deviation shown in brackets).Model/AlgorithmAverage EER(stddev)Our Proposed Algorithm0.0698(0.044)(with 2 new engineered features)Our Proposed Algorithm0.0739(0.047)(without 2 new engineered features)Median Vector obis(No 0.0962(0.0694)Manhattan(scaled)Nearest Neighbor(Mahalanobis)0.0996(0.0642)Outlier Count(z-score)0.1022(0.0767)0.1025 (0.0650)SVM (one-class)Mahalanobis0.1101 (0.0645)0.1360 (0.0828)Manhattan (Filter)Neural Network(Auto-assoc)0.1614 (0.0797)0.1706 (0.0952)EuclideanFuzzy Logic0.2213 (0.1051)k Means0.3722 (0.1391)Neural Network(Standard)0.8283 (0.1483)7SourceAl-Jarrah [1]Zhong et al. [5]Zhong et al. [5]Killourhy et al. [3]Killourhy et al. [3]Killourhy et al. [3]Killourhy et al. [3]Killourhy et al. [3]Killourhy et al. [3]Killourhy et al. [3]Killourhy et al. [3]Killourhy et al. [3]Killourhy et al. [3]Killourhy et al. [3]Conclusion and Future WorkIn this paper we investigate the problem of authenticating users based on keystroketiming pattern. We engineered new features namely bigram time and inversionratio time apart from the features already given in the CMU keystroke timing
dataset. Besides engineering new features we also proposed a simple and robust nearest neighbor based regression algorithm. We evaluated our results andcompared it against 14 other algorithms that used the same dataset and evaluation criteria thus providing performance comparison on equal grounds. Althoughsimple, it proved to be effective as it outperformed majority of competing algorithms as shown in Table 1. Future work involves extending our work for softkeys or touch pad keys and in addition to timing pattern features we can useusers pressure patterns as well in order to authenticate users. We are planningto experiment with different curve fitting techniques as well.8AcknowledgementThis work was supported by http://metabolomics.iiit.ac.in/ and we would liketo thank them for their support.References1. Mudhafar, M., Al-Jarrah, An Anomaly Detector for Keystroke Dynamics Basedon Medians Vector Proximity. Journal Of Emerging Trends In Computing AndInformation Sciences VOL3, 2012. 6.2. A.Desai, H.Singh and V.Pudi , “Gear: Generic,efficient,accurate kNN-based regression”,Proc. Int. Conf. KDIR,pp.1 -133. Kevin S. Killourhy and Roy A. Maxion. “Comparing Anomaly Detectors forKeystroke Dynamics,” in Proceedings of the 39th Annual International Conference on Dependable Systems and Networks (DSN-2009), pages 125-134, Estoril,Lisbon, Portugal, June 29-July 2, 2009. IEEE Computer Society Press,Los Alamitos,California,2009.4. R. Giot, B. Hemery and C. Rosenberger, ”Low Cost and Usable Multimodal Biometric System Based on Keystroke Dynamics and 2D Face Recognition”, Int’lConf. on Pattern Recognition (ICPR), pp. 1128 -1131, 2010.5. Y.Zhong,Y. Deng,and A. K. Jain, “Keystroke dynamics for user authentication, inProceedings of the IEEE Computer Society Conference on Computer Vision andPattern Recognition Workshops (CVPRW ’12), pp. 1171123, Providence, RI, USA,2012.6. Jiacang Ho and Dae-Ki Kang, “Sequence Alignment with Dynamic Divisor Generation for Keystroke Dynamics Based User Authentication, Journal of Sensors, vol.2015, Article ID 935986, 14 pages, 2015. doi:10.1155/2015/9359867. Z. Syed, S. Banerjee, Q. Cheng, and B. Cukic, “Effects of User Habituation inKeystroke Dynamics on Password Security Policy,” IEEE 13th International Symposium on High-Assurance Systems Engineering, pp. 352-359, 20118. S. P. Banerjee and D. Woodard, “Biometric Authentication and Identification Using Keystroke Dynamics: A Survey,” Journal of Pattern Recognition Research, pp.116-139, 2012.9. Z. Syed, S. Banerjee, and B. Cukic, “Leveraging variations in event sequencesin keystroke-dynamics authentication systems, in Proceedings of the IEEE 15thInternational Symposium on High-Assurance Systems Engineering (HASE ’14),pp. 916, IEEE, January 2014.
10. Chu, W., Keerthi, S.S.: New approaches to support vector ordinal regression.In:ICML (2005)11. A. Messerman, T. Mustafic, S. Camtepe and S. Albayrak, Continuous andnon-intrusive identity verification in real- time environments based on free-textkeystroke dynamics, Intl Joint Conf. on Biometrics (IJCB), 2011.12. K. Revett, “A bioinformatics based approach to user authentication via keystrokedynamics, International Journal of Control, Automation and Systems, vol. 7, no.1, pp. 715, 2009.13. S. Haider, A. Abbas, and A. K. Zaidi. “A multi-technique approach for user identification through keystroke dynamics, IEEE Intl Conf. on Systems, Man and Cybernetics, pp. 13361341, 2000.14. Hilbe, Joseph, M.: Logistic Regression Models. Chapman and Hall/CRC Press(2009)15. I.H. Witten and E. Frank, Data Mining: Practical machine learning tools andtechniques, Morgan Kaufmann, 2 edition, 2005.16. Hall, M., Ian, H.: The Weka Data Mining Software: An update. SIGKDD Explorations (2009)17. E. Yu and S. Cho. “GA-SVM wrapper approach for feature subset selection inkeystroke dynamics identity verification, In Proc. Intl Joint Conf. on Neural Networks (IJCNN), pp. 22532257, 2003.18. R. Joyce and G. Gupta. “Identity authentication based on keystroke latencies,Communications of the ACM, 33(2):168176, 1990.19. D. Gunetti and C. Picardi. “Keystroke analysis of free text, ACM Transactions onInformation and System Security, 8(3):312347, 2005.20. L. C. F. Ara ujo, L. H. R. Sucupira, M. G. Liz arraga, L. L. Ling, and J. B. T.Yabu-uti. User authentication through typing biometrics features. In Proceedingsof the 1st In- ternational Conference on Biometric Authentication (ICBA), volume3071 of Lecture Notes in Computer Science, pages 694700. Springer-Verlag, Berlin,2004.21. F. Monrose, A.D. Rubin / Future Generation Computer Systems 16 (2000) 35135922. Brieman, L., Friedman, J., Olshen, R., Stone, C.: Classfication and RegressionTrees. Wadsworth Inc. (1984)23. Haykin, S.: Neural Networks-A comprehensive foundation. Prentice-Hall (1999)24. Cover, T.M., Hart, P.E.: Nearest Neighbor Pattern Classfication. IEEE Transactions on Information Theory (1967)25. Schapire, R.E.: A Brief Introduction to Boosting. In: ICJAI (1999)26. G. Forsen, M. Nelson, and R. Staron, Jr. Personal attributes authentication techniques.Technical Report RADC-TR-77-333,Rome Air Development Center, October 1977.27. R. S. Gaines, W. Lisowski, S. J. Press, and N. Shapiro. Authentication by keystroketiming: Some preliminary results. Technical Report R-2526-NSF, RAND Corporation,May 1980.28. A. Peacock, X. Ke, and M. Wilkerson. Typing patterns: A key to user identification.IEEE Security and Privacy,2(5):4047, 2004.29. F. Bergadano, D. Gunetti, and C. Picardi, “User Authentication through KeystrokeDynamics, ACM Trans. Information and System Security, 5(4), pp. 367397, 2002.30. D. Gunetti and C. Picardi. “Keystroke analysis of free text, ACM Transactions onInformation and
patterns and behavior for identi cation. Gaines et al. [27] investigated the pos-sibility of using keystroke timings as to whether typists could be identi ed by analyzing keystroke times as they type long passages of text. Monrose and Rubin [11] later extracted keystroke features using the mean and variance of digraphs and trigraphs.