Transcription
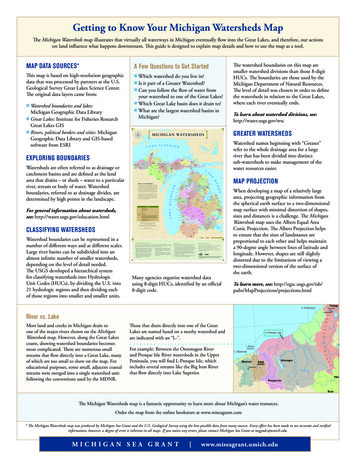
Getting to Know Your Michigan Watersheds MapThe Michigan Watersheds map illustrates that virtually all waterways in Michigan eventually flow into the Great Lakes, and therefore, our actionson land influence what happens downstream. This guide is designed to explain map details and how to use the map as a tool.MAP DATA SOURCES*A Few Questions to Get StartedThis map is based on high-resolution geographicdata that was processed by partners at the U.S.Geological Survey Great Lakes Science Center.The original data layers came from:n atershed boundaries and lakes:WMichigan Geographic Data Libraryn Great Lakes: Institute for Fisheries ResearchGreat Lakes GISn Rivers, political borders and cities: MichiganGeographic Data Library and GIS-basedsoftware from ESRIn hich watershed do you live in?W Is it part of a Greater Watershed?n Can you follow the flow of water fromyour watershed to one of the Great Lakes?n Which Great Lake basin does it drain to?n What are the largest watershed basins inMichigan?nTo learn about watershed divisions, see:http://water.usgs.gov/wscGREATER WATERSHEDSWatershed names beginning with “Greater”refer to the whole drainage area for a largeriver that has been divided into distinctsub-watersheds to make management of thewater resources easier.EXPLORING BOUNDARIESWatersheds are often referred to as drainage orcatchment basins and are defined as the landarea that drains – or sheds – water to a particularriver, stream or body of water. Watershedboundaries, referred to as drainage divides, aredetermined by high points in the landscape.MAP PROJECTIONFor general information about watersheds,see: http://water.usgs.gov/education.htmlCLASSIFYING WATERSHEDSWatershed boundaries can be represented in anumber of different ways and at different scales.Large river basins can be subdivided into analmost infinite number of smaller watersheds,depending on the level of detail needed.The USGS developed a hierarchical systemfor classifying watersheds into HydrologicUnit Codes (HUCs), by dividing the U.S. into21 hydrologic regions and then dividing eachof those regions into smaller and smaller units.The watershed boundaries on this map aresmaller watershed divisions than those 8-digitHUCs. The boundaries are those used by theMichigan Department of Natural Resources.The level of detail was chosen in order to definethe watersheds in relation to the Great Lakes,where each river eventually ends.Many agencies organize watershed datausing 8-digit HUCs, identified by an official8-digit code.When developing a map of a relatively largearea, projecting geographic information fromthe spherical earth surface to a two-dimensionalmap surface with minimal distortion of shapes,sizes and distances is a challenge. The MichiganWatersheds map uses the Albers Equal AreaConic Projection. The Albers Projection helpsto ensure that the sizes of landmasses areproportional to each other and helps maintaina 90-degree angle between lines of latitude andlongitude. However, shapes are still slightlydistorted due to the limitations of viewing atwo-dimensional version of the surface ofthe earth.To learn more, see: ctions.htmlRiver vs. LakeMost land and creeks in Michigan drain toone of the major rivers shown on the MichiganWatersheds map. However, along the Great Lakescoasts, drawing watershed boundaries becomesmore complicated. There are numerous smallstreams that flow directly into a Great Lake, manyof which are too small to show on the map. Foreducational purposes, some small, adjacent coastalstreams were merged into a single watershed unitfollowing the conventions used by the MDNR.Those that drain directly into one of the GreatLakes are named based on a nearby watershed andare indicated with an “L-”.For example: Between the Ontonagon Riverand Presque Isle River watersheds in the UpperPeninsula, you will find L-Presque Isle, whichincludes several streams like the Big Iron Riverthat flow directly into Lake Superior.The Michigan Watersheds map is a fantastic opportunity to learn more about Michigan’s water resources.Order the map from the online bookstore at www.miseagrant.com* The Michigan Watersheds map was produced by Michigan Sea Grant and the U.S. Geological Survey using the best possible data from many sources. Every effort has been made to use accurate and verifiedinformation, however, a degree of error is inherent in all maps. If you notice any errors, please contact Michigan Sea Grant at msgpubs@umich.edu.MICHIGAN SEA GRANT www.miseagrant.umich.edu
owingpoints: Weallliveinanddependonwatersheds. lowofwaterthroughourwatershedandrivers. rriversandlakes. Wheredoesthewaterinalakecomefrom? Wheredoesariverbegin?Wheredoesitend? Whatdetermineswhichdirectionariverflows? ?Whymightariverdryup? ngastheyexplorethemap.Forexample,ask: hepathofthebiggestriverinyourwatershed. directiondoesthisriverflow?Wheredoesitend? eingnexttoariver? iverflow?Wheredoesitend? atershed. werpeninsula). owtooneoftheGreatLakes?Page2
iveonly26- edoesallthatraingo? areastolowerareaswithinthewatershed. dandwillsustainthemintimesofdrought. chriversandlakesthroughthreedifferentpathways:(1) Landingdirectlyonthem(precipitation).(2) erriversandlakes(runoff).(3) n.Dataisfrom1960- ‐1990.(NationalAtlas.Gov)KeyPointsØ d’ssurfaceorreturntotheatmosphere.Ø Ø rsduringsnowm elt?Page4
thdrawwaterslowly,discouraginglarge- ofthestate’shigh- Michigan’seconomy.Soil dingallonsperminute(gpm)KeyPointsØ somepartsofMichigan.DiscussionQuestionsØ homesthatusegroundwater?Page5
nsectsandfishsuchastrout.Inareaswithmedium- ‐orfine- hhabitatandcancreatelastingwater- rocksorpebblestolayKeyPointsØ mlesssuitablefortrout.DiscussionQuestionsØ ynot?Ø Page6
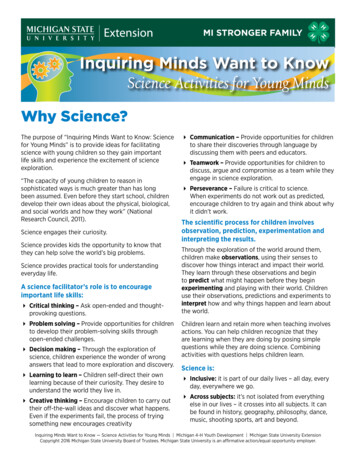
aGage: near ManistiqueDrainage Area: 1,100 mi240002000Tahquamenon RiverGage: near ParadiseDrainage Area: 790 mi26000Stream flow (cfs)6000Stream flow (cfs)bManistique River4000200000JanAprilJanAugAprilAugcAu Sable RiverGage: near McKinnleyDrainage Area: 1513 mi26000Stream flow (cfs)Dec400020000JanAprild6000Stream flow (cfs)AugDecManistee RiverGage: near ShermanDrainage Area: 857 mi2400020000JanfAugeRiver Raisin400020000DecClinton RiverGage: near Mt ClemensDrainage Area: 734 mi26000Gage: near MonroeDrainage Area: 1042 mi2Stream flow (cfs)Stream flow cFigure 8. Changes in daily mean stream flow over the course of a year in select rivers around Michigan. Each graph shows therate at which water flows through the river in cubic feet per second (cfs). (All data from USGS 2009 Annual Data Report.)Page
Usethemapsinthisguidetoask: nstream. sharprisesandfallsinstreamflow? ftheLowerPeninsula? groundwater,creatingsteadyyear- ‐roundflows,coldwaterconditionsandworld- ormodifyingdams.Page8
sleachamber- damscreatelake- ream.Allofthesetechniquesareknownaslow- rated,cost- ‐effectiveway.Page9
es.Everyoneplaysaroleinprotectingcleanwater: imming. ndinsectsPartialBodyContactTotalBodyContact nswithdeep- ColdwaterFishery weenMay1andOctober31 aporate. ised4/2/99.KeyPointsØ watershed.Ø andminimizingrunoff.DiscussionQuestionsØ terialsandshrubs.Page10
gyandhydrology,aseriesoffull- r ausethe WatershedsMapandtheothermapsin tions.http://www.egr.msu.edu/igw/GWIM%20Figure%2 ersheds,includingknownimpairmentsand gicunitcode(8- ewatershedswithtrouthaveincommon?toyourwatershed. watershed?MichiganGeographicDataLibrary /techalive.mtu.edu/meec flowpatterns?Thiswebsiteprovideswater- ‐relateddatasets,teachingsuggestionsandready- ‐to- opTheUSGSprovidesbothreal- ‐timeandhistoricaldatahigher- mflowandwaterquality.www.greatlakeslessons.com ds,fisheriesandfoodwebs. ://wdr.water.usgs.gov/nwisgmap/WaterontheGo e.cranbrook.edu/Page 11
articlesbygravity,windorwater.Groundwater:Thesub- agebasinshavebeendividedandsub- ledcatalogingunitsor8- urfaceandintodeersediments.Non- orrecentlytransportedanddepositedbywat
river, stream or body of water. Watershed boundaries, referred to as drainage divides, are . includes several streams like the Big Iron River that flow directly into Lake Superior. The watershed boundaries on this map are smaller watershed divisions than those 8-digit HUCs. The boundaries are those used by the