Transcription
2020OUTLOOKTrends in US Capital Markets
About SIFMASIFMA is the leading trade association for brokerdealers, investment banks and asset managersoperating in the U.S. and global capital markets. Onbehalf of our industry’s nearly 1 million employees,we advocate for legislation, regulation and businesspolicy, affecting retail and institutional investors,equity and fixed income markets and relatedproducts and services. We serve as an industrycoordinating body to promote fair and orderlymarkets, informed regulatory compliance, andefficient market operations and resiliency. We alsoprovide a forum for industry policy and professionaldevelopment. SIFMA, with offices in New York andWashington, D.C., is the U.S. regional member of theGlobal Financial Markets Association (GFMA).
SIFMA plays a pivotal role in helping firms adapt tochange and raise the bar on the experience and valuewe provide to clients. Investors’ lives are changingfaster than ever, and we’re innovating to serve themnow and into the future.Joseph E. SweeneyPresident of Advice & Wealth Management, Products and Service Delivery, Ameriprise Financial2020 Chair, SIFMA Board of DirectorsSIFMA 2020 Outlook3
Our MembersSIFMA members provide access to capital so that ideas, businesses and savings can grow. America’s capitalmarkets are the strongest in the world, providing 65% of funding for economic activity. Our members’combined businesses represent 75% of the U.S. broker-dealer sector by revenue and 50% of the assetmanagement sector by assets under management.2019-2020 Board Officers2019 ChairJAMES R. ALLENVice ChairmanRobert W. Baird & Co.Incorporated2020 ChairJOSEPH E. SWEENEYPresident, Advice & WealthManagement, Products andService DeliveryAmeriprise Financial, Inc.TreasurerJAMES WALLINSenior Vice PresidentAllianceBernsteinPresident and CEOKENNETH E. BENTSEN, JR.President and CEOSIFMAOur History19121913SIFMA’s first predecessor tradeThe Association ofThe IBA creates our very firstgroup, the Investment BankersAmerican Stock Exchangecommittee, the EducationAssociation of America (IBA), wasFirms (ASEF) was formedCommittee. Our currentfounded to be the voice of theto represent the interestorganization is structuredinvestment banking industry.of the financial markets.through approximately 35An eventual merger in 1971such committees.between the ASEF and IBAwas a natural fit.41914SIFMA 2020 Outlook
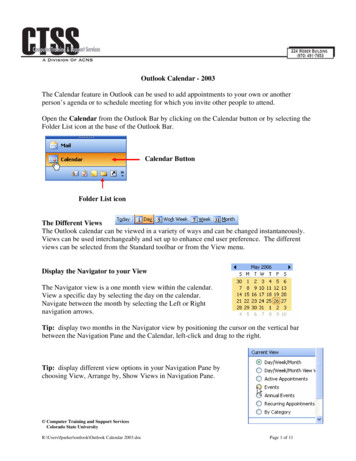
The Securities IndustryThe securities industry has employees in every state, employing 944,000 individuals across the country(a 1.8% increase year-over-year).Source: Bureau of Economic Analysis(as of 2018)0–9991,000–10,00010,001-50,00050,001 1971197619972007 – PresentIBA and ASEF merged toIBA’s Municipal SecuritiesPSA expanded over theStarting a new chapterform the Securities Industryand Government Bondsyears and changed itsbut building on our sharedAssociation (SIA), as theCommittees (establishedname to The Bond Markethistory, the Securitiesindustry recognized thein 1918) incorporatedAssociation (TBMA) toIndustry and Financialneed to formally combineas an independentreflect the organization’sMarkets Association (SIFMA)efforts and establish oneorganization, forminggrowing representation ofwas created through theassociation representing allthe Public Securitiesthe debt markets.merger of SIA and TBMA.of Wall Street.Association (PSA).SIFMA 2020 Outlook5
Our CommitteesSIFMA is a member-driven organization. On behalf of our industry’s one million employees, SIFMA’s committeesshare their views on legislation, regulation and business policy affecting retail and institutional investors, equityand fixed income markets and related products and services. We engage with policymakers and regulatorsthrough comment letters, testimony, research and more. SIFMA’s committee structure includes 35 standingcommittees, 21 forums and 8 advisory councils overseen by 6 Board subcommittees.CommitteesAsset Management State Regulation & Legislation Committee SIFMA AMG Steering CommitteeLegal & Compliance SIFMA AMG Accounting Policy Committee Amicus & Litigation Advisory Committee SIFMA AMG Derivatives Committee Anti-Money Laundering (AML) & Financial Crimes SIFMA AMG Equity Market Structure CommitteeCommittee SIFMA AMG Fixed Income Market Structure Compliance & Regulatory Policy CommitteeCommittee Technology & Regulation Committee SIFMA AMG Operations Executive CommitteeOperations & Technology SIFMA AMG Tax Committee Operations & Technology CommitteeCapital Markets Business Continuity Planning Committee Corporate Credit Committee Cybersecurity Committee Equity Markets and Trading CommitteePrivate Client & Wealth Management Listed Options Trading Committee Arbitration Committee Municipal Securities Committee ERISA/Retirement & Savings Committee Primary Markets Committee Private Client Services Committee Prime Brokerage and Securities Lending Committee Private Client Legal Committee Rates and Funding CommitteePrudential & Capital Securitization Committee Prudential Committee Swap Dealer Committee Dealer Accounting & Capital CommitteeGovernment Relations & Communications Federal Tax Committee Federal Government Representatives Committee State Tax Committee International Policy Committee Tax Compliance and Administration Committee6SIFMA 2020 Outlook
Councils SIFMA Advisory Council Muni Swap Index Advisory Council Communications Council SIFMA AMG MAC Advisory Council Diversity & Inclusion Advisory Council Regional Firm CEOs Council General Counsels Committee TBA Guidelines Advisory CouncilForumsAsset Management GroupLegal & Compliance SIFMA AMG CCO and Enforcement Forum Electronic Communications & Records Forum SIFMA AMG Collateral Operations Forum Privacy & Data Protection Forum SIFMA AMG Counterparty Risk ForumOperations & Technology SIFMA AMG Custodian Operations Forum Banking Services Management Forum SIFMA AMG Derivatives Europe Forum Blockchain Forum SIFMA AMG Derivatives Operations Forum Clearing Firms Forum SIFMA AMG Operational Risk Forum Insider Threat Forum SIFMA AMG Retirement Investment ForumPrivate Client & Wealth ManagementCapital Markets Senior Investor Protection Forum MBS Operations ForumPrudential & Capital Municipal & Corporate Operations Forum Regulatory Capital and Margin Forum Municipal Legal Forum Retail Fixed Income Forum Swap Dealer Compliance ForumThe GFMA Partnershipwww.gfma.orgThe Global Financial Markets Association (GFMA) is an extension of its regional association members:AFME in Europe, ASIFMA in Asia and SIFMA in the United States. GFMA’s mission is to provide a forumfor global systemically important banks to develop policies and strategies on issues of global concernwithin the regulatory environment.SIFMA 2020 Outlook7
Markets Matter
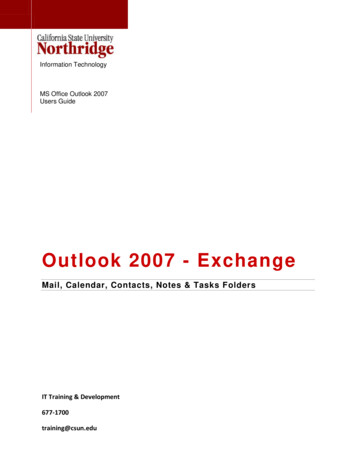
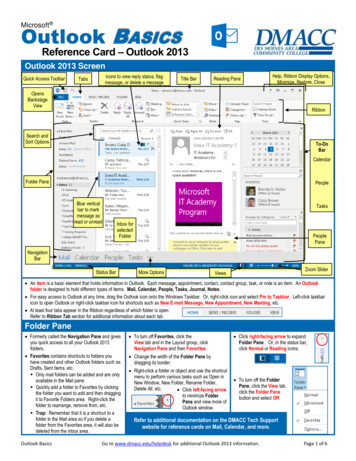
US Capital Markets Are theLargest in the WorldThe U.S. capital markets are the largest in the world and continue to be among the deepest, most liquid andmost efficient.Equities: U.S. equity markets represent 41% of the 75 trillion in global equity market cap, or 30 trillion;this is 3.8x the next largest market, the EU (excluding the U.K.).Fixed Income: U.S. fixed income markets comprise 40% of the 103 trillion securities outstanding acrossthe globe, or 41 trillion; this is 1.9x the next largest market, the EU (excluding the U.K.).Australia 1.8%Australia 1.7%Other DM 2.4%Canada 2.6%EM 2.4%Singapore 0.9%Canada 3.1%UK 4.9%HK 0.5%Singapore 0.4%Other DM 0.4%UK 5.6%HK 5.1%Japan 12.2%Japan 7.1%Global EquityMarket CapUS 40.8%Global FIOutstandingUS 40.2%China 8.5%China 12.6%EU27 10.8%EM 15.3%EU27 20.9%Source: World Federation of Exchanges, Bank for International Settlements (as of 2018)Note: FI fixed income; EM emerging markets; HK Hong Kong; DM developed markets.SIFMA 2020 Outlook9
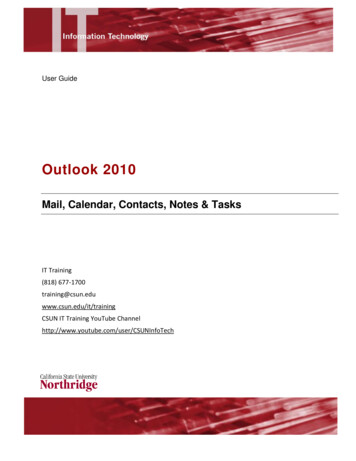
Capital markets recognize and drive capital to the best ideas and enterprises. Coupled with the free flow ofcapital, innovation is an integral component for supporting job creation, economic development and prosperity.Markets facilitate the transfer of funds from those who seek a return on their assets to those who need capitaland credit to grow.Clients benefiting from healthy capital markets include not just investors but also governments andcorporations. Capital, raised through equity and debt, can be used to grow businesses, finance investments innew plant, equipment and technology and fund infrastructure projects. This creates jobs and flows money intothe economy. Additionally, individuals and businesses can invest in securities to generate wealth.Capital Markets Drive OpportunityThere is a clear relationship between capital market depth and GDP per capita when expressed as purchasingpower parity. Higher GDP per capita means individuals have higher disposable income and the potential to savemore. Deeper capital markets may help drive higher GDP per capital through the more efficient allocation ofcapital. As such, the U.S., with its deep capital markets, accounts for 44% of total global markets activity. Itsmarkets drive high GDP per capita, which in turn provides individuals with economic opportunities.Capital Markets Around the WorldThe Relationship been the size and depth of Capital Markets,and GDP per Capita at PPPSource: New Financial Global Capital Markets Growth Index 2019Source: GFMA/New Financial report (as of 2017)Note: The size of each bubble denotes the average % share of total capital markets activity in the 25 sectors of activity studied10 SIFMA 2020 Outlook
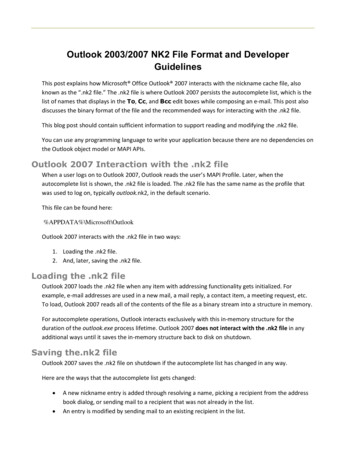
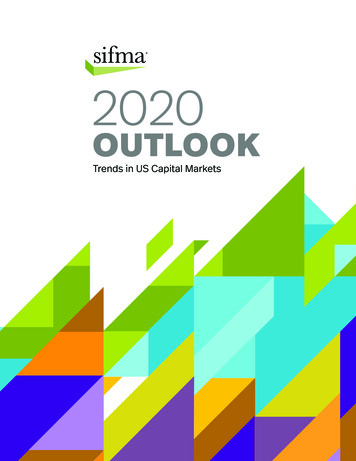
Capital Markets Fuel EconomiesIn the U.S., capital markets provided 65% of funding for economic activity. Capital markets enable debtissuance, which is a more efficient, stable and less restrictive form of borrowing for corporations. The use ofdebt capital markets to fuel economic growth is more prevalent in the U.S, at 79% of the total, whereas banklending is more dominant in other regions, around 21% on average.On the equities side, companies need capital for various business purposes – to invest in growth, fund mergersand acquisitions, etc. – and firms have several ways they can generate capital, including issuing IPOs. IPOsallow businesses to grow, innovate and better serve their customers.In short, U.S. capital markets are the bedrock of our nation’s economy.Financing of Non-Financial uro AreaJapanChinaDebt Financing of Non-Financial CorporationsBank LendingDebt Securities100%27%80%60%20%80%Source: Organization for Economic Cooperation and Development, European CentralBank, Bank of Japan, National Bureau ofStatistics of China, Federal Reserve (as of 2018,China 2015)JapanNote: Note: Euro Area 19 EU-member statesusing the Euro; EU 28 member states. Otherfinancing insurance reserves, trade creditsand trade advances. Economic activity definedas financing of non-financial corporations;DCM includes corporate bonds only.79%73%40%20%21%0%U.S.EUSIFMA 2020 Outlook 11
Market Insights
Market Structure Is the Key toCapital Markets StrengthEfficient and resilient market structure is the key to sustaining investor confidence and participationunderpinning the capital markets. The goal of regulators and market participants is to promote marketresiliency and ensure markets continue to benefit investors and play an essential role in capital formation.Market strength is crucial in both primary (issuance) and secondary (trading) markets, which are symbioticin nature. Efficiently functioning primary markets maintain the depth and liquidity in the secondary markets.Healthy secondary markets give issuers confidence their needs will be met at a good price level in theprimary markets, and the cost of capital will be lower at issuance when a liquid secondary market isavailable. It is important to maintain the robustness and efficiency of secondary markets. In addition topromoting capital formation, investors utilize secondary markets to generate returns and manage risk.To continue to function efficiently, capital markets need market makers, which stand ready to buy and sellsecurities at all times, including times of stress, thereby providing liquidity. They need stable, long-terminvestors and a robust regulatory structure. These factors support the framework for healthy, vibrant capitalmarkets. It is this structural support that is crucial to maintaining the longevity and stability of markets,ensuring they continue functioning even under times of economic or market stress.The stability of capital markets provides continued fuel for economic growth and job creation.SIFMA 2020 Outlook 13
Equities Issuance & Market CapIssuance: Total equity issuance was 221 billion in 2018, essentially flat Y/Y but up 19.7% since the low seen in2011. Issuance has declined at a 6.2% CAGR over the last five years.Market Cap: Total equity market cap was 30.4 trillion in 2018, -5.2% Y/Y yet 165.6% since the low seenduring the financial crisis. Market cap has grown at a 2.9% CAGR over the last five years.US Equity Issuance ( 195 198230229265285304249199221203 2201002018201720162015US Equity Market Cap ( 200620052004016.2 16.919.3 e: Dealogic, World Federation of Exchanges14 SIFMA 2020 820072006200520040
Fixed Income Issuance & OutstandingIssuance: Total fixed income issuance was 7.4 trillion in 2018, -1.4 Y/Y but up 59.2% since the low seen withthe financial crisis. Issuance has increased at a 3.1% CAGR over the last five years.Outstanding: Total fixed income outstanding was 43 trillion in 2018, 4.4% Y/Y and 87.1% since 2004.Outstanding has grown at a 2.7% CAGR over the last five years.US Fixed Income Issuance ( 5201420132012201120102009200820072006200520040US Fixed Income Outstanding ( 7MBS2016UST45432015105201820072006200520040Source: SIFMANote: Issuance is long-term instruments onlySIFMA 2020 Outlook 15
Equities MarketsInvestors in U.S. equities markets continue to enjoy narrow spreads, low transaction costs and fast executionspeeds. There is also plenty of opportunity for price improvement, especially for retail investors.On average (through September 2019), around 6.9 billion shares are traded on U.S. equity markets every day.ADV averaged 7.5 billion and 7.1 billion for the last 12 to 24 months, while the six month average was 6.9 billion.ADV Q143Q141Q153Q151Q163Q161Q173Q171Q183Q181Q193Q19ADV (B) vs VIX (#)ADV8.3987VIX 501Q143Q141Q153Q151Q163Q161Q173Q171Q183Q18Source: Cboe Global Markets, Bloomberg, SIFMA estimates (as of September 2018)16 SIFMA 2020 Outlook1Q193Q190
Capital FormationAs of September 2019, IPOs totaled 42.4 billion, essentially flat to this time period last year ( 0.5%). Of this, 38.2 billion, or 90.0% of the total, was in U.S. domiciled firms, 30.7% Y/Y. The number of deals was 112 YTD,-24.8% Y/Y; U.S. domiciled deals was 88, -22.1% Y/Y. The number of listed domestic companies was 4,496,down 35.0% since 2000 (6,917) but up 9.6% from the 2012 low (4,102).US IPOs Issuance by Domicille ( B)120Non-US Firms438US Firms# Deals 0005,5005,0004,500-200FY00 FY01 FY02 FY03 FY04 FY05 FY06 FY07 FY08 FY09 FY10FY11FY12FY13FY14FY15FY16FY17FY18YTD-300Number of Listed Domestic Companies in the US6,917# of CompaniesTrendline6,1775,6855,2955,2265,145 5,1335,1094,6664,4014,279 4,1714,102 4,1804,369 4,381 4,331 4,336 4,3974,4964,0003,500FY00 FY01 FY02 FY03 FY04 FY05 FY06 FY07 FY08 FY09 FY10FY11FY12FY13FY14FY15FY16FY17FY18YTDSource: Dealogic, Bloomberg, SIFMA estimates (as of September 2019)Note: U.S. domiciled companies listed on U.S. exchanges. Excludes BDCs, SPACs, ETFs, CEFs, & rights offersSIFMA 2020 Outlook 17
Private Wealth ManagementFinancial institutions pool their employee talent and product offerings to help individual investors, governmentsand corporations manage money. This includes: managing individual investor retirement accounts; providinginvestment advice; and overseeing corporate and government retirement plans.In the U.S., there are 34.6 trillion of retirement market assets, broken out across the following categories: Private pensions, 27.2% ( 9.4T) Defined contribution plans, 63.4% of total pensions or 6.0T Defined benefit plans, 36.6% of total pensions or 3.4T State and local government pensions, 26.3% ( 9.1T) IRAs, 25.4% ( 8.8T) Federal government pensions, 11.6% ( 4.0T) Annuities, 9.4% ( 3.3T) Financial institutions further help investors purchase individual stocks or other securities, such as mutualfunds ( 17.7 trillion market) and ETFs ( 3.4 trillion market)Trends in US Retirement Assets ( T)PensionsAnnuitiesGovt. - State/LocalGovt. - Federal403530252016.9 1819.821.219.221.323.4 23.925.629.232.530.5 31.0IRAs35.1 00820072006200520040Source: Federal Reserve Flow of Funds, SIFMA estimatesNote: Pensions includes defined benefit and defined contribution plans held by private individuals; 403 plans are included in private pensions18 SIFMA 2020 Outlook
FintechThe industry continues to analyze how fintech solutions can increase efficiencies in the back office, better serveclients, manage risk or meet regulatory reporting requirements. While much of a firm’s technology spend is onways to increase operational efficiencies and decrease costs (for the firms and also their customers), manyfirms also sponsor investments for fintech innovations. As such, we highlight a few fintech topics of interest tomarket participants.Robotics, Robotic Process Automation (RPA): Robotics and RPA have a shorter time frame to implementationcompared with some other emerging technologies. Automation via these fintech capabilities benefitsemployees and employers, by decreasing time it takes to perform tasks, and clients, by improving straightthrough processing and other procedures, all while increasing transparency and reducing operational risk.While RPA continues to gain maturity and is implemented in multiple areas, we learned at our annual OperationsConference & Exhibition that the current automation scope is only 3-7%, out of a 40% potential to automate.Some analysts have suggested 4 million bots may be active supporting RPA by 2021.Cloud: Cloud architecture can come in several forms: internal (private), public or hybrids. Initial use caseswere to gain raw computing power. Now, firms use clouds to access and utilize data in real time in a flexible andefficient manner and provide platforms for partnerships with third parties and new innovators. Firms can usemultiple cloud platforms together while controlling how they interact, with some adopting financial institutionsusing a combination of 3-4 private and public clouds. Yet, we learned at our annual Operations Conference& Exhibition that only 20% of workloads in financial services have moved to cloud technology. What will themodern cloud architecture look like – secure, fast, real-time access – when firms ramp up for a world requiringmore and more data be pulled in (while balancing with resiliency and risk management)?Artificial Intelligence (AI): AI has been in use at financial institutions for many years, for example: using itfor credit scoring in retail banking; using it in CCAR/stress testing to forecast and view changes in resultsunder different macro variables; using it in call centers, where evidence has shown query resolution increasessignificantly; and other, more simple processes. To continue to grow usage, firms are exploring how to embedAI into the workflow/decision process, for example: KYC/AML monitoring to automate the closing out of cases;or trader conduct surveillance to predict behavior before it happens. However, firms stress that oversight andcontrols are key in the implementation process. The deployment of AI needs to need to consider where thedata came from and how the model operates, understand how to supervise it and ensure AI is supporting withprofessional decision making, not replacing it.SIFMA 2020 Outlook 19
Repo MarketsA repurchase agreement (repo) is a financial transaction in which one party sells an asset to another party with apromise to repurchase the asset at a pre-specified later date, enabling market participants to provide collateralizedloans to one another to manage short-term fluctuations in cash holdings. Repos aid secondary market liquidity forthe cash markets (ex: UST), allowing dealers to act as market makers in a very efficient manner and keep secondarycash markets running effectively. This in turn contributes to lower interest rates paid by the issuers, most notablythe U.S. Treasury, which lowers debt servicing costs borne by taxpayers.The repo market is a crucial but little-known market that ordinarily hums steadily along. In September 2019, aconfluence of technical factors caused a shortage of cash and resulting massive short-term spike in repo rates.The Federal Reserve Bank of New York conducted a series of temporary repo and reverse repo operations toreduce volatility, ensure liquidity, and maintain stability of short-term borrowing rates. The Fed anticipates itsinterventions will continue into 2020.Bilateral Repo: Total average daily outstanding was 3.9 trillion in 2018, -3.3% Y/Y and -40.4% since the financialcrisis. Outstanding has decreased at a 1.8% CAGR over the last five years.GCF Repo: Total par amount was 33.3 trillion in 2018, 7.8% Y/Y but -60.0% since the financial crisis. Outstandinghas decreased at an 8.0% CAGR over the last five years.Bilateral Repo-Avg Daily Outstanding ( T)Repo7.04.74.94.94.74.24.0 4.0 rse 06200520040GCF Repo Total Par Amount ( .14030.83033.3201020 SIFMA 2020 Outlook20182017201620152014201320122011Source: NY Fed, SIFMA estimates20100
Transitioning to SOFR from LIBORThe transition from the London Interbank Offered Rate (LIBOR) to alternative interest rate benchmarks is wellunderway, but much work lies ahead in order to implement a successful reference rate change by the end of2021. In the U.S., the Alternative Reference Rates Committee (ARRC) is leading the transition away from LIBORto the Secured Overnight Financing Rate (SOFR). SOFR is based on the overnight repo markets, moving thereference rate from being based on 1 billion transactions per day (the most active tenor of LIBOR, threemonths) to the repo market with around 1 trillion of transactions per day. Publication of the SOFR rate began inApril 2018. Trading and clearing of SOFR-based swaps and futures began in May 2018.Historical SOFR Volumes & Rate (90-Day Avg.)Volume ( B)1,200250Rate (bps, RHS)2001,00080015060010040050Futures VolumeSwaps NOCash NO6,00026,4573,0002,0001,00097May18199 406 722Jun18Jul18Aug18946 g NO (RHS)5,0009/30/196/30/19SOFR Linked Product Growth Since May 2018 Inception ( Feb19Mar19Apr19May19Jun19Jul19Aug19Sep190Source: NY Fed, ARRC, CME Group, ICE, LCH, SIFMA estimatesNote: SOFR rate 90 day rolling averageSIFMA 2020 Outlook 21
Policy Viewpoints
SIFMA’s thought leadership, advocacy and supporttruly enhance the ability of its member firms to serveclients at the highest level.James R. AllenVice Chairman, Robert W. Baird & Co. Incorporated2019 Chair, SIFMA Board of DirectorsSIFMA 2020 Outlook 23
The financial industry and markets are in an extended period of dramatic change. Technology is revolutionizingthe industry, that is indeed true, but a confluence of several major events is actually behind our seismic shift.The industry is still absorbing new regulations to ensure safety and soundness, but finding our ability to facilitatecapital formation and economic growth is often constrained by it. The skills needed for today’s workforce arechanging and we are investing in our people to ensure they can grow with our firms. We are striving to foster adiverse and inclusive industry, with our professionals representative of our clients and our culture welcoming toall. The way we serve the individual investor is changing, too, with technology supporting our ability to focus onholistic wealth planning.It all comes back to what we do: bringing capital to the best ideas and enterprises, and bringing investmentopportunities to retail and institutional investors.Prudential RegulationSince the crisis, the financial industry has built up significant capital to enhance the resiliency of the financial system.A proxy for the entire financial system, firms subject to the Federal Reserve’s Comprehensive Capital Analysisand Review (CCAR) now have more than 1 trillion of Common Equity Tier 1 capital (CET1) – an increase of 71%since 2009. Their average CET1 ratio is 11.8%, well above the 7% minimum requirement and even greater thanthe maximum regulatory requirement inclusive of the highest G-SIB surcharge. It is also estimated that, for thelargest financial institutions, increases in capital and the introduction of convertible long-term debt as requiredby the TLAC rule has substantially increased total loss bearing capacity from roughly 15% in 2008 to morethan 25% in 2018.I believe it is prudent to review all our practices to ensure that they are asefficient and transparent as possible and that they remain appropriate in lightof changes in the industry that have been achieved.Randal K. QuarlesVice Chair for Supervision, Federal Reserve Board of GovernorsChair, Financial Stability BoardJuly 201924 SIFMA 2020 Outlook
With the adoption of numerous conservative prudential regulatory requirements, banks now hold excessivelevels of capital and liquidity that are increasingly disconnected from the level of risk they incur. Although theselevels have undoubtedly increased resiliency, they come at a cost: the more capital required, the less deployedinto the economy.Prudential and market regulators have set out to tailor and improve upon the post-crisis regulatory regime,executing on recommendations put forth by the Treasury Department to rebalance and modernize financialregulation. To that end, industry and regulators have been examining recalibrations to several major rulesadopted over the last ten years.Policymakers and regulators should take steps to ensure prudential regulations promote the stability of thefinancial system but do not negatively impact capital formation and economic growth, notably Basel provisions,including: Standardized approach for counterparty credit risk (SA-CCR); Supplementary leverage ratio (SLR) and enhanced supplementary leverage ratio (eSLR); CCAR requirements; Stress capital buffer (SCB) requirements; and Fundamental review of the trading book (FRTB).Are CCAR Shocks to the Trading Book Plausible?www.sifma.org/gms-lcd-studyA September 2019 study using statistical analysis of stress testing scenarios concludes that, ina number of significant areas, GMS/LCD shocks are not reasonably plausible and it is, therefore,important to revisit key aspects of CCAR.SIFMA 2020 Outlook 25
Capital MarketsMarket DataMarket data is information about current stock prices, recent trades, and supply-and-demand levels soldby national securities exchanges. Access to this information is essential to America’s world-leading capitalmarkets, because all participants need timely and complete data to make informed trading decisions. Becauseexchanges control that information, they have enormous pricing power over the cost to access the data.At SIFMA, we believe market data reform should focus on promoting competition, supporting efficient markets,and providing a transparent and fair system for all investors. We continue to advocate for improvements to theSIP content, consistent with the recommendations the SEC is developing for proposals to changes to the SIP,and for the addition of competing SIPs to replace single-consolidator model.Housing Finance ReformThe U.S. housing market is a critical piece of the general economy. It represents one-fifth of U.S. GDP and 35%of all private, non-financial debt in the country.In March 2019, a Presidential Memorandum was issued for Federal Housing Finance Reform that directed theU.S. Department of the Treasury and the Department of Housing and Urban Development (HUD) to conduct abroad review of our housing finance system, including the Government-Sponsored Enterprises (GSEs), FannieMae and Freddie Mac. In September, the Treasury and HUD released their housing finance reform plans. SIFMAsupports the U.S. Administration and Congress working together to identify a permanent solution. Moving theGSEs out of the conservatorship of their regulator, the Federal Housing Finance Agency (FHFA), is a goal that wesupport – but not without Congress taking the necessary action to address the need for an explicit governmentguarantee to ensure stable mortgage-backed securities (MBS). In their plans, the Administration outlined bothlegislative and administrative steps for reform of the GSEs and housing finance. While the outlook for legislationis uncertain, it is clear that the Administration intends to take administrative steps toward reform.26 SIFMA 2020
4 SIFMA 2020 Outlook Our Members SIFMA members provide access to capital so that ideas, businesses and savings can grow. America's capital markets are the strongest in the world, providing 65% of funding for economic activity. Our members' combined businesses represent 75% of the U.S. broker-dealer sector by revenue and 50% of the asset