Transcription
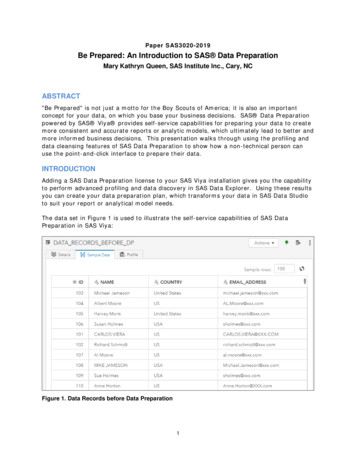
Paper SAS3020-2019Be Prepared: An Introduction to SAS Data PreparationMary Kathryn Queen, SAS Institute Inc., Cary, NCABSTRACT"Be Prepared" is not just a motto for the Boy Scouts of America; it is also an importantconcept for your data, on which you base your business decisions. SAS Data Preparationpowered by SAS Viya provides self-service capabilities for preparing your data to createmore consistent and accurate reports or analytic models, which ultimately lead to better andmore informed business decisions. This presentation walks through using the profiling anddata cleansing features of SAS Data Preparation to show how a non-technical person canuse the point-and-click interface to prepare their data.INTRODUCTIONAdding a SAS Data Preparation license to your SAS Viya installation gives you the capabilityto perform advanced profiling and data discovery in SAS Data Explorer. Using these resultsyou can create your data preparation plan, which transforms your data in SAS Data Studioto suit your report or analytical model needs.The data set in Figure 1 is used to illustrate the self-service capabilities of SAS DataPreparation in SAS Viya:Figure 1. Data Records before Data Preparation1
ADVANCED PROFILING AND DATA DISCOVERYWith SAS Data Preparation powered by SAS Viya, you have access to advanced profiling anddata discovery features. These allow you to investigate and discover data quality issues youmight want to address before using the data set in a report or analytical model.In SAS Data Explorer, you can manage your data by viewing details about it. On theAvailable tab, you can search for the in-memory data set that you want to work with. Onthe Details tab shown in Figure 2, you can view some basic information about that tablesuch as its column names and data types, when it was last profiled, the total number ofcolumns, row count, and table size.Figure 2. SAS Data Explorer: Details TabThe Sample Data tab shown in Figure 3 helps you determine if this is the table you want towork with. It displays a sampling of data from the selected table. By default, the samplesize is 100 rows; however, you can change this number and select the refresh button toview a different sample size.Figure 3. SAS Data Explorer: Sample Data Tab2
After reviewing the Details and Sample Data tabs, you can profile data to gain more insightson this data set. First, you should check your profile execution settings, by selecting Settings next to your logon name on the browser to open the Settings window shown inFigure 4 below and then select Profile in the Data Explorer section. You can select thefollowing profile options: Apply formats to variables when profiling data. Analyze column contents when running a profile.Figure 4. SAS Data Explorer: Profile SettingsThe first option, Apply formats to variables when profiling data, applies any SAS formats tothe data when the profile is generated. The second option, Analyze column contents whenrunning a profile, tags the column with a content type if one can be determined whenprofiling the data. For example, a column that contains street addresses might be taggedwith the Street Address identifier. This analysis can impact the profiling performance.Now that the profile settings are set, you can run the profile to get its metrics and contentanalysis information. If a data set has been profiled, it is displayed on the Profile tab. Thisdata set has not been profiled yet; therefore, to run the profile, select the Run Profilebutton on the Profile tab, as shown in Figure 5. Once the profile has completed, the resultsare displayed on the Profile tab. It might take several seconds (or maybe even a minute ortwo) to calculate all the profile results depending on the size of the data set.Figure 5. SAS Data Explorer: Profile Tab3
A data profile report enables you to recognize data patterns, identify scarcity in the data,and review basic statistics for the selected table such as Mean, Median, and Mode andcounts such as Null, Blank, and Pattern Counts. Some metrics might not be applicable to acolumn's data type. You can also drill-down into a particular column to view its specificmetrics, frequency distributions, and column ID analysis results. Figure 6 represents thecolumn profile results for the Name field.Figure 6. Name Column Profile ResultsFor a pattern, an uppercase A represents an uppercase letter, a lowercase a represents alowercase letter, a 9 represents a digit, and punctuation and spacing are displayed as-is.The highest ID analysis score for the column is the value with which the column is tagged.In Figure 7, the ID analysis identifies the Name column to contain Individual name data.This can be useful for identifying personal data that might need to be controlled or hidden.The column tag(s) are visible on the SAS Data Explorer – Details tab by selecting the tagbutton in the Tags column. You can also add additional column tags here.4
Figure 7. Name Column TagsBased on reviewing this data set, you might want to prepare the data as follows prior tousing it in any reports or analytical models: Remove duplicate records from the data set. Standardize the Country column. Use consistent casing format for the Name and Email Address columns.You also might want to augment this data set by adding a Gender field and parsing theName field into First Name and Last Name columns. This can be accomplished by creating aSAS Data Studio plan file to transform the data set. Figure 8 depicts the desired data setafter all the data preparation transformations in SAS Data Studio.Figure 8. Data Records After Data Preparation5
DATA STUDIO PLANSTo create a SAS Data Studio plan based on the data set you are analyzing, you can selectActions Prepare data in SAS Data Explorer while viewing the available in-memory tablefor the data set. As shown in Figure 9, this opens SAS Data Studio and starts a data planbased on the selected data set.Figure 9. SAS Data Studio PlanThere are five categories of transforms that you can apply to your data set: Column,Custom, Data Quality, Multi-input, and Row. These categories are shown in Figure 10.Figure 10. SAS Data Studio: Transform CategoriesThe Data Quality Transforms, shown in Figure 11, are powered by the SAS QualityKnowledge Base (QKB). The QKB is a set of files containing proprietary rules, expressions,6
and reference data that are combined to analyze and transform text data in various SASproducts such as SAS Data Integration Studio, DataFlux Data Management Studio, SAS Event Stream Processing, and SAS Data Preparation. The data quality transforms apply aQKB locale (language and country combination) and a definition to a selected sourcecolumn. Definitions define data formats for specific types of content and data cleansing. Forexample, a parse definition for a name describes how a name can be parsed into identifiablesegments such as given name, middle name, and family name.Figure 11. SAS Data Studio: Data Quality TransformsTo begin transforming the data set, first you might want to remove duplicate records. Tofacilitate this, generate Matchcodes for the columns you want to fuzzy match. In Figure12, Matchcodes are generated for the Name and Email Address columns using theappropriate QKB definitions for the respective data types of the columns. The sameMatchcode is generated for similar items so that they can be fuzzy matched. For example,when using the Name Matchcode definition, the same code is generated for the values"Michael Smith" and "Mike Smith".7
Figure 12. SAS Data Studio Plan: MatchcodesOnce you have Matchcodes for the columns you want to fuzzy match, the next step is toStandardize columns that you want to match exactly. In Figure 13, the Country column isstandardized using the appropriate QKB definition for its data type.8
Figure 13. SAS Data Studio Plan: StandardizeNow that you have the components to aid in finding duplicate records in your data set, youcan Match and Cluster the records. In Figure 12, you want to Match and Cluster recordsbased on the rule where the Name Match, Email Match, and Country Stnd columns arethe same. When this is the case, the records receive the same Cluster ID value.9
Figure 14. SAS Data Studio Plan: Match and ClusterWith the data records clustered, you can remove the duplicate records by using the Codetransform in the Custom Transforms section. Figure 15 shows the code that will keep therecord with the lowest ID value for the cluster.10
Figure 15. SAS Data Studio Plan: Code for Removing Duplicate RecordsNow that the duplicate records have been removed, you can perform a Gender Analysis onthe Name column using a QKB definition to make a best guess of the gender for thesupplied name, as shown in Figure 16.Figure 16. SAS Data Studio Plan: Gender AnalysisNext, you can use the Casing transform to propercase the Name column and lowercase theEmail Address column in order to put them in a consistent format, as shown in Figure 17.11
Figure 17. SAS Data Studio Plan: CasingTo split the Name Case column into First Name and Last Name columns, you can use theParsing transform with the appropriate QKB definition for the column's data type, as shownin Figure 18.12
Figure 18. SAS Data Studio Plan: ParsingFinally, you can use the Code transform to rearrange and only return the columns desiredfor your prepared data table that can then be used in your reports or analytical models.Figure 19 contains the code to create the desired output table for the data set.13
Figure 19. SAS Data Studio Plan: Code to Rearrange Column OrderThe plan file and the resulting table can be saved, as shown in Figure 20.Figure 20. SAS Data Studio Plan: Save Plan and TableFigure 21 is the resulting saved table from the data plan used to prepare the before dataset.14
Figure 21. Saved Table After Data PreparationIf needed, you also have the option to create a job from the plan file that can then bescheduled to run according to some time-based event. For example, you could schedule theplan job to execute and replace the resulting saved table every day at midnight.CONCLUSIONUsing the advanced data profiling and data discovery techniques in SAS Data Explorer helpsyou determine the data cleansing needs for your data set. Then, with SAS Data Studio, youcan implement your data cleansing plan using transforms, which include data qualitytransforms that use the SAS Quality Knowledge Base (QKB). SAS Data Preparationpowered by SAS Viya helps ensure that your data is cleansed and ready for use in yourreports and analytical models to better meet your business needs and aid in your businessdecisions.RESOURCES SAS Viya 3.4: Data Preparation / Getting Started. Available athttps://go.documentation.sas.com/?cdcId dprepcdc&cdcVersion 2.2&docsetId dprepgs&docsetTarget home.htm&locale en Rausch, Nancy. 2018. “What’s New in SAS Data Management.” Proceedings of theSAS Global Forum 2018 Conference. Cary, NC: SAS Institute Inc. Available as-global-forumproceedings/2018/1669-2018.pdf Rineer, Brian 2018. “Doin' Data Quality in SAS Viya ” Proceedings of the SASGlobal Forum 2015 Conference. Cary, NC: SAS Institute Inc. Available as-global-forumproceedings/2018/2156-2018.pdf SAS Data Management Community. Available t-p/data management15
CONTACT INFORMATIONYour comments and questions are valued and encouraged. Contact the author at:Mary Kathryn QueenSAS Institute Inc.MaryKathryn.Queen@sas.comhttp://www.sas.comSAS and all other SAS Institute Inc. product or service names are registered trademarks ortrademarks of SAS Institute Inc. in the USA and other countries. indicates USAregistration.Other brand and product names are trademarks of their respective companies.16
Adding a SAS Data Preparation license to your SAS Viya installatio n gives you the capability to perform advanced profiling and data discovery in SAS Data Explorer. Using these results you can create your data preparation plan, which transforms your data in SAS Data Studio to suit your report or analytical model needs. The data set in . Figure 1