Transcription
Ganglion cell analysis byoptical coherence tomography (OCT)Jonathan A. Micieli, MDValérie Biousse, MD
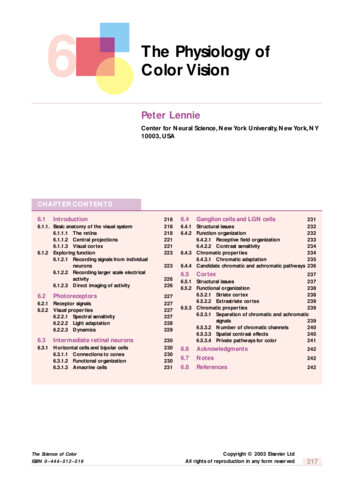
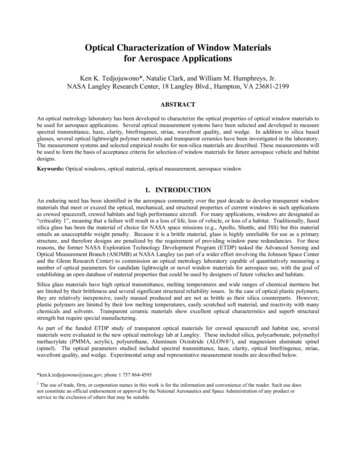
Figure 1.Normal OCT of the macula (cross section through the line indicated on the fundus photo)
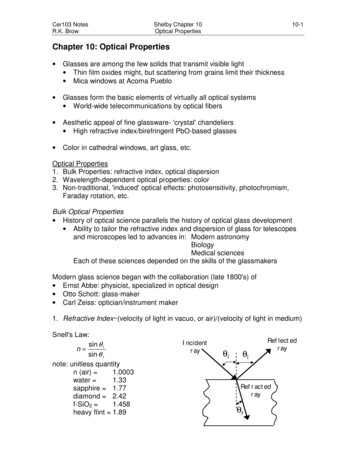
Figure 2.Layers of the retina seen on OCTRetinal nerve fiber layerGanglion cell layerInner plexiform layerInner nuclear layerOuter plexiform layerOuter nuclear layerExternal limiting membraneEllipsoid zoneRetinal pigment epithelium
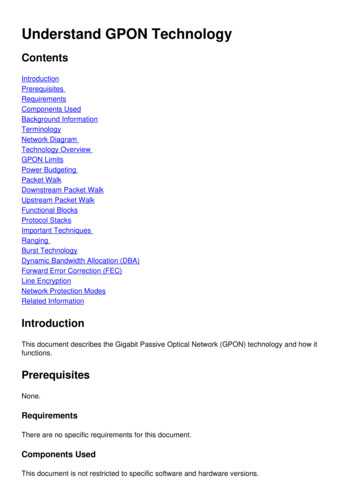
Figure 3.Layers of the retina seen on OCTRetinal nerve fiber layerGanglion cell layerInner plexiform layer Ganglion cell layer (GCL) is composed of cell bodies of retinal ganglion cells Retinal nerve fiber layer (RNFL) is formed by axons of the retinal ganglion cells Inner plexiform layer (IPL) consists of axons of bipolar and amacrine cells and dendrites of ganglion cells On the Cirrus SD-OCT, the GCL and the IPL are measured together as the ganglion cell layer complex (GCC)
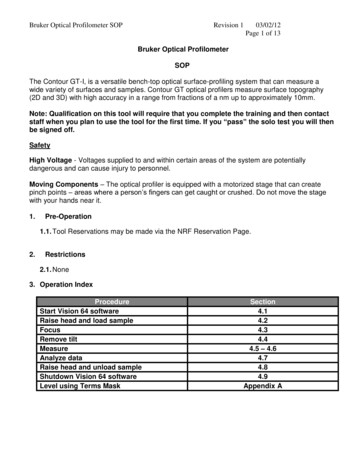
Figure 4.A single retinal ganglion cell isshown in redLateral geniculatenucleus (LGN)Most retinal ganglion cells (RGCs) synapse at the LGN of the thalamus.A lesion anywhere along the path of this RGC can result in cell death andbe seen in the retina with OCT.
Figure 5.Macular cube analysisGanglion cell analysisCirrus OCT of a healthy 31-year-old man is shown. From the macular cube analysis shown on the left, themacular ganglion cell analysis can be derived as shown on the right
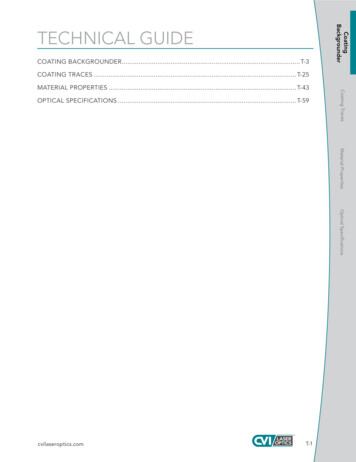
Figure 6. Reviewing the GCL printoutGanglion cell analysisEnsure date of birth is correctColor thickness map showsthickness measurement ofganglion cell layer (GCL) innerplexiform layer (IPL)Deviation map shows GCL IPLthickness topographicallycompared to normative dataHorizontal B-scan and overlay ofsegmentation lines. The purpleline represents boundary betweenRNFL and GCL and the yellowlines represents the boundarybetween the IPL and INLReview signal strengthSector map shows GCL IPLthickness in sextants, whichare color coded in comparisonto normative dataThickness table showsoverall GCL IPL thickness,which is color coded incomparison to normative data
Figure 7.Case 1
Figure 7.Thickness map showsthinning in nasal retina(blue color compared toyellow-orange in temporalretina)Deviation and sector mapsshow area in nasal retina(corresponding to temporalvisual field) that is thinner than1% (red) or 5% (yellow) ofnormal populationHorizontal B-scan showssegmentation lines that appearin the correct positionCase 1Thickness map showsthinning in temporal retina(blue color compared toyellow-orange in nasal retina)Deviation and sector mapsshow area in temporal retina(corresponding to temporalvisual field) that is thinner than1% (red) or 5% (yellow) ofnormal populationHorizontal B-scan showssegmentation lines that appearin the correct position
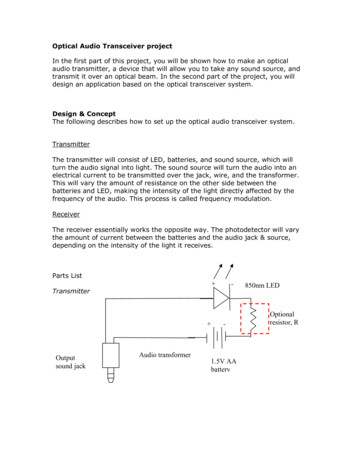
Figure 8. Case 1OSODGCL defects correspond to visual fielddefects. Recall temporal retina representsnasal visual field and vice versa.DWI sequence showsDWI (upper) and ADC(lower) maps showinfarct in the area of leftoptic tractGanglion Cell Layer analysisRetinal nerve fiber analysisThis is a 54-year-old woman with a right incongruous homonymous hemianopia due to anischemic stroke affecting the left optic tract. The visual field and Cirrus OCTs were obtained 2months after she had right-sided vision loss in both eyes.
Potential pitfalls in interpreting OCT of the ganglion cell analysis Age of the patient - ensure correct date of birth is entered since thicknessmeasurements are compared against age-matched controls Check signal strength - reduction in signal strength can result in loss of retinalfeatures and artifacts in in segmentation and interpretation. Signal strength of at least7/10 is preferable on Cirrus machines Check for errors in segmentation - an automated algorithm is used to identify innerlayer of GCL and outer layer of IPL and may not be correctly identified in patients withmacular disease or optic disc edema
Figure 9.Case 2
Figure 9. Case 2Due to the large amountof subretinal fluid seen inthe B-scan images, thereis an error insegmentation and theGCL-IPL thickness is notreliableThis patient has centralserous chorioretinopathySubretinal fluid
Figure 10.Case 3
Figure 10. Case 3Rounded edges on thedeviation map suggestthat there may be anerror in segmentationThis patient hasepiretinal membranes inboth eyes and there is anerror in segmentation.The GCL/RNFL andIPL/INL boundaries arenot correctly identified
Figure 11. Case 4Case 4
Figure 11. Case 4Rounded edges on thedeviation map suggestthat there may be anerror in segmentationThis patient has opticdisc edema and there isan error in segmentation.The GCL/RNFL andIPL/INL boundaries arenot correctly identified
Figure 11. Case 4ODAfter the optic disc edema resolves, there is correct segmentation and the GCL IPL thinninginferiorly OD corresponds to the superior visual field defect OD in this patient with non-arteriticanterior ischemic optic neuropathy
OCT of the ganglion cell complex (GCC) vs retinal nerve fiber layer (RNFL) Allows easy correlation of visual field defects since it is centered over the macula OCT of GCC usually shows loss earlier than RNFL GCC not affected by disc edema (assuming correct segmentation) whereas RNFL thickens with disc edemaIn this patient withan occipital lobestroke andretrograde transsynapticdegeneration,loss of RGCs canbe seen with OCTganglion cellanalysis andeasily correlatedto the visual fielddefect but not withOCT of the RNFLFigure 12.
Summary points: Optical coherence tomography (OCT) of the ganglion cell complex providesvaluable information when evaluating patients with optic neuropathies,chiasmal or retrochiasmal visual field defects The ganglion cell analysis has advantages over OCT of the retinal nerve fiberlayer (RNFL) since it can be easily correlated with visual field defects andusually shows changes earlier The ganglion cell analysis should be interpreted with caution since it is prone tosegmentation errors
Ganglion cell layer (GCL) is composed of cell bodies of retinal ganglion cells Retinal nerve fiber layer (RNFL) is formed by axons of the retinal ganglion cells Inner plexiform layer (IPL) consists of axons of bipolar and amacrine cells and dendrites of ganglion cells On the Cirrus SD-OCT, the GCL and the IPL are measured together as the ganglion cell layer complex (GCC)