Transcription
6The Physiology ofColor VisionPeter LennieCenter for Neural Science, New York University, New York, NY10003, USACHAPTER CONTENTS6.1 Introduction6.1.1. Basic anatomy of the visual system6.1.1.1 The retina6.1.1.2 Central projections6.1.1.3 Visual cortex6.1.2 Exploring function6.1.2.1 Recording signals from individualneurons6.1.2.2 Recording larger scale electricalactivity6.1.2.3 Direct imaging of activity2182182182212212236.2 Photoreceptors6.2.1 Receptor signals6.2.2 Visual properties6.2.2.1 Spectral sensitivity6.2.2.2 Light adaptation6.2.2.3 Dynamics2272272272272282296.3 Intermediate retinal neurons6.3.1 Horizontal cells and bipolar cells6.3.1.1 Connections to cones6.3.1.2 Functional organization6.3.1.3 Amacrine cells230230230230231The Science of ColorISBN 0–444–512–5192232262266.4 Ganglion cells and LGN cells2316.4.1 Structural issues2326.4.2 Function organization2326.4.2.1 Receptive field organization2336.4.2.2 Contrast sensitivity2346.4.3 Chromatic properties2346.4.3.1 Chromatic adaptation2356.4.4 Candidate chromatic and achromatic pathways 2366.5 Cortex2376.5.1 Structural issues2376.5.2 Functional organization2386.5.2.1 Striate cortex2386.5.2.2 Extrastriate cortex2396.5.3 Chromatic properties2396.5.3.1 Separation of chromatic and achromaticsignals2396.5.3.2 Number of chromatic channels2406.5.3.3 Spatial contrast effects2406.5.3.4 Private pathways for color2416.6 ight 2003 Elsevier LtdAll rights of reproduction in any form reserved217
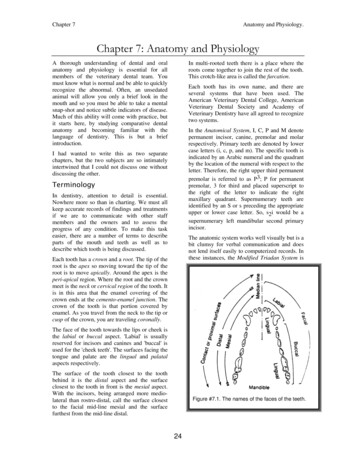
THE SCIENCE OF COLOR6.1 INTRODUCTIONMost of what we know about color vision hasbeen learned from psychophysical investigations, most of what we know about the underlying physiology has been discovered with theexplicit guidance of theories grounded in psychophysical observation, and mostly the physiological findings have confirmed expectations.One might therefore be forgiven for supposingthat to discuss the physiology of color vision ismerely to provide an account of the mechanicsof systems whose operating principles we understand well. To some extent that is true, particularly for the earliest stages of color vision, butmodern physiological investigations have alsorevealed an organization that could not be suspected from psychophysical observations.This chapter first reviews briefly the grossanatomy of the visual pathway, from the retina tothe occipital cortex. Then it examines the physiology of the different stages, beginning with a look atthe techniques used to explore it. Relatively littleof this work has been undertaken on the humanvisual system, but a great deal has been done onthe visual system of the macaque monkey, which,because its structure is similar to that of thehuman, is widely thought to be a good model.6.1.1 BASIC ANATOMY OF THE VISUALSYSTEM6.1.1.1 The retinaThe image is formed on the retina, shown in vertical cross-section in Figure 6.1. This highlightsvery clearly the layers that comprise a structureless than 0.5 mm thick.The general organization of the retina isbroadly the same in all vertebrates: there areOuter SegmentsInner SegmentsPhotoreceptorCell BodiesBipolar andAmacrine CellsGanglion CellsFigure 6.1 Vertical section through the primate retina, showing its layered structure. Light enters the retinafrom the bottom of the picture, passing through all layers before being absorbed in the outer segments ofphotoreceptors.The three principal layers of cells are identified.The rods and the cones lie nearest the top ofthe figure, with their different parts identified. Bipolar cells and amacrine cells lie in the inner nuclear layer.Ganglion cells lie in the ganglion cell layer. (From Boycott and Dowling, 1969.)218
THE PHYSIOLOGY OF COLOR VISION three vertical stages, with interconnecting horizontal pathways at the junctions between stages.Figure 6.2 shows this diagramatically. The photoreceptors, rods and cones, which form themost peripheral stage, lie farthest from the pupil,and light must pass through the thickness of theretina before being absorbed. Since the neuralretina is transparent, this is visually inconsequential. The inverted organization seems to bean adaptation to the demands of the photoreceptors – metabolically the most active cells inthe body – which derive their nutrients from thenearby choroid. Structurally, rods and cones aregrossly similar, consisting of two clearly definedparts, the inner and outer segments. The outersegment, nearest the choroid, contains the photopigment, and within it originate the light-evoked signals. The inner segment contains thebiological support mechanisms.Until relatively recently most anatomical workon the retina used vertical sections of the kindshown in Figure 6.1. These make clear the vertical strata and also some structural features suchas the fovea (Figure 6.3), which contains no rodsand where all neurons beyond the cones aredisplaced, forming a pit over the very denselypacked cones.Although neuroanatomists working with vertical sections have been able to identify somesub-classes of the major neuron groups identified in Figure 6.2 (principally through scrutiny ofthe levels at which their dendrites and axonsbranch), the clearest indications of different subclasses have often emerged through examinationFigure 6.2 Diagram of the neurons and their principal connections in the primate retina. C, cone; R, rod; MB,midget bipolar cell; DB, diffuse bipolar cell; S, S cone bipolar cell; H, horizontal cell;A, amacrine cell; MG, midgetganglion cell; PG, parasol ganglion cell; SG, S cone ganglion cell. Bipolar cells and ganglion cells colored red areoff-center types; those colored green are on-center types. (Adapted from Rodieck, 1998, with corrections byR.W. Rodieck.)219
THE SCIENCE OF COLORConesBipolar andAmacrine CellsFovealCenterGanglion CellsFigure 6.3 Vertical section through the human fovea, showing the elongation of the cones, and the absence ofthe other neurons, which lie outside the center of the fovea and to which the cones are connected through longfibers. (Photograph courtesy of Anita Hendrickson.)of horizontal sections of retina – sometimeswhole-mounted retinas – in which one can viewthe retina in the plane of the image, and whichreveal the pattern and spread of a neuron’sdendritic field.It is now clear that the primate retina containsseveral kinds of bipolar cells, several kinds ofhorizontal cells, several kinds of ganglion cells,and perhaps many kinds of amacrine cells. Wewill consider some of these in detail later, but forthe moment the important idea is that the existence of several types among each major class ofcell suggests the retina forms multiple representations of the image. This idea draws clear support from an examination of ganglion cells,whose axons form the optic nerve. Anatomicalclasses of ganglion cells are characterized principally by the pattern, horizontal extent, anddepth of branching of their dendritic fields. Thecharacteristic dimensions vary, of course, withposition on the retina, but at any one spot cellsof different classes can be robustly distinguished.Ganglion cells of the different classes form quasiregular mosaics of sampling elements, each ofwhich conveys a (presumably) different representation of the image to the brain. These different arrays project differently into the brain. Theirrelevance to color vision stems from the fact thatdifferent classes of ganglion cells are connectedin different ways to the cone photoreceptors.In the primate retina there are two major andseveral minor classes of ganglion cells. The two220major classes, now widely known as P cells andM cells,1 together constitute about 90% of the1.25 million ganglion cells in each eye. P cellsalone probably constitute 80% of all ganglioncells. The most distinctive anatomical differencebetween them is size: at any one eccentricity theP cells have much smaller cell bodies, smallerdendritic fields, and smaller axons. P and M cellsare connected to cones through different kindsof bipolar cells (they both also make indirectconnections with rods, but these are not relevanthere). In and near the fovea each P cell contactsa single midget bipolar cell, which in turn contactsa single cone (Wässle and Boycott, 1991). In thefovea, there are two midget ganglion cells andtwo midget bipolar cells for every cone. Eachcone drives two midget bipolar cells, which inturn drive two P cells. These dual contacts madeby a single cone seem to be the origin of distinctpathways, for the two midget bipolar cells areanatomically different, and they in turn contacttheir counterpart P cells in different planes in theretina. As we shall see, these pathways have different physiological properties. There are corresponding pathways feeding two kinds of M cells.Each M cell contacts a single diffuse bipolar cell,which in turn contacts several cones. Other,rarer, kinds of ganglion cells are clearly distinguished anatomically (Rodieck et al., 1993), butexcept for a bistratified cell that is associatedwith signals from S cones (Dacey and Lee, 1994),little is known about their function, and their
THE PHYSIOLOGY OF COLOR VISION central projections, discussed below, suggest thatmost have no substantial role in color vision.The horizontal pathways in the retina, represented by horizontal cells and (to some extent)amacrine cells, seem to be organized to permitthe infusion of remote signals into the direct vertical pathways. Horizontal cells, of which thereare at least two types, make connections directlywith cones at their junctions with bipolar cells,and near the fovea each horizontal cell makescontact with most of the cones that lie in its dendritic field (Wässle et al., 1989; Ahnelt and Kolb,1994). Amacrine cells exist in many more discernible forms than do other retinal neurons.Some have an identified special role in thetransmission of rod signals from bipolar cells toganglion cells, but beyond some involvement inshaping the responses of ganglion cells, the rolesof most are unclear.6.1.1.2 Central projectionsGanglion cells project to several centers in thebrain, notably the superior colliculus (SC) in themidbrain and the lateral geniculate nucleus(LGN) in the thalamus (Figure 6.4). Each opticnerve branches at the optic chiasm, and approximately half of the nerve fibers (representingganglion cells in the nasal retina) cross to theother hemisphere. The representation of theretinal image is split vertically through the fovea,each half being represented in one hemisphere.The peculiarity of the projection results in theleft visual field being represented in the righthemisphere, and vice-versa. This brings the representation of visual space broadly into registerwith the representations provided by othersenses, which are all crossed.The SC is phylogenetically older, and is themore important center in lower mammals; inprimates it receives inputs from only a smallfraction of the retinal ganglion cells. These cellsare of the rarer types found in the retina (i.e.,neither P nor M cells). The SC has clear roles indirecting eye movements and in intersensorylocalization (Sparks and Nelson, 1987), but allthat we know about it, including the physiology of neurons in it, suggests that it has noconsequential role in color vision.The LGN in primates is a highly developed,laminated, structure to which the retinal P cellsand M cells project. The prototypical LGN in theeonocotlgborstrFigure 6.4 Major visual centers in the brain.Theoptic nerve (ON) from each eye (E) divides at theoptic chiasm (OC), sending half its fibers into the optictract (OT) of each hemisphere, which projects to thelateral geniculate nucleus (LGB).The lateralgeniculate nucleus in turn projects to the striatecortex (STR).The projection into each hemisphereoriginates in the half-retina on that side of the head.(From Polyak, 1957.)primate has six layers, organized in two distinctgroups (Figure 6.5).The four dorsal, parvocellular, layers receiveinputs from the retinal P cells, with those fromthe left and right eyes being interleaved. The twoventral, magnocellular, layers receive inputs fromthe M cells, separately from each eye. There areno discernible connections among layers, andphysiological evidence suggests no function connections. The topography of the retinal image ispreserved on the LGN, each layer of which contains an orderly though distorted map. The distortions in the map are broadly consistent witheach projecting ganglion cell occupying a fixedterritory in the LGN, so that the representationof the central visual field is large – a conveniencefor physiologists.6.1.1.3 Visual cortexNeurons in the LGN project to striate cortex (alsoknown as primary visual cortex or V1), an anatomically distinctive cortical region in the occipital221
THE SCIENCE OF COLORFigure 6.5 Section through the lateral geniculatenucleus (LGN), showing its laminated structure.The prototypical LGN has six layers – four dorsal(parvocellular) layers and two ventral (magnocellular)layers – though this arrangement is not alwayspresent.The magnocellular layers are thinner andcontain larger cells.The LGN contains a topographicalmap of the half of the retina that projects to it.The arrows in this figure mark the path of amicroelectrode that recorded the discharges ofindividual neurons. (From Wiesel and Hubel, 1966.)lobe, at the back of the brain. The cortex as awhole is a large, thin ( 2 mm) sheet containingseveral clearly defined layers of neurons, and inthe human brain (and to a lesser extent themonkey brain) is deeply folded to fit into thecranial cavity. Cortex is functionally specialized,but, with a few exceptions, its structure provideslittle evidence of this and almost everywhere issimilar anatomically. Figure 6.6 shows the majorlaminar subdivisions of striate cortex. It differsfrom cortex elsewhere in the brain by having amuch thicker layer 4, to which the incomingfibers from the LGN project.The general organization of cortex is as follows:inputs from lower levels of the visual pathwayarrive in layer 4, ascending outputs to higherlevels of the pathway arise in the upper layers(above layer 4), and descending (feedback) outputs to lower levels arise in the lower layers(below layer 4).The anatomical distinctiveness of striate cortex(the thick layer 4 produces a texture visible tothe naked eye) makes it relatively easy to discover that in each hemisphere it contains a222single map of the left or right half of the visualfield. As would be expected from the topographyof the earlier map in the LGN, this contains alarge representation of the central visual fieldand a progressively reduced representation ofthe peripheral field. Beyond this cortex lies agreat deal more that is intimately coupled tovision. Because it is not structurally distinctive,its organization has been less easy to discern, butmodern work, using both anatomical and physiological methods, shows unequivocally that itcontains multiple maps of the visual field. Thesemaps (at least twenty-two have now been identified) cover the whole of the occipital lobe of thebrain, and substantial parts of the temporal andparietal lobes. The fraction of the brain theyoccupy, and their general arrangement, are mosteasily seen in representations that unfold thecortex and lay it flat. Figure 6.7 (Felleman andVan Essen, 1991) shows this done for themacaque monkey, and makes clear how large afraction (around 50%) of cortex is devoted tovisual analysis. In the human brain the fractionis considerably smaller, perhaps around 15%.By tracing the connections among visualareas, and knowing from which layers in cortexthese connections originate and to which layersthey project, it becomes possible to discover ahierarchical structure that can accommodate,somewhat loosely, all the areas (Figure 6.8). Thishierarchy has its origin in striate cortex, ascendsthrough the second visual area, V2, and then onthrough perhaps seven further levels. BeyondV2 each level contains more than one area, sothe general picture that emerges is one of multiple parallel streams organized hierarchically.The parallel organization of cortical streamsreflects to some degree, but by no means fully,the parallel organization of signals conveyed bythe M and P pathways through the LGN. The Mand P cells project to different subdivisions oflayer 4, and these in turn project to other layerswithin striate cortex. The separate identities ofthe pathways are generally not well-preservedbeyond this level, although a small but distinctive projection that appears to be dominated bysignals from the M pathway has been tracedfrom striate cortex to an extrastriate regionknown as the middle temporal area (MT).Within the collection of extrastriate corticalareas concerned with vision, there appears to be
THE PHYSIOLOGY OF COLOR VISION 12/34A4B4Ca4Cb56Figure 6.6 The arrangement of layers in striate cortex, revealed by two stains that highlight different aspectsof the organization. (Right) A stain that reveals the locations of the cell bodies of neurons. (Left) A stain for theenzyme cytochrome oxidase, which labels densely the input layers in the middle of cortex, and also shows the‘blobs’ in layer 2/3 that are a distinctive feature of the upper layers.a broad division into two groups. One contains aset of heirarchically connected areas that form aconduit from striate cortex, through area V2,into the parietal lobe of the brain. The other contains a set of areas that carry information fromstriate to the temporal lobe. Experimental andclinical studies of parietal cortex show it to haveimportant roles in spatial orientation and visuallocalization, and perhaps also with the analysisof self-movement, but there are no indicationsthat it is important for color vision. Temporalcortex is for object vision, and damage to it, or tothe visual areas that lead to it, can bring aboutprofound disruption of various aspects of objectvision, including color vision.6.1.2 EXPLORING FUNCTIONSome useful inferences about function can bedrawn from our knowledge of the structure ofthe visual pathway (for example, one can inferthat P cells are probably important for visualacuity), but a great deal more can be learned byexamining activity in the nervous system.Physiologists have available to them a powerfularmament of methods. For the purposes ofunderstanding mechanisms of color vision, andparticularly how these give rise to perceptualphenomena, most of the activity we need to pursue occurs on a time scale of tens of msec, andon a spatial scale that involves groups of neurons. The following paragraphs review brieflysome of the more important methods that arerelevant to exploration on these scales, and outline their strengths and weaknesses.6.1.2.1 Recording signals fromindividual neuronsWithin an individual neuron signals are propagated electrically, and between neurons, chemically, via neurotransmitters. In their resting statesmost neurons maintain a steady potential difference of 60 mv across the cell membrane. Areduction in this potential difference (depolarization) constitutes the neural signal. The membrane potential is controlled by neurochemicalevents at the synapses (junctions) between thecell and those from which it receives signals. Aneuron receives most of its synaptic connectionson its dendrites and soma (Figure 6.9).Each neuron receives thousands of synapticconnections from other neurons, and eachsynapse, when active, gives rise to a brief event,a postsynaptic potential, that tends either to excite(depolarize) or inhibit (hyperpolarize) the neuron. The aggregate weight of the postsynaptic223
THE SCIENCE OF COLORFigure 6.7 Diagram of the cortex unfolded from one hemisphere of the monkey, showing identified visualareas.The areas that are colored are recognized as being visual sensory areas, or areas closely associated withthem.V1 is the primary visual (striate) cortex, which receives input from the lateral geniculate nucleus.V1projects principally to area V2. Many of these visual areas contain topographically organized maps of the half ofthe retina that sends a projection to the hemisphere.Visual areas constitute about half of the monkey’s cortex.Corresponding areas in the human cortex undoubtedly account for a smaller fraction of the total. (FromFelleman and Van Essen, 1991.)potentials within a certain integration time (andover a certain integration distance) determinesthe resulting change in the membrane potentialof the cell. In most neurons, if the cell becomessufficiently depolarized (taking the membranepotential from perhaps 60 mv to 50 mv) a largeimpulsive depolarization (action potential) is triggered and propagated rapidly along the membrane. When this action potential reaches theaxon terminals, it causes the release of neurotransmitter at synapses making contact withother neurons. Activity at the synaptic connec224tions between cells thus controls the propagation and transformation of signals in the nervoussystem.The impulsive nature of most neural communication permits signals to be transmitted rapidlyand reliably (within broad limits the existence ofan action potential is the important event, ratherthan its size), and almost all neurons propagatesignals via action potentials. A drawback, however, is that the dynamic range of a neuron islimited (the rates at which action potentials aredischarged vary from a few per second to, at most,
THE PHYSIOLOGY OF COLOR VISION Figure 6.8 Diagram showing the hierarchical organization of visual cortical areas and the known connectionsamong them.The areas at the highest level are at the top.The hierarchy is inferred from the polarities of theconnections between areas. Each element in the diagram corresponds to an area identified in Figure 6.7. (FromFelleman and Van Essen, 1991.)a few hundred per second). In rarer kinds ofneurons, found particularly in sensory systems,the changes in membrane potential induced bysynaptic events are propagated passively alongthe membrane, as relatively slowly changingpotentials. This mechanism of transmission is225
THE SCIENCE OF COLORPyramidal CellBipolar CellDendritesDendritesAxonDendritesAxonFigure 6.9 Diagram of the general structure ofneurons, and their specializations. (Left) Bipolar cell inthe retina. (Right) Pyramidal cell in cortex.Theneuron accumulates signals from other cells mostlythrough synaptic connections on its dendrites.Theaction potential usually originates at the junction ofthe cell body and axon, and is propagated down theaxon to the axon terminal system where it causes therelease of neurotransmitter at synapses. (Adaptedfrom Kuffler and Nichols, 1976.)used by all retinal neurons except ganglion cells.It provides neurons with a larger dynamic rangethan would be possible were action potentialsused, but at the cost of slower and less reliablesignal transmission over distances.In many parts of the nervous system individual neurons are large enough to withstand penetration by a microelectrode that can record the226potential difference across the membrane. Evenwhere this is not the case microelectrodes that sitjust outside the membrane can record (extracellularly) the local electrical disturbance producedby an action potential, though not any slowpotentials. Intracellular methods are usuallymost practicable in vitro, when the neurons arenot subject to movement by the pulse and othersmall body movements, but extracellular methods are much more robust, and can record signals from individual neurons in moving animals.The small size of neurons in the primate retinamakes it exceptionally difficult to record theiractivity with intracellular electrodes. Some special techniques have been developed for studying the signals generated by photoreceptors (seethe next section), but apart from photoreceptorsonly ganglion cells have been studied exhaustively in primates, because they generate actionpotentials that can be recorded with extracellular electrodes. Much of what we know directlyabout the function of other retinal neurons hasbeen learned through studying reptiles and fish,in which cells are much larger. Elsewhere in theprimate’s visual system, extracellular recordingsprovide valuable information about the characteristics of individual neurons.6.1.2.2 Recording larger scaleelectrical activityGross electrical activity evoked by light can berecorded from several places in the nervous system. The electroretinogram (ERG) is a compositesignal that can be recorded either with electrodesplaced on the retina, or with surface electrodeson the intact eye. Elements of the compositelight-evoked signal can be attributed to differentstages of signal analysis in the nervous system.The ERG has been particularly helpful in theanalysis of signals generated by photoreceptors.Gross electrical signals evoked by visual stimuli can be recorded with electrodes placed on thescalp, or on the surface of the cortex. Althoughlarge signals can be evoked by time-varyingchanges in color, they are often difficult to interpret, because the source of the signals is hard tolocalize.6.1.2.3 Direct imaging of activityActive neurons consume more oxygen thaninactive ones, and as a result provoke local
THE PHYSIOLOGY OF COLOR VISION increase in the circulation of blood. Severalrecently developed techniques can record thesestimulus-induced local changes in the circulation, and have been exploited in attempts toreveal cortical structures that might be involvedin the analysis of color. In cortex that can beviewed directly following removal of the skull,one can record changes in the composition oflight reflected from the cortical surface to produce a map that shows local regional specialization (Roe and Ts’o, 1995). Positron emissiontomography can be used to measure localchanges in circulation in the human brain, andhas been used to identify regions that areengaged in the analysis of color. The attraction ofthis method, and similar methods that exploitmagnetic resonance imaging (Engel et al., 1997),is that they reveal activity on a scale of millimeters. The drawback is that they measurechanges in circulation occurring on a time scaleof seconds.of 30–50 pA. This arises from the flow of Na ions through the permeable membrane of theouter segment, and a flow of K ions out of theinner segment. The current is maintained bypumps in the inner segment that drive Na ions out and K ions in. During illumination,the Na permeability of the outer-segmentmembrane is reduced, and the current flowcorrespondingly reduced, resulting in hyperpolarization of the membrane. These lightinduced changes in outer-segment membraneconductance result from a recently discoveredcascade of biochemical events inside the outersegment (Pugh and Lamb, 1993; Torre et al.,1995). In darkness, the photoreceptors releaseneurotransmitter continuously from their terminals, which contact bipolar cells and horizontalcells. The absorption of light and consequenthyperpolarization of the cell reduces the amountof transmitter released.6.2.2 VISUAL PROPERTIES6.2 PHOTORECEPTORS6.2.1 RECEPTOR SIGNALSMany of the important steps in the transductionof light to electrical signals in the nervous systemare now understood, and have been clearlydescribed (see, for example, Baylor 1987; Torreet al., 1995). The general functional principlesare the same in rods and cones, although thereare important differences of detail betweenthem, notably in the speed of responses, and intheir time-courses. In the dark the receptormaintains a steady potential of 40 mv acrossits membrane. When the receptor is illuminated,the potential becomes hyperpolarized to asmuch as 70 mv. This hyperpolarization by aneffective stimulus makes photoreceptors uniqueamong vertebrate neurons, which normally become depolarized when excited. Primate conesare too small to accommodate microelectrodesthat can measure change in membrane potential, but Baylor and colleagues (Schnapf et al.,1990) have characterized the electrical responsesin vitro by drawing the outer segment of a coneinto a micropipette and measuring the currentflow through the outer segment. In darkness,there is a steady inward current (the dark current)Figure 6.10 shows the change in current flowing through the outer segment of a singlemonkey cone induced by a series of brief flashesof progressively increased intensity, at threewavelengths.Several important principles can be inferred.First, over a substantial range of progressivelyincreasing flash intensities, the cone’s responseshave exactly the same shape, and can be superimposed if scaled by the flash intensity. Thislinear relationship between light intensity andresponse breaks down at high flash intensities,where the responses saturate. Second, the conesgenerate sets of responses of identical shaperegardless of the wavelength of light that excitesthem – they are univariant. Third, the responsesare biphasic, and last considerably longer thanthe flash.6.2.2.1 Spectral sensitivityGiven the univariance of a cone, demonstratedvery clearly by Baylor et al. (1987), its spectralsensitivity can be readily measured by finding, ateach of several wavelengths, the flash intensityrequired to evoke a response of a specified size.Figure 6.11 shows the result of essentially thiskind of measurement made on a sample of conesfrom the macaque retina (Baylor et al., 1987).227
THE SCIENCE OF COLOR0 1Red20 pAGreenLog relative sensitivity30 pA 2 3 4 5 610 pABlue400500600700 800 900Wavelength (nm)Figure 6.11 Spectral sensitivities of cones in theretina of the macaque monkey. From left to right thecurves show the averaged spectral sensitivities ofsmall samples of S, M, and L cones. (From Baylor et al.,1987.)00.20.4 sFigure 6.10 Current flow induced in the outersegment of the three kinds of primate cones. Eachset of traces shows the responses to brief flashes(identified by the pulse at bottom) at a series ofintensities stepped by factors of 2.The responses oflow and middle amplitudes would be superimposed ifscaled by the fla
In the primate retina there are two major and several minor classes of ganglion cells. The two major classes, now widely known as P cells and M cells,1 together constitute about 90% of the 1.25 million ganglion cells in each eye. P cells alone probably constitute 80% of all ganglion cells. The most distinctive anatomical difference