Transcription
Number 37 n March 24, 2011Hospital Preparedness for Emergency Response:United States, 2008Richard W. Niska, M.D., M.P.H.; and Iris M. Shimizu, Ph.D.AbstractIntroductionObjective—This report is a summary of hospital preparedness for respondingto public health emergencies, including mass casualties and epidemics ofnaturally occurring diseases such as influenza.Methods—Data are from an emergency response preparedness supplement tothe 2008 National Hospital Ambulatory Medical Care Survey, which uses anational probability sample of nonfederal general and short-stay hospitals in theUnited States. Sample data were weighted to produce national estimates.Following the World Trade Centerattack of September 2001 and theanthrax terrorism incident of October2001, there has been a heightenedinterest in using surveys to assess ourreadiness for various disasters.Therefore, the U.S. Department ofHealth and Human Services, Office ofthe Assistant Secretary for Planning andEvaluation (ASPE), provided funding tothe National Center for Health Statistics(NCHS) to survey hospitals aboutpreparedness for treating patients frombioterrorism attacks or mass casualtyincidents. Bioterrorism and MassCasualty Preparedness Supplementswere added to the 2003 and 2004National Hospital Ambulatory MedicalCare Surveys (NHAMCS). Apreliminary report on hospitalpreparedness for bioterrorism or othermass casualties showed that hospitalswere prepared in 2003 in most of theareas studied (1). Other morecomprehensive publications coveringboth years followed (2–4).In subsequent years, the nationalfocus shifted from bioterrorism topreparation for natural disasters such asHurricane Katrina and major influenzaoutbreaks. In 2004, an outbreak ofH5N1 avian influenza was reported inKey results Nearly all hospitals had response plans for chemical releases, natural disasters,epidemics, and biological incidents. Preparedness for explosive or incendiaryincidents was less frequent than preparedness for other types of incidents. While most hospitals had plans for cancellation of elective procedures andadmissions, two-thirds had plans for alternate care areas with beds, staffing, andequipment. One-half of hospitals planned for alternate care areas in inpatient hallways ordecommissioned ward space, or for conversion of inpatient units to augmentintensive care. One-half of hospitals had adjusted standards of care for allocation of mechanicalventilators for mass casualties. Although over one-half of hospitals had staged epidemic drills, only one-thirdincluded mass vaccination or medication distribution. One-half of hospitals planned for advance registration of health careprofessionals. While most hospitals had memoranda of understanding (MOUs) with otherhospitals to transfer adults during an epidemic, fewer hospitals had MOUs forpediatrics and burns. Less than one-half of hospitals accommodated the needs ofchildren and persons with disabilities during a public health emergency.Keywords: Emergency preparedness hospital preparedness mass casualty pandemicU.S. DEPARTMENT OF HEALTH AND HUMAN SERVICESCenters for Disease Control and PreventionNational Center for Health Statistics
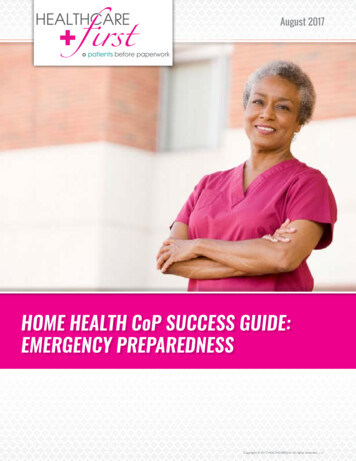
Page 2poultry in nine eastern Asian countries,which was genetically related to 52 fatalhuman cases reported by early 2005 (5).By the end of 2008, H5N1 avianinfluenza had been responsible for 248human deaths in 15 countries in Asiaand Africa, and had been reported inboth domestic and wild birds in Europeas well (6,7). Although no avian orhuman H5N1 cases have been reportedin the Americas, there is public concernthat this virus or others could result inoutbreaks or even pandemics in thefuture. In response to this concern,ASPE provided funds for NCHS tosurvey hospitals on their preparednessfor mass casualty events includingpandemics.This report serves as a descriptivesummary of hospital preparedness fordealing with naturally occurringdiseases, epidemics and pandemics suchas influenza, and other public healthemergencies. Information aboutemergency preparedness in U.S.hospitals is crucial for those who arecharged with planning how to preventand treat large outbreaks of infectiousdisease and other mass casualty events.MethodsNHAMCS is a national annualsurvey of ambulatory medical care visitsto noninstitutional, nonfederal, acutecare, and short-stay hospitals. Short-stayhospitals are those with an averagelength of stay of less than 30 days,whereas acute care hospitals are thosewhose specialty is general (medical orsurgical) or children’s general.NHAMCS uses a multistage probabilitysampling design involving samples ofgeographic primary sampling units andhospitals with emergency departments(ED) or outpatient departments withinthose units. The data are weighted usingthe inverse probabilities of hospitalselection with an adjustment fornonresponse. Therefore, estimates areconsidered representative of hospitalsthroughout the United States.In 2008, emergency preparednessitems were added to NHAMCS in aspecial supplement. Many of the itemson the 2003–2004 surveys wereretained, but the 2008 instrument wasNational Health Statistics Reports n Number 37 n March 24, 2011greatly expanded to include newquestions arising from research findingsas well as those suggested by outsideprofessional organizations. This reportfocuses on new content added to the2008 survey. A future report will discusstrends between 2003–2004 and 2008 foritems that were retained from the earliersurveys.NHAMCS is administered on-site ateach participating hospital by fieldrepresentatives employed by the U.S.Census Bureau under an interagencyagreement with NCHS. The pandemicsupplement was an eight-page selfadministered questionnaire consisting of112 total data items. It was completedfor each sample hospital by the personresponsible for the hospital’s emergencyresponse plan. The supplement wasreturned to the U.S. Census Bureau’sNational Processing Center (NPC) withthe NHAMCS core materials. NPCperformed the quality control edits anddata entry, and provided NCHS withmonthly updates and a final cumulativeSAS file.A descriptive analysis wasconducted by NCHS using a first-orderTaylor series approximation method asapplied in SUDAAN-9.0.1 to accountfor the complex survey design (8).Because all continuous variables hadpositively skewed distributions, thecentral tendency was reported as themedian.The determination of statisticalsignificance was based on the two-tailedt-test. The Bonferroni inequality wasused to establish the critical value forstatistically significant differences (0.05level of significance) based on thenumber of possible comparisons withina particular variable (or combination ofvariables) of interest. Terms relating todifferences such as ‘‘more’’ or ‘‘fewer’’indicate that the difference isstatistically significant. Terms such as‘‘not different’’ or ‘‘similar’’ indicatethat the difference is not statisticallysignificant. A lack of comment on aparticular difference does not implyanything about statistical significance.ResultsOf the sample of 395 in-scopehospitals from the 2008 NHAMCS, 294hospitals responded to the supplement(response rate of 74.4 percentunweighted and 78.1 percent weighted),representing the national weighteduniverse of 5,212 hospitals.Emergency response plans All hospitals had an emergencyresponse plan for at least one of thesix hazards studied (epidemic pandemic, biological, chemical,nuclear-radiological, explosiveincendiary, and natural incidents)(Table 1, Figure 1). Nearly all hospitals (99.0 percent) hademergency response plans thatspecifically addressed chemicalaccidents or attacks, which were notsignificantly different from theprevalence of plans for naturaldisasters (97.8 percent), epidemics orpandemics (94.1 percent), andbiological accidents or attacks(93.2 percent). Significantly fewer hospitals(81.3 percent) had plans for nuclearor radiological accidents or attacksthan for chemical accidents or attacksand natural disasters. Significantly fewer hospitals(79.6 percent) had plans for explosiveor incendiary accidents or attacksthan for chemical accidents orattacks, natural disasters, epidemicsor pandemics, and biologicalaccidents or attacks. About 67.9 percent of hospitals hadplans for all six hazards.Cooperative planning About 99.6 percent of hospitalsengaged in cooperative planning withat least one of the eight entitiesstudied (Table 2). About 93.7 percent of hospitalsengaged in cooperative planning indeveloping or updating an emergencyresponse plan for public healthemergencies with the state or localoffice of emergency management; thiswas not significantly different fromthe prevalences for planning withother hospitals (92.7 percent),emergency medical services (EMS)(89.0 percent), state or local public
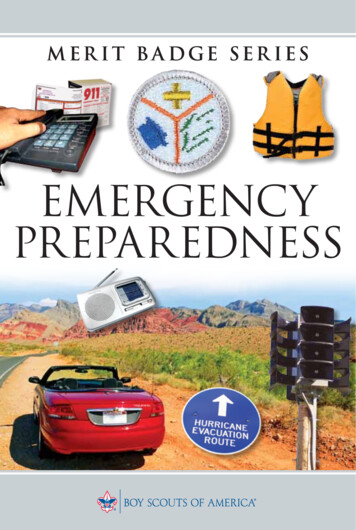
National Health Statistics Reports n Number 37 n March 24, 201195% confidence 0ChemicalNaturalEpidemicBiologicalIncident typeNUC–RAD¹ EXP–INC²¹NUC–RAD is nuclear-radiological. Significantly different from chemical and natural incidents (both p 0.05).²EXP–INC is explosive-incendiary. Significantly different from chemical, natural, epidemic, and biological incidents(all p 0.05).SOURCE: CDC/NCHS, National Hospital Ambulatory Medical Care Survey, 2008.Figure 1. Percentage of hospitals with emergency response plans for selected types ofincidents: United States, 2008health departments (88.7 percent), orfire departments (86.0 percent). Significantly fewer hospitals includedhazardous materials teams(64.3 percent) or the Federal Bureauof Investigation (19.0 percent) in theiremergency response planning than theother six entities listed above. About 18.7 percent of hospitalsincluded all eight entities in theiremergency response planning.Plans for components ofhospital preparednessTable 3 summarizes responses to aseries of questions about writtenemergency response plans for 48components of preparedness for hospitalovercrowding incidents or public healthemergencies, and whether the planswere implemented in an actual incidentduring 2007. Broad categories ofhospital preparedness includedmemoranda of understanding (MOUs)with other hospitals, regionalcommunication systems, mutual aidagreements, expansion of on-site surgecapacity, priority setting for limitedresources, expansion of on-site healthcare work force, mass casualtymanagement, management of pediatricand other special populations, andcommunication strategies.MOUs with other hospitals About 87.8 percent of hospitals hadMOUs with one or more hospitals toaccept adult patients, but only56.2 percent had MOUs with one ormore children’s hospitals to acceptpediatric patients in transfer fromtheir own ED when no beds wereavailable at the hospital. Only 8.6 percent of hospitals hadimplemented adult transfer MOUs,and 8.0 percent had implementedpediatric transfer MOUs during actualincidents in 2007. Only about one-half of hospitals hadMOUs with burn centers to acceptexplosive-incendiary mass casualties(56.9 percent), or with otheroutpatient facilities to augmentoutpatient services (42.8 percent).Regional communication systems About 85.3 percent of hospitals hadregional communication systems totrack ED closures or diversions.About 29.2 percent implementedthese systems during an actualincident in 2007. About 80.6 percent of hospitals hadregional communication systems totrack available adult intensive careunit (ICU) beds, 70.1 percent trackedpediatric ICU beds, and 64.8 percenttracked neonatal ICU beds. About22.6 percent implemented adult ICUPage 3tracking systems, 16.9 percentimplemented pediatric ICU trackingsystems, and 14.1 percentimplemented neonatal ICU trackingsystems during an actual incident in2007. Most hospitals had regionalcommunication systems to trackavailable adult (89.7 percent),pediatric (82.0 percent), and neonatal(67.8 percent) hospital beds. Aboutone-quarter implemented adult(30.4 percent), pediatric(23.7 percent), or neonatal(18.9 percent) bed tracking systemsduring an actual incident in 2007. Only 51.9 percent of hospitals hadregional communication systems totrack specialty coverage. About15.1 percent implemented this systemin 2007.Mutual aid agreements About 84.1 percent of hospitals hadmutual aid agreements with otheragencies to share supplies andequipment. About 16.3 percentimplemented these agreements in2007.Expansion of on-site surgecapacity About 90.5 percent of hospitals hadplans for isolation of airborne diseasepatients in negative pressure rooms.About 14.2 percent implementedthese plans in 2007 (Table 3,Figure 2). About 86.3 percent of hospitals hadplans for cancellation of electiveprocedures and admissions. About12.9 percent implemented these plansin 2007. About 73.7 percent of hospitals hadplans for setting up temporaryfacilities when the hospital isunusable (e.g., without power orflooded). Many hospitals had plans forestablishment of alternate care areaswith beds, staffing, and equipment innonclinical space (68.7 percent),inpatient unit hallways (52.3 percent),or decommissioned ward space(49.7 percent).
National Health Statistics Reports n Number 37 n March 24, 2011Page 4Special populations95% confidence rd nentSOURCE: CDC/NCHS, National Hospital Ambulatory Medical Care Survey, 2008.Figure 2. Percentage of hospitals with plans for selected components of onsite surgecapacity expansion: United States, 2008 Only 50.7 percent of hospitals hadplans for conversion of inpatient unitsto augment intensive care capacity.Priority setting for limitedresources About 72.4 percent of hospitals hadwritten triage processes for limitedintensive care resources (Table 3). About 64.0 percent of hospitals hadplans for regional coordination ofadjusted standards of care during apandemic or other mass casualtyincident. About 43.2 percent of hospitals hadplans for implementing adjustedstandards of care for initiation andwithdrawal of mechanical ventilation. About 32.9 percent of hospitals hadplans for delivery of potassium iodidein response to radioactive release.Expanding on-site health carework force About 88.8 percent of hospitals had aplan for continuity of operations inthe event of an emergency. About14.9 percent implemented this planduring an actual incident in 2007. About 6 of 10 hospitals had mutualaid agreements with other agencies toshare health care providers(69.5 percent), or plans for advanceregistration of volunteer healthprofessionals (55.9 percent). About 6 of 10 hospitals had plans forstaff absenteeism due to personal orfamily impact from the emergency(66.9 percent), or on-site child care tomaintain staff at the hospital(63.1 percent).Mass casualty management About 94.6 percent of hospitals hadplans for hospital evacuations. Most hospitals had plans fortransporting large numbers of patientswithin the hospital (83.9 percent) orbetween hospitals (77.0 percent). Only 62.6 percent of hospitals hadplans for an on-site large capacitymorgue.Pediatrics About 42.6 percent of hospitals had atracking system for accompanied andunaccompanied children. About 34.0 percent of hospitals hadplans for reunification of childrenwith families, and 31.1 percent forprotocols to identify and protectdisplaced children. About 32.4 percent of hospitals hadguidelines for increasing pediatricsurge capacity. About 29.4 percent of hospitals hadplans for acquiring supplies to shelterhealthy displaced children. About 73.3 percent of hospitals hadplans for communicating withnon-English-speaking patients. About15.4 percent implemented those plansduring an actual incident in 2007. Only about one-half of hospitals hadplans for communicating with deaf(58.3 percent) or blind (47.5 percent)patients. About 47.6 percent of hospitals hadplans for sheltering mobility-impairedpatients. About 46.7 percent of hospitals hadplans for sheltering patients withspecial health care needs. About42.0 percent implemented these plansduring an actual incident in 2007. Only about one-third of hospitals hadplans for sheltering pregnant women(39.2 percent), mentally challenged(39.0 percent), or technologydependent (33.7 percent) patients.Communications About 93.4 percent of hospitals hadplans for receiving notification ofalerts from the state or local healthdepartment. About 34.5 percentimplemented these plans during anactual incident in 2007. About 79.4 percent of hospitals hadplans for participating with localpublic health departments in publiceducation about the importance ofinfluenza vaccination. About29.5 percent implemented these plansduring an actual incident in 2007.Internal mass casualty drills,simulations, or exercises In the last year, one-half(50.6 percent) of hospitals conductedmore than one internal drill;31.9 percent conducted only oneinternal drill; 11.1 percent conductedno internal drills; and the number ofinternal drills was unknown for6.4 percent (Tables 4 and 5). For those hospitals in which thenumber of drills was known, themedian number of internal full-scalesimulations conducted was one. The median number of adult victimsutilized in each hospital’s largestinternal drill was 15.
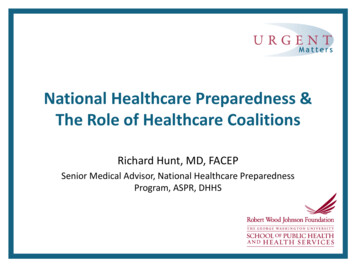
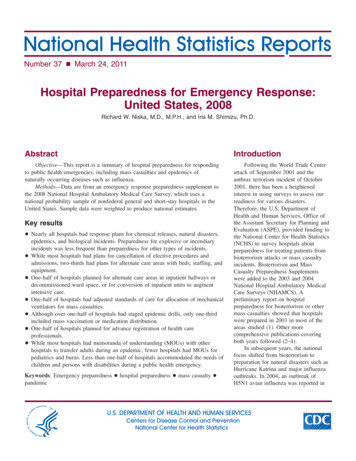
National Health Statistics Reports n Number 37 n March 24, 201195% confidence interval7060Percent50403058.52032.51022.50Severe epidemicsMass vaccinations¹Community massmedication¹Scenario type¹Significantly different from severe epidemic drill scenarios (both p 0.05).SOURCE: CDC/NCHS, National Hospital Ambulatory Medical Care Survey, 2008.Figure 3. Percentage of hospitals participating in selected mass casualty drill scenariotypes: United States, 2008 The median length of each hospital’slongest internal drill was 4.0 hours. The median number of table-topexercises conducted in the last yearby a hospital was one.External mass casualtydrills, simulations, orexercises In the last year, 28.4 percent ofhospitals conducted more than oneexternal drill (i.e., in collaborationwith other organizations);53.6 percent conducted only oneexternal drill; 11.5 percent conductedno external drills; and the number ofexternal drills was unknown for6.5 percent of hospitals (Tables 4 and5). For those hospitals in which thenumber of drills was known, themedian number of full-scalesimulations conducted incollaboration with other organizations(law enforcement, health department,emergency management, firedepartment, EMS, hazardousmaterials teams, or decontaminationteams) was one. The median number of adult victimsutilized in each hospital’s largestexternal drill was 16. The median length of each hospital’slongest external drill was 4.0 hours. The median number of table-topexercises hospitals conducted incollaboration with other organizationswas 0.5.Types of scenarios in masscasualty drills About 88.2 percent of hospitalsaddressed general disaster andemergency response in their drills,significantly more than any other typeof scenario studied (Table 6). About the same percentages ofhospitals addressed decontaminationprocedures (69.6 percent), severeepidemics or pandemics(58.5 percent), and chemical accidentsor attacks (55.6 percent) in theirdrills. Compared with hospitals stagingdecontamination scenarios,significantly fewer hospitals(42.5 percent) focused on acutedecontamination of aerosol exposuresfrom biological accidents or attacks. Compared with hospitals stagingsevere epidemic scenarios, about thesame percentage (39.1 percent)focused on delayed disease outbreakmanagement for biological accidentsor attacks. However, significantlyfewer hospitals addressed massvaccinations (32.5 percent), massmedication distribution to hospitalpersonnel (30.6 percent), or massmedication distribution to thecommunity (22.5 percent) (Figure 3).Page 5 For mass medication distribution,statistically similar percentages ofhospitals focused on hospitalpersonnel and the community. In their drills on biological accidentsor attacks, statistically similarpercentages of hospitals focused onacute decontamination of aerosolexposures and delayed diseaseoutbreak management. About 32.4 percent of hospitalsaddressed explosive or incendiaryaccidents or attacks in their drills,significantly fewer than scenarios forgeneral disasters, decontamination,epidemics, or chemical attacks, butstatistically similar to scenarios foracute decontamination of biologicalaerosol exposures and delayed diseaseoutbreak management for biologicalattacks. About 18.7 percent of hospitalsaddressed nuclear or radiologicalaccidents or attacks in their drills,significantly fewer than scenarios forgeneral disasters, decontamination,epidemics, chemical attacks, or acutedecontamination of biological aerosolexposures, but statistically similar toscenarios for delayed diseaseoutbreak management for biologicalattacks and explosions. Statistically similar percentages ofhospitals addressed children(44.6 percent) and the frail elderly(36.2 percent) in their drills. But only17.1 percent addressed mentallychallenged individuals in their drills,significantly less than children or thefrail elderly.Collaboration with outsideorganizations on masscasualty drills Statistically similar percentages ofhospitals performed drills,simulations, or exercises with state orlocal offices of emergencymanagement (85.8 percent), state orlocal law enforcement (81.5 percent),state or local public healthdepartments (81.3 percent), firedepartments (79.7 percent), and firedepartment-based EMS (72.1 percent)(Table 7).
Page 6 About 69.7 percent of hospitalsperformed drills with EMS not basedin a fire department, significantlyfewer than with offices of emergencymanagement, but statistically similarto fire department-based EMS, lawenforcement, public healthdepartments, and fire departments. Statistically similar percentages ofhospitals performed drills withdecontamination teams (58.4 percent)and hazardous materials teams(50.9 percent). Statistically similar percentages ofhospitals performed drills with schoolsystems (30.6 percent), industrial orcommercial organizations(25.8 percent), or long-term carefacilities (20.4 percent).Mass casualty resources For personal protection, the mediannumber of N95 masks per hospitalwas 432, and the median number ofpersonal protective suits withpowered air-purifying respirators perhospital was 10 (Table 8). The median numbers of patients thatcould be handled by hospitaldecontamination showers per hourwas seven for ambulatory patients,three for small children or infants,and three for stretcher patients. The median numbers of beds perhospital was 70 for regular inpatientstaffed beds, 8 for critical care beds,11 for ED treatment spaces, and 4 fornegative pressure isolation rooms. The median number of mechanicalventilators per hospital was six.Ambulance diversionWhen EDs are at capacity,ambulance diversion is implemented.Thus, the number of annual hours thatan ED is on ambulance diversion, orthat a hospital is on diversion for traumaor critical care cases, reflects thehospital’s capacity to accept newpatients, not only during routineoperations, but also during a masscasualty incident (Table 9). In 2007, the majority of hospitals(58.7 percent) did not report being onED ambulance diversion. AboutNational Health Statistics Reports n Number 37 n March 24, 201116.3 percent of hospitals were onambulance diversion for 220 hours orless (equivalent to about 9.2 days),which represented the mean for the91.2 percent of hospitals for whichdata were available. About16.2 percent of hospitals were onambulance diversion for more than220 hours. Ambulance diversioninformation was unknown for8.7 percent of hospitals. In 2007, the majority of hospitals(72.5 percent) did not report being ontrauma diversion. About 7.1 percentof hospitals were on trauma diversionfor 32 hours or less (equivalent toabout 1.3 days), which representedthe mean for the 85.2 percent ofhospitals for which data wereavailable. The estimate was unreliablefor hospitals on trauma diversion formore than 32 hours. Trauma diversioninformation was unknown for14.8 percent of hospitals. In 2007, the majority of hospitals(66.4 percent) did not report being oncritical care diversion. About10.6 percent of hospitals were oncritical care diversion for 72 hours orless (equivalent to three days), whichrepresented the mean for the84.5 percent of hospitals for whichdata were available. About 7.5 percentof hospitals were on critical carediversion for more than 72 hours.Critical care diversion informationwas unknown for 15.5 percent ofhospitals.Hospital preparednessfundingBetween 2002 and 2007, aboutone-quarter of hospitals (24.3 percent)received more than 150,000 in federalpreparedness funding, 19.2 percentreceived more than 75,000 but lessthan 150,000, and 24.2 percentreceived more than zero but less than 75,000. About 5.2 percent received nofunding. The amount of funding wasunknown for 27.2 percent of hospitals(Table 10).DiscussionThis emergency responsepreparedness supplement containsvaluable information for federal, state,and local planners who are responsiblefor hospitals’ response to infectiousdisease epidemics and other masscasualty incidents. In this report,baselines have been established for newdata elements. Future research will tracktrends between 2003–2004 and 2008 fordata elements that are unchanged, andidentify hospital characteristics that areassociated with emergency preparedness.There are several key issues that arehighlighted by this survey.While nearly all hospitals haveemergency response plans for chemicalreleases, natural disasters, epidemics orpandemics, and biological accidents orattacks, preparedness for explosive orincendiary incidents is significantly lessfrequent than preparedness for othertypes of mass casualty incidents. Asimilar trend was found with respect toincluding explosion scenarios in masscasualty drills. Explosive terrorism isinfrequent in the United States, with noincidents having occurred since the 2001airline attacks at the World TradeCenter, Pentagon, and over Pennsylvania(9). However, incendiary incidents(fires) are more common. The U.S. FireAdministration reported that there wereabout 15,500 fires in high-rise structuresbetween 1996 and 1998. While hospitalpreparedness for fires most ofteninvolves receiving casualties fromincidents occurring elsewhere, it isnoteworthy that about 6 percent of thesehigh-rise structure fires occurred inhospitals (10).ED crowding continues to be amajor policy issue. The Institute ofMedicine (IOM) has expressed concernthat many hospitals now operating at ornear full capacity lack the ability tohandle sudden increases in volumeassociated with mass casualties (11).The American College of EmergencyPhysicians (ACEP) recommends thathospitals develop influenza preparednessplans to assure adequate inpatient surgecapacity by such means as openingunused areas, doubling up inpatientrooms, canceling elective admissionsand procedures, and using alternateareas for extra critical care space (12).We found that while most hospitals hadplans for cancellation of elective
National Health Statistics Reports n Number 37 n March 24, 2011procedures and admissions, only abouttwo-thirds had plans for establishmentof alternate care areas with beds,staffing, and equipment in nonclinicalspace. Only about one-half had plans forestablishing alternate care areas ininpatient unit hallways ordecommissioned ward space, or forconversion of inpatient units to augmentintensive care capacity. One practice thatmay be useful in decompressing EDs isestablishing alternate care areas ininpatient hallways until regular bedsbecome available. Because of concernsabout the safety to patients of thisapproach, one academic ED studiedadverse events resulting from theirinstitutional protocol for admittingED-boarded patients to inpatient hallwaybeds during overcrowding situations.In-hospital mortality and ICU transferswere both significantly lower forpatients admitted to hallway beds thanfor those admitted to standard inpatientbeds. The authors concluded thathallway boarding was not harmful topatients (13).When resources for patient carebecome scarce in disaster situations,IOM recommends the development ofconsistent state crisis standards of care(14). One example of such a resource ismechanical ventilators for patients inrespiratory failure due to infectiousagents that have compromised lungfunction. We found that only aboutone-half of hospitals had advance plansfor adjusted standards of care forallocation of mechanical ventilatorsduring mass casualty incidents whennormal capacities might beoverwhelmed. But models do exist fordeveloping such standards. In onetertiary medical center, a triage systemwas developed and tested for institutingor continuing mechanical ventilationbased on objective clinical factorsrelated to survival potential andavailable resources. The system, whichinvolves a change in the standard ofcare, would be implemented through thehealth department and supported by adeclaration from the state governor withprofessional liability protections in place(15).ACEP recommends that hospitalscreate and execute a training programbased upon their emergency operationsplans, develop pandemic influenzaexercise programs, and execute anexercise to test the validity of thetraining and plans (12). As evidenced bythe 2009 H1N1 influenza epidemic,mass vaccination and medicationdistribution are frequently keycomponents of epidemic response. Wefound that although more than one-halfof hospitals had staged epidemic drills,only about one-third had included massvaccination or community medicationdistribution specifically. In a survey ofhealth care epidemiologists followingthe experience of the 2009 H1N1influenza epidemic, only 60 percent feltthat their hospitals were well preparedfor a pandemic, and 31 percent reportedshortages of antiviral medications. Theauthors identified pandemic influenzapl
hospital preparedness. Table 3 summarizes responses to a series of questions about written emergency response plans for 48 components of preparedness for hospital overcrowding incidents or public health emergencies, and whether the plans were implemented in an actual incident during 2007. 12.9Broad categories of hospital preparedness inincluded