![2017 Fact Book.xlsx -[-EXCEL.EXE-]- - Northwest Arkansas Community College](/img/19/2017factbook.jpg)
Transcription
,.
Table of ContentsTable of Contents 2Introduction and Highlights 3OrganizationBoard of Trustees 4Administration 4Organization Chart .5History, Role and Scope . 6Strategic Plan Outline . 6Accreditation 6Mission and Values Statements 6Key Performance Indicators 7College Facilities 8Learning ProgramsDegree Programs 92 Year Degrees Awarded 10Technical Certificates Awarded 1112Certificates of Proficiency Awarded Licensure Test Results . 13Student Semester Credit Hour by CIP 14Number of Sections of Courses Offered 15Number of Teaching Faculty 15Credit Hours Taught - FT & PT Faculty 16Corporate and Continuing Education 17Adult Education 18Students2013 and 2014 Headcount Summary Comparison 19Historical Headcount Summary 20Headcount Enrollment by Semester 2122Headcount by Student Type Headcount by Majors 23-24Headcount by Race/Ethnicity 25Headcount by Residency 26Washington County Facilities Enrollment . 27Headcount by Tuition Status 28Student Semester Credit Hours by Semester 29Student Semester Credit Hours by Tuition Status 230Fall SSCH and FTE Enrollment 31Annual SSCH and FTE Enrollment 32High Schools in NWACC Service Area 33Early College Experience - High School Based . 34-3536Early College Experience - Career & Technical . 37Transfer Students to Other Arkansas Colleges . RemediationRemediated First Time Freshmen 38Average ACT Composite Scores 39Graduation-RetentionGraduation Rates for Full-Time, First-Time Freshmen 40Retention Rates for All Students . 41ResourcesFinancial Aid . 42Financial Report Summary 43SummaryFaculty and Staff Counts . 44Summary of Students Served 45Glossary . 46-472
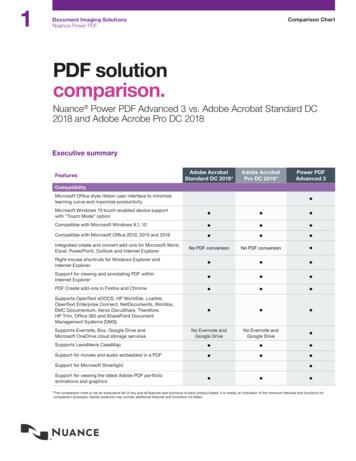
IntroductionThe NorthWest Arkansas Community College Fact Book for Fall 2017is produced by the Office of Institutional Research and outlinesenrollment, faculty, financial and other comprehensive informationfor NorthWest Arkansas Community College.Copies of this document may be found in the Office of InstitutionalResearch and on the web at www.nwacc.edu/institutionalresearch.All enrollment data in this document were based on the officialenrollment of the college at the end of the eleventh class day. All fiscalyear data were collected as of June 30th, 2017. The definitions andguidelines used to compile this information are provided by theIntegrated Postsecondary Education Data System (IPEDS) and theArkansas Department of Higher Education. Definitions andguidelines unique to the institution will be noted on individual tables.Inquiries and comments regarding this document may be directed tothe Office of Institutional Research, NorthWest ArkansasCommunity College, One College Drive, Bentonville, AR 72712, bytelephone at (479) 619-4399, or by e-mail to kpurdy@nwacc.edu orlanderson7@nwacc.edu.The Fact Book will be updated prior to December 1 each year.Highlights Fall 2017·Official eleventh day headcount was 7,715 students, a decrease of 46 students from Fall 2016.·Students from Benton and Washington Counties make up 90% of the NWACC student body.·NWACC awarded 1,083 degrees and certificates in Academic Year 2017 (July 1, 2016 - June 30, 2017)·NWACC's Physical Therapist Assistant and Registered Respiratory Therapist programs had pass rates of 100%.·NWACC served over 15,000 students in Academic Year 2017 (July 1, 2015 – June 30, 2017). This includes college credit classes,workforce development classes, community education, adult education, as well as secondary students through the Regional Technology Center3
Board of TrusteesAdministrationMembers of the Board of Trustees of NorthWest Arkansas Community College areelected by zone in groups of three each even numbered year at the general election.Board Members as of December 1, 2017 and the district they represent:ChairMr. Joe SpiveyZone 9First Security BankVice Chair Mr. Todd SchwartzZone 4Sawinka Industrial CompanySecretaryMr. Ron BranscumZone 5Citizens BankMr. Mauricio HerreraZone 8Legal Center of NW ArkansasMs. Debra HobbsZone 7Hart Tackle Co.Mr. Lucas PointerZone 1First Western BankMr. Mark ScottZone 6Walmart Stores, Inc.Mr. Mike ShupeZone 3CEI Engineering Associates, Inc.Dr. DeAnne WitherspoonZone 2Retired OptometristPresidentVP for Finance and AdministrationVice President of Student ServicesVice President of Learning/CAOVice President of Career and Workforce EducationExecutive Director of DevelopmentExecutive Director of Planning, Effectiveness & PRExecutive Director of Community and Gov't RelationsDr. Evelyn JorgensonMs. Debi BuckleyDr. Todd KitchenDr. Ricky TompkinsMr. Tim CorneliusMs. Annetta TireyDr. Lisa AndersonMr. Jim Hall4
Organizational Chart*Double line box indicates Cabinet member5
History, Role and ScopeNWACC Mission StatementThe NorthWest Arkansas Community College District was authorized on August 15, 1989,when voters in the Rogers and Bentonville public school districts passed a 3-mil tax. The firstclasses were attended by more than 1,200 students in the fall of 1990 at high schools, chambersof commerce, municipal and leased facilities throughout the district.Empower Lives, Inspire Learning and Strengthen Community through Accessible,Affordable, Quality Education.Burns Hall opened its doors to just more than 2,400 students in August 1995. The main buildingis a multipurpose facility on 131 acres of land at Exit 86 off Interstate 49 on the Rogers andBentonville, Arkansas, city limits. The Shewmaker Center for Workforce Technologies openedin 2003 and offers customized programs to area businesses. The Becky Paneitz Student Centeropened in the Spring of 2007, along with a student parking garage. Summer 2010 saw theopening of the Shewmaker Global Business Development Center and a new Health ProfessionBuilding opened in January of 2013. The Melba Shewmaker National Child Protection TrainingCenter opened in Spring 2014.Positively changing the lives of those we serve.The College’s Adult Education Program relocated to the Shewmaker Center for WorkforceTechnologies in the Summer of 2015.NWACC is a comprehensive, learning-centered two-year college dedicated primarily to meetingthe educational needs of its service area. NWACC offers a comprehensive education programincluding, but without limitation, technical occupational programs, freshman and sophomoreprograms for students to transfer to four-year colleges, specialty courses, professionalcontinuing education courses, community enrichment classes, and business and industrytraining to meet the needs of the emerging and existing workforce. Part-time and full-timestudents are valued equally.Presidents and Their TenureDr. Bob C. Burns (1989-2003)Dr. Becky Paneitz (2003-2013)Dr. Evelyn Jorgenson (2013-NWACC Vision StatementNWACC Values StatementIn order to accomplish our mission and goals we- Cherish academic, professional and personal integrity- Facilitate continuous learning for students and stakeholders- Value human resources over physical resources- Develop the potential of the individual to achieve excellence- Anticipate and respond to needs by encouraging innovative ideas and technologies- Respect our differences and view them as a strength- Advance knowledge through individual and team challengesCurrent Strategic Goals1. Increase Student Success2. Provide Quality Programming and Assessment3. Support Financial Stability4. Increase Community Outreach, Support and Relations5. Support and Enhance Institutional Operations6. Improve Land and Facilities7. Increase Diversity and InclusionAccreditationIn 2012, the Institutional Actions Council of the Higher Learning Commission grantedNorthWest Arkansas Community College continued accreditation through 2019-20. NorthWestArkansas Community College was also reaffirmed in 2012 as one of the Higher LearningCommission’s Academic Quality Improvement Program (AQIP) institutions.6
Related AQIP Category orClosing the Gap 2020Goal 7: Increase Diversity andInclusion2017Goal 6: Improve Land andFacilities2016Goal 3: Support FinancialStabilityGoal 4: Increase CommunityOutreach, Support andRelationsGoal 5: Support and EnhanceInstitutional OperationsBaselineGoal 2: provide QualityProgramming and AssessmentKey Performance IndicatorProposedTarget‐2020Goal 1: Increase StudentSuccessKey Performance Indicators (KPIs)STUDENTEnrollment1. Fall credit student headcount2. Enrollment age 25-543. Annual Student Semester Credit Hours7,7442,3957,7612,0787,7151,949153,998 146,496 149,5518,000X4 and 5Closing the Gap3,200159,000X1, 54. Non-Credit Unduplicated headcount--prior Academic Year2,5393,2612,5983,000X25. Adult Education Unduplicated headcount2,3731,8741,7082,600X1, 244.3%45.6%46.9%48%X1 and X75%82%71%77%XXXRetention/Graduation6. Fall to fall retention rate7. Total Degrees and Certificates Awarded-prior AY8. Degrees and Certificates Awarded to underserved students9. Three year success rate (full-time students--graduation plus transfer)XX1, 2XClosing the Gap1 and 2Student Performance10a. ENGL Development Student Success10b. MATH Development Student Success69%74%67%71%X11. Licensure/Certification Exam Passage 3.86/54.0/57.9%7.2%7.4%10%12. Student satisfaction11X1 and 2X3X3EMPLOYEE13. Employee Satisfaction14. % Minority FT faculty and staffXXX3COLLEGE BUSINESS15. KWH usage Per Sq Ft (college-owned instructional facilities)8.068.57.868.06XX4, 516. Instructional Expenses as a Percentage of Total Expenditures44%48%49%50%XX4, 57
NWACC FacilitiesMain CampusNWACC Farmington CenterOne College Drive275 Rheas Mill RoadBentonville, AR 72712Farmington, AR 72730479.986.4000 or 1.800.995.6922479.986.6654NWACC Burns HallBecky Paneitz Student CenterThe Jones Center for FamiliesShewmaker Center for Workforce Technologies922 East Emma Avenue- Adult EducationSpringdale, AR 72764- Worforce and Economic Development479.756.8090Shewmaker Center for Global Business DevelopmentCenter for Health ProfessionsThe Melba Shewmaker Southern RegionNational Child Protection Training CenterRegional Technology Center2305 Old Farmington RoadFayetteville, AR 72701479.444.3060Culinary and HospitalityBrightwater: A Center for the Study of FoodWashington County Center801 SE 8th StreetCentral PlazaBentonville, AR 72712693 White Road, Suite BSpringdale, AR 72764479.927.3330 or 479.936.51318
Degree ProgramsAssociate of Applied Science (AAS) DegreesTwo-year degree designed for students seeking concentrated training in a chosen career area to enterthe workforce directly after graduation.Business ManagementElectronics Technology (NTI )Accounting OptionEMT-ParamedicBanking & Finance OptionEnvironmental & Regulatory ScienceEntrepreneurship OptionEnvironmental Mgmt OptionGeneral Business OptionSafety, Health & Hazardous Materials MgmtLogistics Management OptionFire ScienceRetail OptionFood StudiesComputer Aided DesignBaking & Pastry OptionArchitectural Design OptionBeverage ArtsCivil/Landscape Design OptionCulinary ArtsMechanical Design OptionHospitality Mgmt OptionComputer Information SystemsGraphic DesignComputer Programming OptionHealth Information ManagementInformation Mgmt & Appl OptionLaw EnforcementNetworkingLaw Enforcement Administration (CJI*)Construction TechnologyLegal Assistant/ParalegalCrime Scene Investigation (CJI*)NursingCriminal JusticePhysical Therapist AssistantEarly Childhood EducationRespiratory TherapyAssociate and Certificate of General StudiesThe General Studies program is designed for students who wish to tailor a program to meettheir personal educational enrichment goals. This is not intended to transfer.Technical Certificates and Certificates of Profieiency offer concentrated training in acareer area. They are designed for students seeking concentrated training in a chosencareer area to enter the workforce directly after completion.Technical Certificate ProgramsAccounting TechnologyArtisanal FoodsBaking ArtsBeverage ArtsComputer Aided DesignChild Advocacy StudiesConsruction TechnologyCrime Scene Investigation (CJI*)Criminal JusticeCulinary ArtsDental AssistingEMT ParamedicEntrepreneurshipEnvironmental Mgmt & Reg SciEnvironmental Regulatory ScienceEvent PlanningFuneral ScienceGeneral BusinessGraphic DesignHealth Information ManagementHospitality ManagementLaw Enforcement Adm (CJI*)Logistics ManagementMediaNetworkingCyber Technician OptionRetail ManagementTransfer DegreesCertificate of Proficiency ProgramsAssociate of Arts (AA)Baking ArtsChild Advocacy StudiesChild Development Associate (CDA)Cinematic StudiesComputer Aided DesignConstruction TechnologyCrime Prevention and CorrectionsCrime Scene Investigation (CJI)*Criminal JusticeCulinary ArtsElectronics TechnologyEMT BasicEnvironmental Mgmt/GIS TechnicianThe Associate of Arts degree is a transfer degree designed for the student who wishes to major in theliberal arts. Courses taken in the approved core curriculum will also apply toward baccalaureatedegree requirement at most four-year institutions.Associate of Arts AA with Child Advocacy Option AA with Global Studies OptionAssociate of Science (AS)The Associate of Science Degree is a transfer degree designed for the student who wishes to major inengineering, agriculture, or the sciences. NWACC offers a general AS degree as well as one withemphasis in one of these areas:Agriculture, Food and Life SciencesLiberal Arts and SciencesBusiness EmphasisWalton College of Business (WCOB) OptionWCOB Information Systems OptionAssociate of Fine Arts (AFA)The Associate of Fine Arts degree is a transfer degree designed for the student who wishes to major increative writing, music, theatre and visual arts. Courses taken in the approved core curriculum willalso apply toward baccalaureate degree requirement at most four-year institutions.Forensic ScienceFuneral SciencesGraphic DesignHospitality ManagementJustice StudiesLaw EnforcementLaw Enforcement Adm (CJI*)MediaNetworkingNursing AssistantPre-Health SciencesSafety & Health (available Online)Workforce Readiness*available in cooperation with the Criminal Justice Institute available in cooperation with Northwest Technical Institute9
2 Year Degrees AwardedBy Academic Year2012-132013-142014-152015-162016-17 % -3%890774780782753-4%AAS DegreesAviationBusiness ManagementComputer Aid Drafting and DesignComputer Information SystemsConstruction TechnologyCriminal JusticeCulinary ArtsEarly Childhood EducationElectronic TechnologyEMT-ParamedicEnvironmental Reg, Safety, and Haz MatFire Science Administration and TechGraphic DesignHealth Information ManagementHomeland Security & Emergency MgmtLaw Enforcement Adm (CJI)Legal Assistance/Paralegal StudiesNursingPhysical Therapist AssistantRespiratory Therapist-7%General Studies DegreesGeneral Education11%Transfer DegreesGeneral EducationAAASAS-AgricultureAS-BusinessAS-Business AdmAAT (Teaching)TOTAL AA & AS DegreesTotal 2 Year Degrees**NOTE: This table reflects only students who completed degrees between July 1 and June 30 of each academic year10
Technical Certificates AwardedBy Academic Year2012-13 2013-14 2014-15 2015-16 2016-17 % ChangeTechnical CertificatesAccounting TechnologyBaking ArtsBusiness ManagementCAD: Architectural DesignCAD: Civil/Landscape DesignCAD: Mechanical DesignChild Advocacy StudiesCriminal JusticeCulinary ArtsDental AssistingEmergency Medical Tech - ParamedicEntrepreneurshipEnvironmental ScienceEnvironmental Mgmt & Reg ScienceGeneral BusinessGraphic DesignHealth Information ManagementHomeland Security & Emergency MgmtHospitality ManagementLaw Enforcement Adm (CJI)Logistics ManagementNetworkingParaeducators of Special Needs LearnersTOTAL Technical 10007300210579811139290107104560448695%*NOTE: This table reflects only students who completed degrees between July 1 and June 30 of each academic year11
Certificates of Proficiency AwardedBy Academic Year2012-13 2013-14 2014-15 2015-16 2016-17 % ChangeCertificates of ProficiencyBaking ArtsCAD: ArchitectureCAD: Engineering Child Advocacy StudiesChild Dev Associate (CDA) TrainingCinematic StudiesCrime Prevention & CorrectionsCrime Scene InvestigationCriminal JusticeCulinary ArtsElectronics TechnologyEmergency Medical Technology - BasicEnvironmental ScienceEnvironmental Mgmt/GIS TechForensic ScienceGraphic DesignHomeland Security & Emergency MgmtHospitality ManagementLaw EnforcementLaw Enforcement AdministrationNetworkingNursing AssistantPre-Health SciencesRetail ManagementSafety & HealthTax SpecialistWorkforce ReadinessTOTAL Certificates of 07%1,2529741,0519861,08310%-18%Certificate of General StudiesGeneral StudiesTOTAL CertificatesTotal Degrees and Certificates**NOTE: This table reflects only students who completed degrees between July 1 and June 30 of each academic year12
Licensure and Certification Pass RatesYearNWACC ExamTakers# of First TimeNWACC TestersPassing ExamNWACC PassRateStateNationalPercentage Average AverageNational Council Licensure Examination - Registered ational Registry of EMT-Paramedic Licensure 2Arkansas Fire Academy Certification nal Physical Therapist Assistant Exam tered Respiratory Therapist (WRRT/TMC-High Cut) 2.7%100.0%100.0%66.4%66.4%77.1%54.8%72.1%13
Student Semester Credit Hour Production by CIP Codeby Academic Year2012-132013-14% of Total2014-15% of Total2015-16% of Total2016-17% of Total% Growth% of TotalSSCHCr HoursSSCHCr HoursSSCHCr HoursSSCHCr HoursSSCHCr .58%5,9553.98%13.52%14.12%11 Computer & Information .12%3.40%-33.91%12 Personal and Culinary 6821.12%14.19%0.30%13-19-31-34 Education/Physical ,7151.82%-12.14%-48.29%15-47-48-49 Engineering & Related .98%16.56%17.87%23 English Lang & .38%17,00411.61%18,82812.59%10.73%8.60%16 Foreign Language & %1,4880.99%-9.16%-25.08%51 Health Prof & Related %10,2026.82%-4.19%17.72%22 Law and %76.19%34.55%27 53411.97%18,02112.05%2.78%-1.42%38 Philosophy and 6272.43%-0.66%-12.58%40 Physical 9094.62%6.06%-7.30%2910.19%CIP Code1 Agricultural Sciences32 Basic Skills (Developmental)3-26 Biological Sciences/Life Sci52 Business Mgmt & Adm Services9 Communications24 Liberal Arts & Science & Gen Stu46 Construction TechnologiesOne Year Five Year43 Protective 0561.37%24.08%-27.88%42 7,9835.34%7.60%-5.53%44-45-54 Social Sciences and .47%14,5879.75%5.15%-24.02%50 Visual and Performing .79%4.92%-18.16%2.09%-11.51%Total SSCH169,012159,192153,998146,496149,551Source: ADHE SIS DatabaseCIP Code: Federal Gov't Classification of Instructional Programs14
Number of Sections of Courses Offered / Number of FacultyFall SemesterFallSectionsOfferedOne Year %GrowthFive Year %GrowthNumber ofTeaching FacultyOne Year % Five Year %GrowthGrowthAverageClass 2014Sections Offered201520162017Number of Teaching FacultyNOTE: Average class size includes independent study and college courses offered on high school campuses.15
Credit Hours Taught by Full Time & Part Time FacultyFall SemesterFallFull TimeFaculty% Taught by Part TimeFTFaculty% Taught byPT Cr HrsFTFT Cr ther FTTeaching*Other Cr % TaughtHrsby OtherCredit Hours 0046-4702013Full Time Faculty20142015Part Time Faculty20162017Other FT Teaching*20132014FT Cr Hr2015PT Cr Hrs20162017Other Cr Hrs*Other FT Teaching-Administrative and support personnel who taught class(es)16
Workforce & Economic DevelopmentBy Academic YearTotal number of students served by Corporate 4201520162017Headcount ns5,3473,0353,1243,6773,079Number of Sections of Classes489363320282326Number of Businesses 022Headcount (unduplicated)RegistrationsNumber of Sections of ClassesWorkforce DevelopmentHealth Professions Non-Credit Classes20132014Headcount (unduplicated)RegistrationsNumber of Sections of Classes32323Personal Education & Enrichment2013Headcount (unduplicated)RegistrationsNumber of Sections of Classes2473545917
Adult Education EnrollmentsAdult Education offers non-credit classes designed to teach and review academic skills culminatingwith preparation for taking the High School Equivalence (GED) test battery. Other areas such asEnglish as a Second Language (ESL) and computers are also Adult Basic Education1,2201,078905686633English as a Second Language1,4831,2401,072909811431435396279264Total Students Served3,1342,7532,3731,8741,708Total GEDs Awarded363482159135193Adult Secondary dult Basic Education2013-142014-152015-16English as a Second Language2016-17Adult Secondary Education18
Headcount Enrollment SummaryFall 2016 and Fall 2017Total HeadcountFTEEnrollment StatusGenderResidenceTuition Status*Ethnicity/RaceAgeFall 2016N%Fall .1%-1.1%-0.2%Benton CountyWashington CountyOther .4%-6.5%-11.8%-18.8%57.1%Hispanic or LatinoNon-Hispanic Race:Am Indian/Alaskan NativeAsianBlack or African AmericanNative Hawaiian/Pacific IslanderWhite2 or more racesUnknownNon-Resident Alien 1818-1920-2122-2425-2930-3435-4445-5455-64 65AVERAGE AGE*MEDIAN AGE*Fall 16 to17Change*NOTE: Average and Median Age figures do not include High School Students19
Historical Headcount SummaryFall 1990 to Fall 2017TotalAdditionalTotalYearHeadcountStudents% ource: Reports submitted to ADHE20
Headcount Enrollment by SemesterYearFallHeadcount*Fall to Fall% ChangeSpringHeadcount*Sp to Sp% ChangeSummer IHeadcountSummer IIHeadcountTotalSummerSummer% 00.0%-100.0%Spring HeadcountFall HeadcountSummer 14 14-15 15-16 16-17 17-18*NOTE: Off schedule classes are not included, such as Late Start and second 8-week21
Headcount by Student TypeFall SemesterNew FreshmenTransfer StudentsContinuing StudentsPercentVisiting Students% %1.2%6538.46%-6.3%4,500PercentReadmitted StudentsPercentHigh School 18413,000422,500432,0001,500441,0004550046-470New FreshmenTransfer StudentsContinuing Students201320142015Readmitted Students2016Visiting StudentsHigh School Students2017New Freshmen: First-time entering undergraduateTransfer: First Semester transfers to NWACC from another college or universityContinuing: Continued enrollment from previous semesterReadmitted: Enrolled at NWACC after not attending the previous semesterVisiting: Students of another college/university 'visiting' NWACC to receive credit to transfer back (added in 2014)High School: Students still enrolled in High School22
Headcount by Majors - 2 Year DegreesFall SemesterMajor20132014201520162017Business Management364374334275216Cert Respiratory Therapist3720181925Computer Aided Drafting1220191519Computer Info SystemsAAS Degrees207181165135133Construction Technology---3153Crime Scene Investigation21241Criminal Justice1581501119190Culinary Arts156139108122140Early Childhood Education1061061098171Electronics ental Regulations, 3738272521Fire Science4740363958Graphic Design113101908277Health Information Mgmt2437453632Homeland Security & Emg Mgmt135000Law Enforcement ,1941,1771,0831,0981,65359618880128Physical Therapy AssistantTOTAL AASGeneral StudiesAssociateTOTAL General StudiesTransfer DegreesAgricultural, Life ScienceBusinessAATAFA (Fine Arts)TOTAL Transfer DegreesUndeclaredNon-degree 39Note: Associate of General Studies majors include students working toward (but not admitted to)selective admissions programs such as Nursing.23
Headcount by Majors - CertificatesFall SemesterMajor20132014201520162017Technical CertificatesAccounting TechnologyBaking ArtsBeverage ArtsBusiness ManagementCADChild Advocacy StudiesCriminal JusticeCulinary ArtsDental AssistingEMT-Paramedic CertEntrepreneurshipEnvironmental MgmtEnvironmental Reg ScienceFuneral ScienceGeneral BusinessGraphic DesignHealth Information MgmtHospitality ManagementLogistic ManagementMediaNetworking-Cyber TechRetail 0042521110462101121Certificates of ProficiencyBaking ArtsCADCDA TrainingChild Advocacy StudiesCinematic StudiesComputer NetworkingCrime Prevention & CorrCriminal JusticeCulinary ArtsEa
telephone at (479) 619-4399, or by e-mail to kpurdy@nwacc.edu or landerson7@nwacc.edu. Highlights Fall 2017 · Official eleventh day headcount was 7,715 students, a decrease of 46 students from Fall 2016.