Transcription
Western Cape GovernmentProvincial TreasuryMunicipal Economic Reviewand Outlook2016
Provincial TreasuryLocal Government Budget OfficePrivate Bag X91657 Wale StreetCape Towntel: 27 21 483 3386 fax: 27 21 483 4680www.westerncape.gov.zaAfrikaans and isiXhosa versions of this publication are available on request.Email: Moses.Mlangeni@westerncape.gov.zaPR298/2016ISBN: 978-0-621-44870-2
ForewordThis is the fifth edition of the Municipal Economic Review and Outlook (MERO) since itsinception in 2012. The MERO continues to provide valuable evidenced-basedresearch to municipalities within the Western Cape in support of enhanced planningfor economic growth, job creation and socio-economic upliftment.The MERO compliments the Provincial Economic Review and Outlook and as a toolkitit enables decision-making for municipalities, government departments, publicentities, businesses as well as national and international organisations interested ininvesting in the Western Cape. The 2016 MERO will thus assist Executive Mayors,Councillors, Municipal Managers, officials, business chambers, IGR Forums, localstakeholder organisations and future investors in making informed decisions and toexercise policy choices that is backed up with evidence-based research.Both these publications aim to improve our understanding of the Western Capeeconomy at a sub-regional level to facilitate provincial and municipal policyformulation, alignment, integrated planning and budgeting.The municipal and provincial economic outlook remains fragile and is extremelyvulnerable to any further international and domestic shocks. Stubbornly highunemployment rates, coupled with increasing population pressures linked to servicedelivery demands and socio-economic dynamics related to youth, gender and raceremain key challenges in the Western Cape. Other domestic constraints impacting onthe economic outlook relate to energy, water, food security, infrastructure and skillsshortages; while outcomes related to education, health and broader social illscontinue to impact on and are affected by the levels of economic development.These economic pressures highlight the fundamental need for thorough aking,activeeconomictransformation and appropriate policy responses which will in turn stimulateeconomic and human development. The MERO’s research findings are therefore ofparticular relevance given that municipalities will adopt their fourth generationIntegrated Development Plans in May 2017, which will be key to facilitatesustainability, ensure the effective use of resources, improved service delivery, attractadditional funding, harness democratic values and to promote inter-governmentalcooperation.
Municipal Economic Review and Outlook 2016The detailed analysis and overview of the unique comparative advantages andopposing challenges faced by municipalities which are each differently influencedby external economic pressures emphasise the need for innovation andentrepreneurship to achieve inclusive growth.Lastly, I wish to express a sincere word of appreciation to my colleagues and officialsfrom the various provincial government sector departments, municipal officials andthe research team for their valuable contributions and inputs. We will continueworking with our partners and key stakeholders particularly those working on planningand budgeting in the municipal space to support evidence-based decision-makingin the building of an environment conducive to economic growth and employmentcreation.Dr Ivan MeyerMinister of FinanceWestern Cape Government30 September 2016
ContentsSECTION A: BACKGROUND AND MACROECONOMIC CONTEXT11.Introduction and background12.Macroeconomic outlook23.Background to main sub-sections23SECTION B: WESTERN CAPE REGIONS45City of Cape Town Metropolitan Municipality47Chapter 1:Regional economic review and outlook47Chapter 2:Sectoral growth, employment and skills per planning district63Chapter 3:Value chains91Chapter 4:Infrastructure spending - review and analysis115Chapter 5:Municipal socio-economic analysis125West Coast District139Chapter 1:Regional economic review and outlook139Chapter 2:Sectoral growth, employment and skills per municipal area153Chapter 3:Value chains171Chapter 4:Infrastructure spending - review and analysis187Chapter 5:Municipal socio-economic analysis203Cape Winelands District219Chapter 1:Regional economic review and outlook219Chapter 2:Sectoral growth, employment and skills per municipal area233Chapter 3:Value chains251Chapter 4:Infrastructure spending - review and analysis267Chapter 5:Municipal socio-economic analysis283i
Municipal Economic Review and Outlook 2016Overberg District301Chapter 1:Regional economic review and outlook301Chapter 2:Sectoral growth, employment and skills per municipal area315Chapter 3:Value chains329Chapter 4:Infrastructure spending - review and analysis343Chapter 5:Municipal socio-economic analysis357Eden District373Chapter 1:Regional economic review and outlook373Chapter 2:Sectoral growth, employment and skills per municipal area389Chapter 3:Value chains417Chapter 4:Infrastructure spending - review and analysis433Chapter 5:Municipal socio-economic analysis457Central Karoo District475Chapter 1:Regional economic review and outlook475Chapter 2:Sectoral growth, employment and skills per municipal area489Chapter 3:Value chains499Chapter 4:Infrastructure spending - review and analysis513Chapter 5:Municipal socio-economic analysis523Referencesii539
Municipal Economic Review and Outlook 2016AcronymsABTAlternative Building TechnologyAFASAAfrican Farmers' Association of South AfricaAHAgri-HubAPAgri-parkARTAnti-Retroviral TreatmentASAAnimation South AfricaASNAPPAgribusiness in Sustainable Natural African Plant ProductsBBBEEBroad-Based Black Economic EmpowermentBERBureau of Economic ResearchBCIBusiness Confidence IndexBNGBreaking New GroundBPOBusiness Process OutsourcingBPO&OBusiness Process Outsourcing & Off ShoringCasidraCape Agency for Sustainable Integrated Development in Rural AreasCASPComprehensive Agricultural Support ProgrammeCBDCentral Business DistrictCCACustoms Controlled AreaCCIConsumer Confidence IndexCCIDCentral City Improvement DistrictCFRCape Floristic RegionCIPCCompanies and Intellectual Property CommissionCISCommonwealth of Independent StatesCOGTADepartment of Cooperative Governance and Traditional AffairsCPIConsumer Price IndexCRMCustomer Relations ManagementCSPConcentrated Solar PowerCTCape TownDACDepartment of Arts and CultureDAFFDepartment of Agriculture, Forestry and FishingDBSADevelopment Bank of South AfricaDEDATDepartment of Economic Development and Tourismiii
Municipal Economic Review and Outlook 2016DRCDemocratic Republic of Congothe dtiDepartment of Trade and IndustryEDEnterprise DevelopmentEFTAEuropean Free Trade AreaEIAEnvironmental Impact AssessmentEIFFEden Independent Film FestivalEIPEnterprise Investment ProgrammeEPAEconomic Partnership AgreementERMEnterprise Resource ManagementETIEmployment Tax IncentiveEUEuropean UnionFDIForeign Direct InvestmentFPSUFarmer Production Support UnitFSAFood Safety AssessmentFSDFarmer Support and DevelopmentGDPGross Domestic ProductGDPeExpenditure on GDPGDPpGDP ProductionGDSGlobal Distribution SystemsGGPGross Geographic ProductGISGeographic Information SystemGMOGenetically Modified OrganismGOSAGrain Handling Organisation of Southern AfricaGVAGross Value AddedhahectareHDIHuman Development IndexHRMHuman Resource ManagementICTInformation and Communications TechnologyIDCIndustrial Development CorporationIDPIntegrated Development PlanIDZIndustrial Development ZoneIMFInternational Monetary FundIPWIntegrated Production of Wineiv
Municipal Economic Review and Outlook 2016IRTIntegrated Rapid TransitITOInformation Technology OutsourcingKPIKey Performance AreaKPOKnowledge Processing OutsourcingLEDLocal Economic DevelopmentLPOLegal Process OutsourcingLSFBLight Steel Frame Building Construction MethodLQLocational QuotientMEROMunicipal Economic Review and OutlookMFMAMunicipal Finance Management Act No. 56 of 2003MIGMunicipal Infrastructure GrantMOUMemorandum of UnderstandingNDPNational Development PlanNEONational Executive OfficerNHBRCNational Home Builders’ Registration CouncilOECDOrganisation for Economic Co-operation and DevelopmentPDOProtected Designation of Product of OriginPGIProtected Geographic IndicationPMIPurchasing Managers ity Council for Trade and OccupationsQMSQuality Management SystemR&DResearch and DevelopmentREIPPPPRenewable Energy Independent Power Producer ProcurementProgrammeRUMCRural Urban Marketing CentreSASouth AfricaSABSSouth African Bureau of StandardsSACUSouthern African Customs UnionSADCSouthern African Development CommunitySALTSouthern African Large TelescopeSAQASouth African Qualifications Authorityv
Municipal Economic Review and Outlook 2016SARBSouth African Reserve BankSARETECSouth African Renewable Energy Technology CentreSARSSouth African Revenue ServiceSATSASouthern Africa Tourism Services AssociationSAWISSA Wine Industry Information & SystemsSBIDZSaldanha Bay Industrial Development ZoneSDFSpatial Development PlanSEDASmall Enterprise Development AgencySEZSpecial Economic ZoneSIPStrategic Integrated ProjectSKASquare Kilometre ArraySMMESmall, Medium and Micro-Sized EnterprisesSPVSpecial Purpose VehicleStats SAStatistics South AfricaSUDSSustainable Urban Drainage SystemSWHSolar Water HeatingTBTuberculosisTDCATrade, Development and Co-operation AgreementUKUnited KingdomUSAUnited States of AmericaUSDUS DollarVATValue Added TaxWCWestern CapeWCBDCWest Coast Business Development CentreWCDWest Coast District MunicipalityWTBWool Testing BureauWWTWWaste Water Treatment WorksYOYYear-on-YearZARSouth African Randvi
SECTION A: BACKGROUND ANDMACROECONOMIC CONTEXT1.Introduction and background1.1IntroductionDistrict and local municipal entities have a role to play in economic development andeconomic performance in the areas under their jurisdiction. The 2016 MunicipalEconomic Review and Outlook (MERO) study is the 5th edition in a series of publicationsthat seek to provide in-depth economic analysis at a metro, district and municipallevel. The MERO research is however not intended to provide rigorous policyintervention but it may provide pointers for policy intervention.1.2Objective of the researchThe main objective of the study is to generate economic intelligence at the municipallevel, which can feed into municipal integrated development plans (IDPs) and localeconomic development strategies (LEDs) in the Western Cape Province. Theeconomic analysis focuses on the identification of bottlenecks and constraints thatmay be hampering private sector growth and employment creation. Both the privateand public sector can identify growth opportunities and risks and react upon them inthe current challenging macroeconomic environment.1.3Report outlineThe MERO 2016 study is structured as follows:Section A: Background and Macroeconomic context - this section provides theintroduction to the study and a broad overview of the macroeconomic outlook ofSouth Africa and the Western Cape. This section also provides an overview of thebackground to main sub-sections in order to avoid duplication within Section B. Thisincludes an overview of doing business in South Africa, Agri-parks, IDZs, SEZs,broadband connectivity, and an overview of SMMEs in the Western Cape.1
Municipal Economic Review and Outlook 2016Section B: Western Cape Regions - this section provides an economic review andoutlook of the Cape Town Metropolitan Area and all five non-metro regions inclusiveof the twenty-four local municipalities. This section provides an overview of each districtin terms of:Chapter 1: Regional economic review and outlook - provides a macroeconomicoutlook on the district level, an overview of trends between 2004 - 2015 and anoutlook in terms of GDP for 2016 - 2021. International trade is also considered in thissection; as well as top companies by size and employment operating in the area.Chapter 2: Sectoral growth, employment and skills per municipal area - provides amore in depth regional economic analysis by considering the trends in sectorgrowth, skills, and employment per municipal area. This section also provides anoverview of building plans passed and completed.Chapter 3: Value chains - provides an overview of two value chains per district.District municipalities were consulted and two value chains were chosen forMERO 2016 (take note that other value chains will be added in the consecutiveMEROs). The aim of the value chain is to understand the specific sector, and assessrisks and opportunities.Chapter 4: Infrastructure spending - review and analysis - provides the trends inmunicipal revenues and infrastructure spending. This section also looks at municipalbacklogs and infrastructure planning for the next 3 years.Chapter 5: Municipal socio-economic analysis - provides a socio-economic profileof the region, and shows the linkages between the sector growth profile of theregion and the socio-economic outcome.2.Macroeconomic outlook2.1IntroductionThe regional economies of the Western Cape are linked to both the national economyand the global economy. All Western Cape districts are impacted by fluctuations inthe national economy; therefore, each economy is open to global influences by bothtrade and financial channels. South Africa’s economy is very sensitive to the globalbusiness cycle developments as illustrated by international trade and financiallinkages. Additionally, the shortfall between domestic aggregate expenditure andaggregate production makes South Africa vulnerable to shifts in international capitalflows.2
Section A: Background and Macroeconomic contextFurthermore, South Africa’s stock of foreign financial assets and liabilities has increaseddramatically since the financial re-integration with the world economy. South Africahas a shallow new foreign exchange reserve position juxtaposed with its deep andwell-developed capital market. Both factors impact on a recipient economy’ssensitivity to fluctuations in international capital flows and financial stress in developedeconomies.2.2Global and SA economic outlookRecent macroeconomic changes have affected the economic outlooks acrosscountries and regions globally. These major macroeconomic changes include theslowdown and rebalancing in China; the further decline in commodity prices, i.e.crude oil, with sizable redistributive consequences across sectors and countries; arelated slowdown in investment and trade; and declining capital flows to emergingmarket and developing economies (IMF, 2016). The prolonged drought in South Africawhich started in 2015 is having an impact on the agriculture value chain and togetherwith inflation is having a negative impact on the local economy. These changes,together with a host of non-economic factors, including geopolitical tensions aregenerating substantial uncertainty. In general, they are consistent with a subduedoutlook for the world economy, but risks of much weaker global growth have also risen.Table 1 contains the short-term outlook for global economic growth according to theIMF projections. Growth in the USA fell to 1.4 per cent at an adjusted annual rate in thefourth quarter of 2015 (BEA, 2016). While some of the reasons for this decline are likelytemporary, the final domestic demand was weaker as well, with a decline in nonresidential investment, including outside the energy sector (IMF, 2016). Labour marketsstill show strength despite signs that growth stumbled in the first quarter of 2016(Mutikani, 2016). In particular, employment growth was very strong, labour forceparticipation rebounded, and the unemployment rate continued its downward trend,with a 4.5 per cent reading in March 2016 (IMF, 2016).The recovery in the Euro Zone in 2010 was more optimistic than projected in the2015 MERO. According to IMF (2016), amongst Euro countries, growth was weaker thanexpected in Italy but offset because growth was stronger in Spain. Japan’s economicgrowth came out significantly lower than expected during the fourth quarter of 2015,reflecting in particular a sharp drop in private consumption (IMF, 2016). Whereas,economic activity in other Asian advanced economies closely integrated with China- such as Hong Kong Special Administrative Region and Taiwan Province of China weakened sharply during the first half of 2015, owing in part to steep declines in exports(IMF, 2016).3
Municipal Economic Review and Outlook 2016Table 1World economic growth outlook 2016 - 2017f (%)2013201420152016f2017fWorld Output3.43.43.13.23.5Advanced Economies1.41.81.91.92United States2.22.42.42.42.5Euro g Market and Developing Economies5.04.64.04.14.6Commonwealth of Independent States ding 96.56.2India6.97.37.37.57.5Latin America and the iddle East, North Africa, Afghanistan, and Pakistan2.41.32.53.13.5Sub-Saharan Africa5.55.03.43.04.0South Africa2.21.51.30.61.2CountryEmerging and Developing AsiaSource: IMF World Economic Outlook, April 2016 (f denotes forecast)Economic growth increased by less than expected during the second half of 2015, asdomestic demand remained subdued and the recovery in exports was relativelymodest, reflecting resilient domestic demand, especially consumption. Robust growthin the services sector offset recent weakness in manufacturing activity (IMF, 2016). InLatin America, the economic downturn in Brazil was deeper than previously expected,while economic activity for the remainder of the region was in line with forecasts.Similarly, the recession in Russia (2015) was also in line with expectations, howeverconditions worsened in the former Soviet Union States’ (CIS) economies, displaying spillovers from the macroeconomic effects in Russia, as well as the adverse impact of loweroil prices on net oil-exporting countries (IMF, 2016).Macroeconomic indicators suggest that economic activity in Sub-Saharan Africa andthe Middle East also fell short of expectations, a result of the drop in oil prices, declinesin other commodity prices, and geopolitical and domestic conflict in a few countries.Moreover, geopolitical tensions have not only domestically affected economies, butalso the global economic outlook. Specifically, output contractions in 2013 werereflected by tensions in Ukraine, Libya, and Yemen and accounted for half apercentage point of global GDP, which subtracted 0.1 percentage point from globaloutput during 2014 - 2015 (IMF, 2016). Additionally, the depression of investmentsworldwide - particularly in energy and mining - as well as the deceleration of China’smanufacturing activity has caused a weakness in investment. Thus, global industrialproduction, particularly of capital goods, remained subdued throughout 2015(IMF, 2016).4
Section A: Background and Macroeconomic contextSouth Africa's trade relations and development co-operation with the European Union(EU) are currently governed by the Trade, Development, and Co-operationAgreement (TDCA). The TDCA has established a free trade area that covers 90 percent of bilateral trade between the EU and South Africa. The liberalisation scheduleswere completed by 2012. In June 2016, South Africa signed EU - SADC EconomicPartnership Agreement (EPA) together with 5 other Southern African countries(Botswana, Lesotho, Mozambique, Namibia, and Swaziland). Once ratified, the EPAwill replace the TDCA (European Commission, 2016). The EU-SADC EPA entails (EU,2016):x Under the SADC EPA, the EU will guarantee Botswana, Lesotho, Mozambique,Namibia, and Swaziland 100 per cent free access to its market. The EU has also fullyor partially removed customs duties on 98.7 per cent of imports coming from SouthAfrica. The SADC countries do not have to respond with the same level of marketopenness. Instead, they can keep tariffs on products sensitive to internationalcompetition.x The EPA contains a large number of "safeguards" or safety valves. EPA countries canactivate these and increase the import duty in case imports from the EU increaseso much or so quickly that they threaten to disrupt domestic production.x Make it much easier for SADC EPA countries to benefit from reduced EU customsduty rates for their textiles products using on imported fabric. This will benefit textileindustry in countries such as South Africa or Lesotho.x Eliminates the possibility for the EU to use agricultural export subsidies.South Africa’s vulnerable economy could be placed at greater risk of recession afterthe news on 24 June 2016 of Britain’s decision to exit the EU. A large current accountdeficit and negative economic growth mean that the South African economy can betipped into a recession which would adversely affect jobs. There are four transmissionchannels through which the Brexit can hit South Africa (Rensburg, 2016):1. Markets - whenever there is a global shock, investors move straight to the safestasset, which is a US bond. All that money flowing into the US bond market comesfrom somewhere – namely from emerging markets across the world. South Africa isparticularly vulnerable to outflows because the country has a large currentaccount deficit. If capital flight continues, interest rates could be raised.2. Trade - the UK buys 10 per cent of South Africa’s exported wine, 10 per cent ofexported citrus fruit, and 21 per cent of exported grapes. The UK will have two yearsto extricate itself from the EU, but the Brexit will ultimately completely upsetnumerous institutional setups around the world. The Brexit will also impact the newEU-SADC EPA trade deal. Treasury seems to be hoping for one particular optionopen to Britain: to join the existing European Free Trade Area (EFTA) for non-EUEuropean states. This gives the UK back its access to the EU market, with SouthAfrica also benefiting since the customs union already has an agreement withEFTA.5
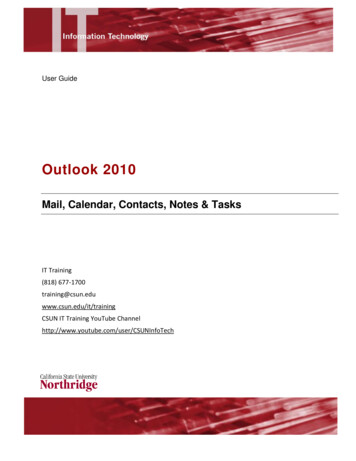
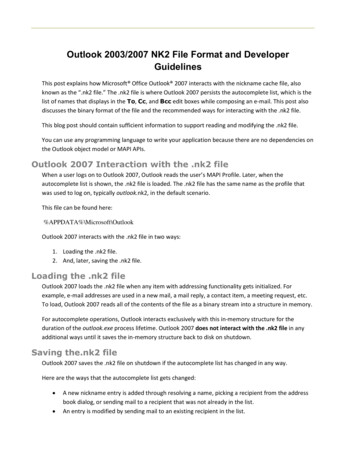
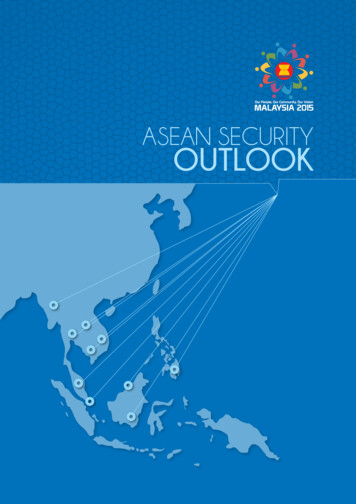
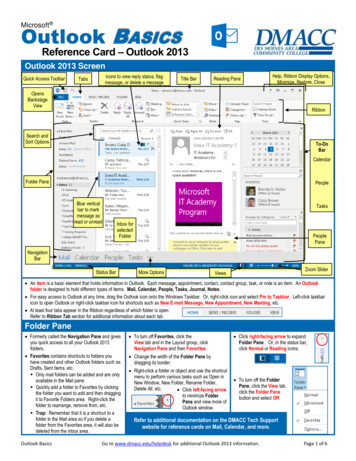
Municipal Economic Review and Outlook 20163. The UK could also simply choose to pursue bilateral trade deals on its own something it has not done for decades.4. Currency - a more direct effect on South Africa’s economy comes from the Britishpound’s depreciation as has occurred on Friday 24 June 2016, when it fell 4 percent against the rand. This means the British will pay more for everything theyimport, but theoretically increases the competitiveness of their exports.Figure 1 indicates that global manufacturing growth during the first quarter of 2016 wasthe weakest since the second quarter of 2013, which followed a slowdown in thesecond half of 2015 (CME Group Inc, 2016). In advanced economies, the unexpectedweakness in late 2015 was notable, especially in the United States, but even more soin Japan. Emerging market economies are quite diverse, emerging economies in Asia,including China, continue to sustain high growth. Global macroeconomic conditionshave affected Brazil, Russia, and a number of other developing economies (IMF, 2016).Figure 1Global manufacturing Purchasing Manager’s Index slowdown (quarterly)53.553.052.52015 152016 Q1Global Manufacturing PMISource: Markit Economics and CME Group, 2016The slowdown in global trade has contributed to recent falls in commodity prices.Although global trade has recovered since the sharp decline in the first half of 2015,world trade volumes grew by only 2 per cent, which is in line with very low outcomes inglobal GDP growth (Figure 2). Weakness of trade growth can be explained by lowinvestment, and declines in commodity prices, however, recent weaknesses centredon Asia remains partly unexplained (OECD, 2016). The contraction of imports by majoremerging market economies has contributed to weaker export demands foradvanced economies with an estimated drag on OECD GDP growth of approximatelyhalf a percentage point in 2015.6
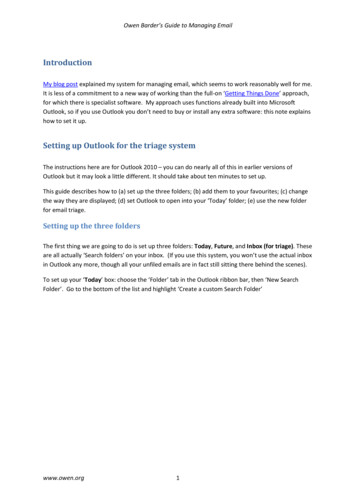
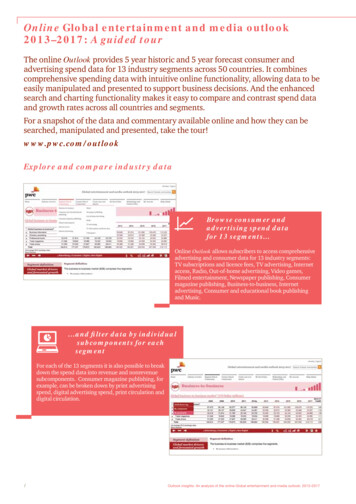
Section A: Background and Macroeconomic contextFigure 2Slowdown in global trade growth (annually)151050-5-10-152000200220042006World Trade2008201020122014World GDPNote: World trade is goods plus services trade volumes. World GDP growth is measured at purchasingpower parities.Source:OECD Economic Outlook database, 2016Along with global trade growth, commodity prices have fallen significantly. Oil priceshave declined by more than one-third and are reaching their lowest level in USD termssince 2003. The price decline across commodities in recent months, along with thesharp decline in China’s commodity imports in the first quarter of 2016, after continuedgrowth in 2015, suggests that weak demand has contributed to lower commodityprices. These price developments should support consumption of commodities inimport economies; however, it may confine investments and cause financial pressureson firms and exporting countries (OECD, 2016). Coal and natural gas prices alsodeclined, as the latter are linked to oil prices. Non-fuel commodity prices - metal andagricultural commodities - declined by 9 per cent and 4 per cent respectively.Global inflationSince the global financial crisis (2008), the headline inflation rate in advancedeconomies in 2015 was low at 0.3 per cent, on average, most likely due to the declinein commodity prices in the second part of 2015. The stable core global inflation rate at1.6 - 1.7 per cent was below the central bank target (Figure 3). However, manyemerging market and developing economies, lower prices in oil and othercommodities have tended to reduce inflation (IMF, 2016). However, many countries,including Brazil, Columbia, and Russia, had large depreciations that have offset theglobal inflation and affected the lower commodity prices.The strengthening in advanced economies’ currencies has caused commodityexporters with stagnant exchange rates to weaken further. The Japanese yen’sappreciation of 10 per cent was very sharp, while the US dollar and the Eurostrengthened by about 3 per cent and 2 per cent respectively (IMF, 2016). However,the British pound depreciated by 7 per cent because of their exit from the EuropeanUnion.7
Municipal Economic Review and Outlook 2016Figure 3Annual global 012201320142015Inflation RateSource: The World Bank, 2016Emerging market currencies depreciated sharply recently, especially in South Africa,Mexico, Russia, and Columbia. The Chinese Renminbi depreciated by about 2 percent, while the Indian Rupee remained stable. Similarly, the decline in demand foremerging market assets also reflects a slowdown in capital flows. This decline was steepduring the second half of 2015 – the first time since the global financial crisis - with netsales on foreign investments lower in emerging markets (IMF, 2016).The global quantity of economic production (global output) is estimated to havegrown by 3.1 per cent in 2015, with 1.9 per cent growth for advanced economies and4 per cent growth for emerging market and developing economies. For 2016 globalgrowth is projected to remain modest at 3.2 per cent, before picking up to 3.5 per centin 2017 (IMF, 2016). Emerging market and developing economies will account for alarge share of the world growth rate, yet their growth rate is projected to only increasemodestly in comparison to past decades. These growth projections are reflected by acombination of factors: weakness in oil-exporting countries; a moderate slowdown inChina; and a weak outlook for exporters of non-oil commodities (Global EconomicProspects, 2016).South African industry growthIn the first quarter of 2016 a sharp contraction in the mining industry tipped economicgrowth into negative territory (Statistics SA, 2016). The South African economyunderperformed previous growth projections by shrinking 1.2 per cent, quarter-onquarter (q-o-q), according to the latest GDP figures published by Stats SA. The miningindustry (18.1 per cent contraction) was the largest contributor to the q-o-qcontraction (Figure 4). During the first quarter of 2016 the lower production in mining of‘other’ metal ores, primarily platinum and iron ore were the contributors to this decline.Mining aside, the economy experienced a growth rate of 0.5 per cent (Statistics SA,2016).8
Section A: Background and Macroeconomic contextDue to the ongoing drought, the agricultural industry has fallen by 14 per cent sincethe last quarter of 2015. This slowdown, along with the lower production in miningaffected the demand for energy, contracting by 2.8 per cent in the first quarter of2016. According to Stats SA, the transportation industry recorded its secondconsecutive q-o-q fall, now joining agriculture in recession territory. Specifically, a fallin the demand for freight and passenger land transportation has contributed to thedecline in the industry.Figure 4Industry growth in 2016 sport-2.7%Construction0.5%Personal Finance-25%1.9%-20%-15%-10%-5%0%5%10%15%20%Growth RateSource:Statistics SA, 2016South Africa gross domestic product, supply and demandThe recessionary decline less than a decade into the 21st century has affectedeconomic growth in South Africa over the last four years. The South African economyadvanced by an annualised 0.4 per cent in the 4th quarter of 2015, compared to a0.3 per cent growth in the previous quarter (Figure 5). According to Stats SA, the firstquarter of 2016 reported a GDP growth rate of -1.2 per cent. This decline in economicgrowth is accompanied by the -18.1 per cent decline in mining and quarrying, -6.5 percent decline in agriculture production, and the -2.8 per cent decline in the electricity,gas, and water employment sectors (Peyper, 2016). The macroeconomic indicators inthe South African economy affect the GDP at market
NHBRC National Home Builders' Registration Council OECD Organisation for Economic Co-operation and Development PDO Protected Designation of Product of Origin PGI Protected Geographic Indication PMI Purchasing Managers Index PV Photovoltaic q-o-q Quarter-on-Quarter QCTO Quality Council for Trade and Occupations