Transcription
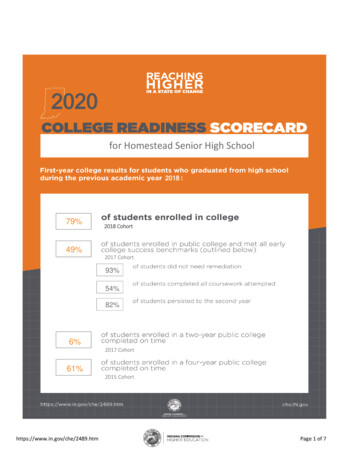
2020for Homestead Senior High School201879%2018 Cohort49%2017 Cohort93%54%82%6%2017 Cohort61%2015 Cohorthttps://www.in.gov/che/2489.htmPage 1 of 7
2018 High School Graduates: Homestead Senior High SchoolCOLLEGE GOING FOLLOWING HIGH SCHOOL GRADUATIONHigh School Graduates Enrolling in College# of HSGraduates# Enrolled inCollege% Enrolled inCollegeHonors31229394%Core 4019213168%General41922%Graduated with Waiver16425%Graduated without Waiver52942981%Took and Passed an AP Test18717694%Took but Did Not Pass an AP Test1079993%Did Not Take an AP Test25115863%Earned Dual Credit from an Indiana Public College42136486%Did Not Earn Dual Credit from an Indiana Public College1246956%21st Century Scholar242396%Non 21st Century Scholar52141079%Free or Reduced Lunch453373%Non Free or Reduced Lunch50040080%White44135280%Black261973%Hispanic or kdownHigh School Diploma TypeHigh School Graduation Waiver StatusAdvanced Placement StatusDual Credit Status21st Century Scholar StatusSocioeconomic StatusRace/EthnicityAll Studentshttps://www.in.gov/che/2489.htmPage 2 of 7
2018 High School Graduates: Homestead Senior High SchoolHigh School Graduate Enrollment by College TypeIndiana Public College309% of Total HSGraduates56.7%Indiana Private College (non-profit)6111.2%Indiana Private College (for-profit)10.2%Out-of-State Public College397.2%Out-of-State Private College (non-profit)234.2%Out-of-State Private College (for-profit)00.0%Non-degree Granting School00.0%Indiana State-Affiliated Public00.0%11220.6%# Enrolled in INPublic College% of Total Enrolled inIN Public CollegeBall State University4514.6%Indiana State University20.6%University of Southern Indiana10.3%Indiana University-Bloomington7022.7%Indiana University-East20.6%Indiana University-Kokomo00.0%Indiana University-Northwest00.0%Indiana University-Purdue University-Indianapolis258.1%Indiana University-South Bend10.3%Indiana University-Southeast00.0%Purdue University-Fort Wayne8126.2%Purdue University-Northwest00.0%College TypeDid Not Enroll in College# of HS GraduatesINDIANA PUBLIC COLLEGE ENROLLMENTIndiana Public College Enrollment by CollegeCollegePurdue University-Polytechnic Statewide00.0%Purdue University-West Lafayette4815.5%Ivy Tech Community College3310.7%Vincennes University10.3%https://www.in.gov/che/2489.htmPage 3 of 7
2018 High School Graduates: Homestead Senior High SchoolIndiana Public College Enrollment by Degree Type# Enrolled in INPublic College% of Total Enrolled inIN Public CollegeBachelor's Degree (four-year)27589.0%Associate Degree (two-year)309.7%Award of at least 1 but less than 2 academic years41.3%Award of less than 1 academic year00.0%Unclassified undergraduate00.0%# Enrolled in INPublic College% of Total Enrolled inIN Public CollegeArts and Humanities3612%Business and Communication5417%Education248%Health3712%Science, Technology, Engineering, and Math (STEM)8628%Social and Behavioral Sciences and Human Services299%Trades165%Undecided279%# Enrolled in INPublic College% of Total Enrolled inIN Public CollegeFull-Time Students29194%Part-Time Students186%Degree TypeIndiana Public College Enrollment by Program TypeProgram TypeIndiana Public College Enrollment by StatusStatusACADEMIC PREPARATIONIndiana Public College Remediation by Subject# Enrolled in INPublic College% of Total Enrolled inIN Public College# EarningRemedialCredits% EarningRemedial CreditsMath Only103%550%English/Language Arts Only21%******Both Math and English/Language Art10%******29696%----SubjectNo Remediationhttps://www.in.gov/che/2489.htmPage 4 of 7
2018 High School Graduates: Homestead Senior High SchoolIndiana Public College Students Needing RemediationBreakdown# Enrolled# Earning % Earning# Needing % Needingin IN PublicRemedial RemedialRemediation RemediationCollegeCreditsCreditsHigh School Diploma TypeHonors20510%******Core 40***************General***************Graduated with Waiver***************Graduated without Waiver***************Took and Passed an AP Test12722%******Took but Did Not Pass an AP Test5923%******Did Not Take an AP Test12397%******26242%******47919%******21st Century Scholar21210%******Non 21st Century Scholar288114%******Free or Reduced Lunch26312%******Non Free or Reduced ****Hispanic or 09134%862%High School Graduation Waiver StatusAdvanced Placement StatusDual Credit StatusEarned Dual Credit from an Indiana Public CollegeDid Not Earn Dual Credit from an Indiana PublicCollege21st Century Scholar StatusSocioeconomic StatusRace/EthnicityAll Studentshttps://www.in.gov/che/2489.htmPage 5 of 7
2018 High School Graduates: Homestead Senior High SchoolSTUDENT PERFORMANCEIndiana Public College Student Performance# Enrolled in INPublic CollegeAverage FreshmanYear GPAAverage FreshmanCredit HoursEarnedHonors2053.228.55Core 40*********General*********Graduated with Waiver*********Graduated without Waiver*********Took and Passed an AP Test1273.228.72Took but Did Not Pass an AP Test592.825.91Did Not Take an AP Test1232.621.962623.026.61472.219.2821st Century Scholar212.723.52Non 21st Century Scholar2882.925.64Free or Reduced Lunch262.522.96Non Free or Reduced nic or me Students2912.926.26Part-Time Students182.413.063092.925.49BreakdownHigh School Diploma TypeHigh School Graduation Waiver StatusAdvanced Placement StatusDual Credit StatusEarned Dual Credit from an Indiana Public CollegeDid Not Earn Dual Credit from an Indiana PublicCollege21st Century Scholar StatusSocioeconomic StatusRace/EthnicityEnrollment StatusAll Studentshttps://www.in.gov/che/2489.htmPage 6 of 7
2018 High School Graduates: Homestead Senior High SchoolData Sources: Indiana Commission for Higher Education (CHE); Indiana Department of Education (IDOE), NationalStudent Clearinghouse (NSC)NOTES:High School Graduates ;͞Students͟Ϳ͗ Count of Indiana high school graduates and associated disaggregations are basedon the total count of graduates reported on the IDOE-GR report for 2018. Graduate counts are not IDOE cohortgraduate counts and thus may not match cohort graduate counts and associated disaggregations reported in otherplaces, such as DOE Compass. SOURCE: IDOESocioeconomic Status: Enrollment status in the Federal Free and Reduced Price School Meals program during astudent͛s senior year in high school. SOURCE: IDOEHigh School Diploma Type: High school diploma type received upon high school graduation. Honors represents studentswho received an Academic Honors Diploma, an Academic and Technical Honors Diploma, or an InternationalBaccalaureate Diploma. Core 40 represents students who received a Core 40 Diploma or a Technical Honors Diploma.SOURCE: IDOECollege Enrollment: Represents students reported as enrolled in postsecondary education, regardless of institutiontype, within the year following high school graduation (e.g., for 2018 high school graduates, postsecondary enrollment iscounted for 2018-19 school year). A student was considered enrolled only if: a) they were enrolled as a degree orcertificate-seeking undergraduate student and b) s/he was enrolled for the equivalent of at least one semester duringthe school year. SOURCES: NSC, CHEIndiana Public College Enrollment: Represents students reported as enrolled in an Indiana public postsecondaryinstitution. SOURCE: CHE21st Century Scholar Status: Represents students who were eligible for affirmation and affirmed. Students who wereenrolled in K-12 as Scholars but did not affirm, or students who affirmed but were not eligible, are not considered 21stCentury Scholars for this report. SOURCE: CHEAP Participation/Passing Exam Status: Represents students who sat for and/or passed (received score of 3 or higher) atleast one Advanced Placement exam. SOURCE: IDOEDual Credit Status: Represents students who earned/did not earn credit hours awarded by Indiana public colleges thatwere recognized by both the high school and the postsecondary institution. Dual credit calculations only include creditsawarded by Indiana publics. SOURCE: CHEFull-time/Part-time Enrollment Status: Full-time enrollment defined as enrolled in 12 or more credits in the semester ofentry at an Indiana public college. Part-time enrollment defined as enrolled in fewer than 12 credits in the semester ofentry at an Indiana public college. SOURCE: CHERemediation Enrollment: Represents Indiana public college students identified as deficient in the general competenciesnecessary for regular postsecondary curriculum in English/language arts and/or mathematics. Students enrolled in bothcredit and non-credit remedial coursework are included in remediation totals. SOURCE: CHERemediation Success: Represents Indiana public college students who successfully complete the subject(s) in whichthey were identified as needing remediation. Students who were identified as needing remediation in bothEnglish/language arts and math needed to successfully complete both English/language arts and math in order to becounted as earning remedial credit. SOURCE: CHEFreshman GPA: Represents cumulative grade point average for the latest term of enrollment at an Indiana publiccollege in the year following high school graduation. SOURCE: CHEFreshman Credit Hours Earned: Represents average number of institutional credits earned during the year followinghigh school graduation at an Indiana public college. SOURCE: CHE***Not Applicable/Suppressed Data: Data may be missing either because no data were available or fewer than 10students were in a group and the data had to be suppressed for privacy reasons. In some cases, at least two groups ofstudent data had to be suppressed because of complementary suppression ruleshttps://www.in.gov/che/2489.htmPage 7 of 7
2018 High School Graduates: Homestead Senior High School. Indiana Public College Enrollment by Degree Type Degree Type # Enrolled in IN Public College % of Total Enrolled in IN Public College Bachelor's Degree (four-year) 275 89.0% Associate Degree (two-year) 30 9.7%