Transcription
The Organizational Structure & Spatial Dynamics of Investment AdvisoryServices: The Case of Metropolitan Philadelphia, 1983-2003John E. BodenmanDepartment of Geography and GeosciencesBloomsburg UniversityBloomsburg, PA 17815ABSTRACTThis article examines the organizational structure and spatial dynamics of the institutionalinvestment advisory industry, 1983-2003, focusing on the Philadelphia Metropolitan Area.Traditionally, high order financial services located in Pennsylvania like institutional investmentadvisory services have been concentrated in the Philadelphia Central Business District (CBD).However, analysis of the industry's organizational structure and spatial dynamics over the 19832003 study period indicates significant growth of the industry within the PhiladelphiaMetropolitan Area, but relative decline within the traditional core--the Philadelphia CBD. TheMoney Management Directory of Pension Funds and their Investment Advisors (1983-2003)provides the data for the analyses. Maps and tables describe the institutional investmentadvisory industry's spatial organization at both the inter- and intrametropolitan scales.Key words: investment advisory services, financial services, locationINTRODUCTIONThe tremendous growth of the multitrillion dollar institutional investmentadvisory industry 1 over the 1983-2003study period, is emblematic of thenation's transition to an "informationeconomy" (Hepworth 1990; 1991). Withover 18 trillion in total assets undermanagement in 2003, the location ofinstitutional investment advisory firmsrepresent financial "control points" in thenation's economic geography (Borchert1978; Green 1993; Graves ve financial servicesproviders like institutional investmentadvisoryfirmshavetraditionallyanchored downtowns (Stanback 1991;Carlino 2001), and thus their locationaldynamics should be of particular interest1 The investment advisory industry consists of investmentadvisory firms that manage the securities portfolios ofinstitutional clients for a fee.to all concerned with the vitality of urbancenters in the United States.The great majority of research exploringthe locational dynamics of financialservicesactivitiessuggeststhatinformation intensive financial servicesare disproportionately concentrated in thecores of the largest metropolitan areasdue to (1) the importance of trusted faceto-face contacts in the decision makingprocess at the highest level, (2) theexistence of a business/social milieu, (3)prestige of a given place, (4) theimportance of fixed assets in the CentralBusiness District (CBD) that could bedevalued in the case of owner exodus, and(5) agglomeration of ancillary services,including networks, telecommunications,and "knowledge spillovers" (Carlino 2001;Clark 2000; Daniels 1993; Sassen 1991;Castells 1989). More specifically, thereis general agreement that spatialconcentration in high order urban centerspromote: (1) opportunities for backwardThe Industrial Geographer, Volume 2, Issue 2, pp.128-146 2004 Bodenman
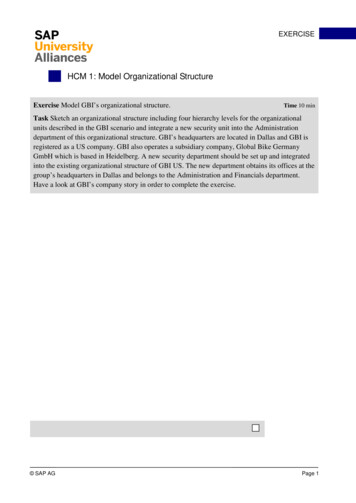
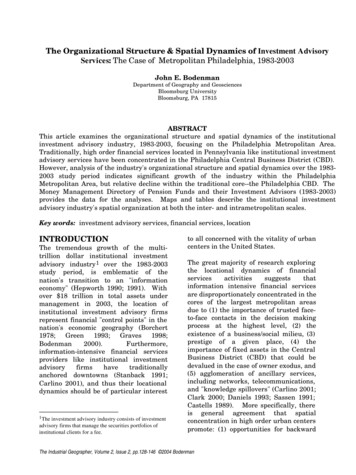
The Industrial Geographerlinkages (i.e., database services, businessand financial information services,computer and other technical services);and (2) opportunities for forward linkages(i.e.,markets).Theoretically,concentration allows firms to maximizeopportunities for both forward andbackward linkages, and minimize thetransaction costs associated with theproduction and delivery of financialservices (Bloomfield et al. 2000; Lee 2000;Daniels 1993).companies to 8%. Though pension funds(tax-exempt assets) are by far the largestsource of managed funds, investmentadvisory firms also take in billions ofdollarsfromprofit-sharingplans,employee savings plans, unions, state andlocal governments, endowments, andfoundations.The primary investmentvehicles are transferable securities andequity products that include stocks,bonds, commercial paper and derivativeproducts like futures, options and swaps.Table 1a lists the top twenty investmentadvisory firms in the United Statesranked by total tax-exempt assets undermanagement in 2003. Table 1b lists thetop twenty investment advisory firmslocated in the state of Pennsylvania.NotethatthelargestfirminPennsylvania, The Vanguard Group(Table 1b), is the fourth largest advisoryfirm in the United States (Table 1a).Thisarticlewillhighlighttheorganizational structure and locationaldynamics of the investment advisoryindustry in Pennsylvania, 1983-2003,focusing on Metropolitan Philadelphia.First, I will provide a general backgroundof the institutional investment advisoryindustry in Pennsylvania. Second, I willprovide an overview of the Money MarketDirectory data sets used for the tables,maps, and figures compiled for analysis.Finally, I will conclude with severalsuggestions for the direction of futureresearch on this topic.The purpose of this article is to examinethe locational dynamics of the investmentadvisory industry in the state ofPennsylvania.Theinstitutionalinvestment management business--themanagement of pension and endowmentassets for a fee--is an excellent example ofan important information intensivefinancial services industry that has growndramatically over the 1983-2003 studyperiod.Geographical analysis of theinstitutionalinvestmentadvisoryindustry at both the inter- and intrametropolitan scales will provide a basisfor examining the extent to whichconcentration, dispersal and/or bothprocesses are operating with respect tothe industry's locational pattern withinPennsylvania as the information economycontinues to mature.BACKGROUNDUntil the 1970s, the vast majority ofinvestment managers and their tradersworked for banks and insurancecompanies.Independent investmentadvisory firms of any size first appearedin the early 1960s and proliferated in the1970s and 1980s, when clients begandemanding more aggressive investmentstrategies. Figure 1 illustrates that, in1983, independent investment advisoryfirms (also referred to as investmentmanagement firms) managed 30% of thetotal assets under management, whilebanks and trusts ran 34%, and insurancecompanies 35%. By 2003, independentinvestment advisory firms had increasedtheir share of managed assets to morethan 86% of the 21.3 trillion in totalassets under management, with banksand trusts dropping to 4% and insuranceBodenmanDATA AND ANALYSISThe data to map investment eobtainedfromStandard & Poor’s: The Money Market129
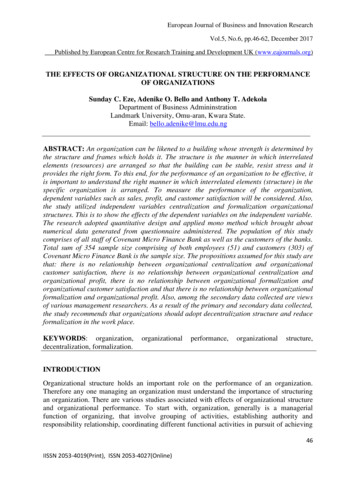
The Industrial GeographerDirectory of Pension Funds and TheirInvestment Managers (1983; 2003).Based on both SEC licensing informationand individual firm surveys, the directoryprovides a profile of every institutionalinvestment management firm managingassets for a tax-exempt fund sponsorheadquartered in the United States withover 1 million in total assets. The assetsunder management include corporate,state and local government, and unionplan sponsored employee benefit funds(all tax-exempt), as well as endowmentand foundation funds (also tax-exempt).and 76.3% of the total firms with assetsunder management in 1983.By 2003, total tax-exempt assets undermanagement had grown to 7.9 trillion,and the number of investment advisoryfirms to 897 (Table 2b). Figures 1b and2b illustrate the tremendous growth ofassets under management in thetraditional core (New York, Boston,Chicago, Los Angeles and San Francisco),but also in an increasing number of newlyemerging centers. By 2003, Philadelphiais ranked 5 ahead of Chicago with 5.4% oftotal assets, and 2.8% of total firms.Overall,thetotalassetsundermanagement in the top 20 MSAsincreased to nearly 7.2 trillion, but thetop 20 MSAs share of the total decreasedfrom 94.4% (Table 3a and Figure 1a) to91.8% percent (Table 3b and Figure 2a).Similarly, the top 20 MSAs share of totalfirms decreased from 76.3% in 1983(Table 3a and Figure 2a) to 67.4% in 2003(Table 3b and Figure 2b).In n scale, albeit in arelatively small number of newlyemerging centers.Institutional investment advisory firmsproduce a constantly evolving and variedmix of products and services that are soldto institutional investors, clients with aminimum of 1 million tax-exempt assetsinvested. Defining and measuring theaggregate value of the output produced bythe industry is problematic. However,given that investment advisory firmrevenues (fees) are based on a percentageof the assets they have undermanagement,totalassetsundermanagement serves as a surrogatemeasure of the industry's output, andrelative asset size provides an indicator ofthe market shares held by individualfirms, as well as the changes in sharesover time.Geographically, the 532 institutionalinvestment advisory firms with over 411billion in assets under management in19832 were located in 133 cities in 30states across the nation (Table 2a). By2003, the total number of firms managingtax-exempt assets had grown to 897 firmswith nearly 7,937 trillion in assets undermanagement located in 287 cities in 46states (Table 2b). By 2003, the state ofPennsylvania ranked fourth overall, withnearly 525 billion under management by51 firms (Table 2b). Figures 1a and 2aillustrate the spatial distribution ofassets under management and number BUTIONTable 3a indicates that in this initialyear, the top ranked MSAs by percent oftotal assets and percent of total firmsincluded New York, Boston, Chicago, SanFrancisco, and Los Angeles. The highestranked MSA in the state of Pennsylvaniawas Philadelphia, ranked 8 th behindHouston and Baltimore with 2.9% of totalassets, and ranked 6th behind Los Angeleswith 3.8 % of total firms. Overall, the 20highest-ranking MSAs accounted for94.4% of the assets under management,2 All 1983 assets are reported in constant 2003 dollars.Bodenman130
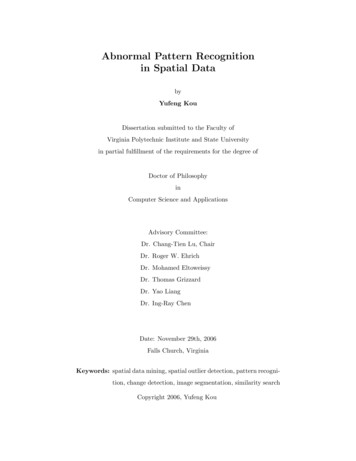
The Industrial Geographermetropolitan area in 1983--a total of 411billion under management by 532 firms. 525 billion in tax-exempt assets undermanagement.Furthermore,thePhiladelphia MSA (ranked 5th ahead ofChicago) and the Pittsburgh MSA(ranked 11th ) had a combined 520 billionin tax-exempt assets under managementbetween them in 2003, or over 98 percentof the total assets under management inthe state of Pennsylvania (Table 3b).But what about the investment advisoryindustry's ties to the central businessdistrict (CBD)? Are these weakening aswell? Are the deconcentration trends atthe intermetropolitan level also occurringat the intrametropolitan level? Tables 4aand 4b indicate that the top 20 rankedCities (the urban cores of MSAs) share oftotal assets and total firms declined from90.2% and 65.2% respectively in 1983(Table 4a), to 88.3% and 39.7%respectively in 2003 (Table 4b). Certainlyof note is New York City’s drop from 1st to2ndbehind Boston in the wake ofSeptember11, 2001. However, also ofnote is the emergence of new centers suchas Malvern (6), Plainsboro (7), Pasadena(13), Cambridge (18), Purchase (19), andWestport (20). Overall, the emergence ofnew centers, and the decreasing relativeshares of the traditional investmentadvisory urban cores 1983-2003, suggeststhat deconcentration is also taking placeat the intrametropolitan level.However, data at the intrametropolitanscale (Tables 4a and 4b) indicatesignificant relative decline for the city ofPhiladelphia relative to the suburbs.Table 4a indicates that in 1983 the city ofPhiladelphia ranked 9th overall in assetsunder management, and 6th overall intotal firms. By 2003, however, Table 4bindicates that the city of Philadelphiafalls out of the top 20 with 32 billionunder management. The Philadelphiasuburb of Malvern, however, appears inthe top 20, ranked 6th overall in totalassets with 291 billion, more than thecity of Pittsburgh ( 119 billion) andPhiladelphia ( 32 billion) combined.In Figure 3a, Philadelphia stands out asthe investment management center ofPennsylvania, the location to firms with 8.9 billion in tax-exempt assets undermanagement in 1983, representing 65.7percent of the total tax-exempt assetsunder management in Pennsylvania(Table 5).By 2003 (Figure 3b), thesoutheast corner of the state still appearsto be the center of the industry, butPhiladelphia is no longer the top city interms of total assets under management.INTRAMETROPOLITANDISTRIBUTIONAs discussed earlier, the investmentadvisory firms with tax-exempt assetsunder management in 1983 were locatedin 133 cites in 30 states across the nation(Table 2a). By 2003, the number of citiesand towns with firms managing taxexempt assets had grown to 287 in 46states (Table 2b). Where is investmentadvisory industry growth occurring? Inthe traditional financial centers of eachrespective state? Or in new locationsoutside of the traditional financialcenters?Table 5 indicates that Malvern, home ofThe Vanguard Group, is ranked first in2003 with over 291 billion in totalassets, followed by Pittsburgh (2nd) withnearly 120 billion, almost four times theassets under management in the city ofPhiladelphia (4th ) with 32 billion. Alsoahead of Philadelphia is the suburb ofFocusing on Pennsylvania, Table 2bindicates that the state ranks 4th behindNewYork,California,andMassachusetts, and is home to 51investment advisory firms with nearlyBodenman131
The Industrial GeographerFigure 1: Percent of Total Assets Under Management by Type of Investment Manager,1983 and 2003.1009080706050403020100Investment AdvisorsBanks and TrustsInsurance CompaniesReal Estate AdvisorsType of Investment ManagerPercent of Total Assets, 1983Percent of Total Assets, 2003Source: Money Market Directory, 1983; 2003.Table 1a:Top 20 Investment Advisory Firms in United States Ranked byTotal Tax-Exempt Assets Under Management, 2003Rank123456Firm NameBarclays Global InvestorsState Street Global AdvisorsFidelity Management & Research Co.The Vanguard GroupMerrill Lynch Investment ManagersCapital Research Mangement Co.7Pacific Investment Management Co.891011121314151617181920J.P. Morgan Fleming Asset ManagementUBS Global Asset ManagementAlliance Bernstein Inst. Investment ManagementDeutsche Asset ManagementINVESCOMorgan Stanley Investment ManagementGoldman, Sachs & Co., Asset ManagementBanc One Investment Advisors Co.Evergreen InvestmentsGeneral Motors Investment ManagementCDC IXIS Asset Management North AmericaBlackRock, Inc.Western Asset ManagementSource: Money Management Directory, 2003.Bodenman132CitySan FranciscoBostonBostonMalvernPlainsboroLos AngelesNewportBeachNew YorkChicagoNew YorkNew YorkAtlantaNew YorkNew YorkColumbusBostonNew YorkBostonNew YorkPasadena 863111,447107,40093,00087,51187,502
The Industrial GeographerTable 1b:Top 20 Investment Advisory Firms in Pennsylvania Ranked byTotal Tax-Exempt Assets Under Management, 2003RankFirm NameCity Millions1The Vanguard GroupMalvern290,4942Mellon Bond AssociatesPittsburgh62,2503Gartmore GroupConshohocken39,7584Federated InvestorsPittsburgh32,3675Mellon Equity AssociatesPittsburgh18,4256Delaware Investment AdvisersPhiladelphia18,0367Rittenhouse Financial ServicesRadnor9,0198Aronson & PartnersPhiladelphia6,3119Rorer Asset Mgmt.Philadelphia5,86210Turner Investment Partners, Inc.Berwyn4,67411Chartwell Investment PartnersBerwyn4,49212Geewax, Terker, & Co.Chadds Ford3,38213MDL CapitalPittsburgh3,12714Wellington Management CompanyRadnor2,971151838 Investment AdvisorsKing of Prussia2,87716McGlinn Capital Mgmt. Inc.Wyomissing1,93717Valley Forge Asset ManagementValley Forge1,85018C.S. McKee & Co. Inc.Pittsburgh1,79119Schneider CapitalWayne1,58120Cooke & Bieler, Inc.Philadelphia1,329Source: Money Management Directory, 2003.Table 2a:Percentage of Total Tax-Exempt Assets and Percentage of Total Firms with Tax-Exempt AssetsUnder Management in the Top 20 States, 1983.RankStateMillions*Firms% ofTotalAssets1234567891011121314151617181920New sPennsylvaniaMarylandMinnesotaGeorgiaNew MissouriKentuckyColoradoOthers (10 states)Total (30 62100.001983 in# of*1983 Assets reported in constant 2003 dollars.Source: Money Market Directory, 1983.Bodenman133% of 00
The Industrial GeographerTable 2b:Percentage of Total Tax-Exempt Assets and Percentage of Total Firms withTax-Exempt Assets Under Management in the Top 20 States, 2003.2003 in# of% of Total% of 68.253New 605.695Illinois359,823574.536.356New 61.3415North 61.34Others (26 states)133,070871.689.70Total (46 states)7,936,568897100.00100.00Source: Money Market Directory, 2003.Bodenman134
The Industrial GeographerTable 3a:Percentage of Total Tax-Exempt Assets and Percentage of Total Firms withTax-Exempt Assets Under Management in the Top 20 MSAs, 1983.in1983 # of%of %TotalTotalRankMetro AreaState Millions* Firms AssetsFirms1New 213ChicagoIL30,549277.435.08426,680306.495.645San CT11,40062.771.1310Minneapolis-St. ,16751.260.9414Anaheim-Santa ilwaukee-Waukesha WI3,23560.791.1319Kansas 694.3576.32Total388,094*1983 Assets reported in constant 2003dollars.Source: Money Market Directory, 1983.Bodenman135of
The Industrial GeographerTable 3b:Percentage of Total Tax-Exempt Assets and Percentage of Total Firms withTax-Exempt Assets Under Management in the Top 20 MSAs, 2003.2003 in# of% of Total%ofTotalRankMetro AreaStateMillionsFirmsAssetsFirms1New .756.273San Francisco-OaklandCA1,072,3795814.444.914Los Angeles-Long heim-Santa AnaCA141,37591.900.7910Minneapolis-St. 17Kansas CityMO44,23730.600.2218San DiegoCA43,116120.581.0219Fort Lauderdale -HollywoodFL40,38620.540.1720Dallas-Fort ource: Money Market Directory, 2003.Bodenman136
The Industrial GeographerBodenman137
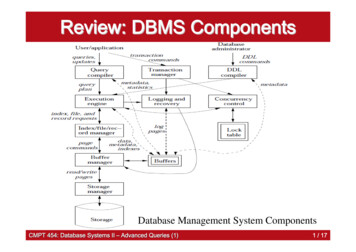
The Industrial GeographerConshohocken with nearly 40 billionunder management, and not far behindPhiladelphia is Radnor (5th ) with 12billion (Table 5).location within the Philadelphia , however, is the growingnumber of investment advisory firmslocated outside of the top five cities. In1983, 81.5 percent of the firms with taxexempt assets under management inPennsylvania were located in the top fivecities. By 2003, the top five cities share oftotal firms had dropped to 47 percent –the vast majority of this growth againtaking place at the expense ofPhiladelphia.However, most of thegrowth in new firms and their tax-exemptassets under management has takenplace in cities that are part of thePhiladelphia Metropolitan Area (Figures4a and 4b).Overall,thetopfivecitiesinPennsylvania (Figure 3b; Table 5) werehome to 22 firms with 13.3 billion in taxexemptassetsundermanagement(reported in constant 2003 dollars),representing over 98 percent of the totaltax-exempt assets under management in1983. By 2003, the top five cities werehome to 24 firms with 494.9 billion intax-exempt assets under management.However,thisabsoluteincreaserepresented a decrease in total sharefrom over 98 percent in 1983 to 94percentin2003,especiallyforPhiladelphia which saw its share of totaltax-exempt assets under managementdecrease from 65.7 percent in 1983 to 6.1percent in 2003 (Figure 5), a dramaticdecline. Bodenman (1998) reports on theinitial stages of this decline in an earlierstudy of investment advisory firmBodenmanFor example, a number of the citiesexperiencing growth in firms and assets,including Malvern (1st), Conshohocken(3rd), and Radnor (5th ), are "Main Line"suburbs of Philadelphia. Considered at138
The Industrial GeographerTable 4a: Percentage of Total Tax-Exempt Assets and Percentage of Total Firms withTax-Exempt Assets Under Management in the Top 20 Cities, 1983.1983Rank in# of% of Total% of TotalMillions*FirmsAssetsFirmsCityState1New 653ChicagoIL28,949257.044.704San FranciscoCA24,634185.993.385Los R3,73340.910.7515ChathamNJ3,55320.860.3816Newport Beverly HillsCA2,89050.700.9419White 370,92634790.1865.23Total*1983 Assets reported in constant 2003 dollars.Source: Money Market Directory, 1983.Bodenman139
The Industrial GeographerTable 4b:Percentage of Total Tax-Exempt Assets and Percentage of Total Firms withTax-Exempt Assets Under Management in the Top 20 Cities, ateBostonNew YorkSan FranciscoLos AngelesChicagoMalvernPlainsboroNewport portTotalMANYCACAILPANJCAGAPAMNOHCACTMDCOTXMANYCT inMillions# ofFirms% of TotalAssets% of .170.4239.72Source: Money Market Directory, 2003.Bodenman140
The Industrial GeographerTable 5:Percentage of State's Total Assets and Percentage of State's Total Firms with Tax-Exempt AssetsUnder Management in Pennsylvania's Top Five Cities, 1983 and 2003.1983 in# ofFirm% of Total% ms1PhiladelphiaPA8,9141463765.7051.852Bala CynwydPA1,48811,48810.973.703Valley 115PittsburghPA84432816.2211.1113,3552260798.43 in# ofFirm% of Total81.48% .4247.06Total*1983 Assets reported in constant 2003 dollars.Source: Money Market Directory, 1983 and 2003.Bodenman141
The Industrial GeographerBodenman142
The Industrial GeographerFigure 5:Percentage of Total Tax-Exempt Assets Under Management in Pennsylvania'sTop Five Cities, 1983 and adnorConshohockenCityCity's Percent of Total Assets, 1983Source: Money Market Directory, 1983; 2003.Bodenman143City's Percent of Total Assets, 2003
The Industrial GeographerBodenman144
The Industrial Geographerthemetropolitanscale,therefore,dispersal of assets under managementmoreaccuratelysuggests"suburbanization." That is, most of thegrowth is in cities located in thePhiladelphia Metropolitan Area.Thisfinding supports the initial trendsreported by Bodenman (1998; 2002) inearlier studies of the industry’s locationaldynamics.the investment advisory industryPhiladelphia from 1983 to 2003.At both the inter- and intrametropolitan level,the industry's spatial dynamics in Pennsylvaniaindicate deconcentration and dispersal as theinformation economy continues to mature. The“concentrated dispersal” of the industry over the1983-2003 study period further indicates thatlocation in a central city (i.e., Philadelphia CBD)is no longer a necessary condition. However, theextent to which suburbanization of theinvestment advisory industry is occurringelsewhere, in other MSAs (i.e., New York) isunclear—an indication that additional industrylocation studies are needed.SUMMARY AND CONCLUSIONSOverall, the analysis of data at theintermetropolitan level indicates thatwithin the state of Pennsylvania (ranked4thintax-exemptassetsundermanagement in 2003): both MetropolitanPhiladelphia and Pittsburgh increasedtheir relative shares of assets and firmsduring the 1983-2003 study period. By2003, the Philadelphia MSA had movedahead of Chicago (ranked 5th overall), andthe Pittsburgh MSA moved into the top20 nationally (ranked 11th overall).REFERENCESBloomfield, B. P., Coombs, R., Knights, D., and D.Littler (eds). 2000. Information Technology n. New York: Oxford University Press.Bodenman, J. E. 1998. "The Suburbanization ofthe Institutional Investment Advisory ssional Geographer 50(1): 112-126.However,analysisoftheintrametropolitan growth and change ofthe investment advisory industry inPennsylvaniaindicatesthattheindustry's ties to the CBD ofthetraditional financial center, Philadelphia,continue to break down. The city ofPhiladelphia's share of Pennsylvania'stotal assets and total firms had declinedto 6.1 percent and 13.7 percent,respectively, by 2003.However, themajority of cities that experienced thetremendous growth in firms and assets,were located in the Philadelphiametropolitan area. Thus, the analysis ofintrametropolitan growth and change,suggests that (1) investment managementties to the CBD of the traditionalfinancial center continue to weaken, butthat (2) spatial proximity to thetraditional financial center is beingmaintained.The analysis, therefore,suggests significant suburbanization ofBodenmaninBodenman, J. E. 2000. "Firm Characteristics andLocation: The Case of the Institutional InvestmentAdvisory Industry in the United States, 19831996." Papers in Regional Science 79(1): 33-56.Bodenman, J. E. 2002. “The Spatial Dynamics ofPennsylvania’s Institutional Investment AdvisoryIndustry: Pittsburgh vs. Philadelphia, 1983-2000.”The Pennsylvania Geographer XL(1): 3-34.Borchert, J.R. 1978. "Major Control Points inAmerican Economic Geography." Annals of theAssociation of Economic Geographers 68: 214-232.Carlino, G. A. 2001. "Knowledge Spillovers:Cities Role in the New Economy." BusinessReview: Federal Reserve Bank of Philadelphia Q4:17-23.Castells, M. 1989. The Informational City:Information Technology, Economic Restructuring,and Urban-Regional Process. Cambridge, MA:Basil Blackwell.Clark, G. L. 2000. Pension Fund Capitalism.New York: Oxford University Press.Daniels, P.W. 1993. Service Industries in the WorldEconomy. Cambridge, MA: Basil Blackwell.145
The Industrial GeographerGraves, W. 1998. “The Geography of MutualFund Assets.” Professional Geographer 50(2): 243254.Green, M.B. 1993. "A Geography of InstitutionalStock Ownership in the United States." Annals ofthe Association of American Geographers 83(1):66-89.Hepworth, M.E. 1990. Geography of theInformation Economy.New York, NY: TheGuilford Press.Hepworth, M.E. 1991. Information Technologyand the Global Restructuring of Capital Markets.In Collapsing Space and Time, ed. S.D. Brunn andT.R. Leinbach, pp. 132-148.London: HarperCollins Academic.Lee, R.2000.What is an Exchange?: TheAutomation, Management, and Regulation ofFinancial Markets. New York: Oxford UniversityPress.Money Market Directories. 1983. Money MarketDirectory of Pension Funds and Their InvestmentManagers.New York, NY: McGraw-HillPublishers.Money Market Directories. 2003. Standard &Poor’s: The Money Market Directory of PensionFunds and Their Investment Managers. NewYork, NY: McGraw-Hill Co.Sassen, S. 1991. The Global City: New York,London, Tokyo.Princeton, NJ: PrincetonUniversity Press.Stanback, T. M. 1991. The New Suburbanization:Challenge to the Central City.Boulder, CO:Westview Press.Bodenman146
advisory industry's spatial organization at both the inter - and intrametropolitan scales. Key words: investment advisory services, financial services, location INTRODUCTION The tremendous growth f the multi- o trillion dollar institutional investment advisory industry1 over the 1983-2003 study period, is emblematic of the