Transcription
RNA-seq: filtering, qualitycontrol and visualisationCOMBINE RNA-seq Workshop
QC and visualisation (part 1)
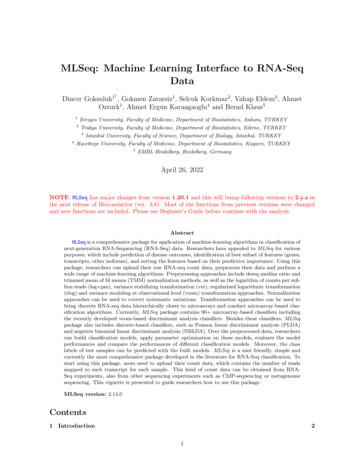
Slide taken from COMBINE RNAseq workshop on 23/09/2016RNA-seq of Mouse mammary glandBasalcellsLuminalcellsVirginn 2Pregnantn 2Lactatingn 2Virginn 2Pregnantn 2Lactatingn 2Fu et al. (2015) ‘EGF-mediated induction of Mcl-1 at the switch to lactationis essential for alveolar cell survival’ Nat Cell Biol
Slide taken from COMBINE RNAseq workshop on 23/09/2016(some) questions we can ask Which genes are differentially expressedbetween basal and luminal cells? between basal and luminal in virgin mice? between pregnant and lactating mice? between pregnant and lactating mice inbasal cells?
Reading in the data– counts data and sample information Formatting the data– clean it up so we can look at it easily
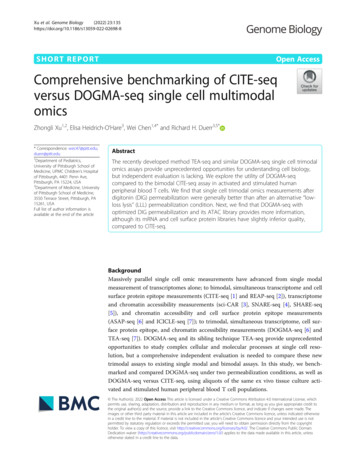
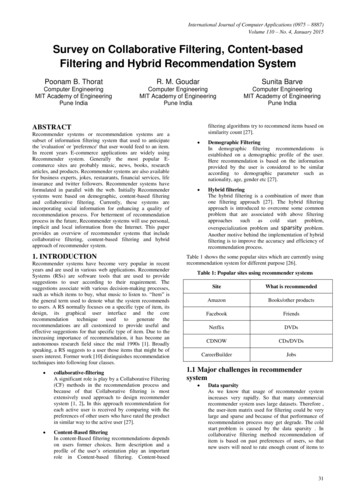
Filtering out lowly expressed genes Genes with very low counts in all samples providelittle evidence for differential expression Often samples have many genes with zero or verylow countsA. Raw data10 6 5 119 6 5 11purep53JMS8 2JMS8 3JMS8 4JMS8 5JMS9 P7cJMS9 P8c0.100.0510 6 5 119 6 5 11purep53JMS8 2JMS8 3JMS8 4JMS8 5JMS9 P7cJMS9 P8c0.150.100.05Log cpmLog cpm151050 51510500.00 50.00 10Density0.150.20Density0.20B. Filtered data
Filtering out lowly expressed genes Testing for differential expression for manygenes simultaneously adds to the multipletesting burden, reducing the power to detectDE genes. IT IS VERY IMPORTANT to filter out genes thathave all zero counts or very low counts. We filter using CPM values rather than countsbecause they account for differences insequencing depth between samples.
Filtering out lowly expressed genes CPM counts per million, or how many countswould I get for a gene if the sample had alibrary size of 1M.For a given gene:Library sizeCountCPM1M1110M10120M100.5
Filtering out lowly expressed genes Use a CPM threshold to define “expressed” and“unexpressed” As a general rule, a good threshold can be chosen for aCPM value that corresponds to a count of 10. In our dataset, the samples have library sizes of 20 to 20something million.Library sizeCountCPM1M1110M10120M100.5
Filtering out lowly expressed genes Use a CPM threshold to define “expressed” and“unexpressed” As a general rule, a good threshold can be chosen for aCPM value that corresponds to a count of 10. In our dataset, the samples have library sizes of 20 to 20something million.Library sizeCountWe CPMuse a CPMthreshold of 0.5!11M110M10120M100.5
Filtering out lowly expressed genes Use a CPM threshold to define “expressed” andBut if this is too hard“unexpressed”to work out, a CPMof 1 works As a general rule, a good threshold can thresholdbe chosenfor awell in most cases.CPM value that corresponds to a count of10. In our dataset, the samples have library sizes of 20 to 20something million.Library sizeCountWe CPMuse a CPMthreshold of 0.5!11M110M10120M100.5
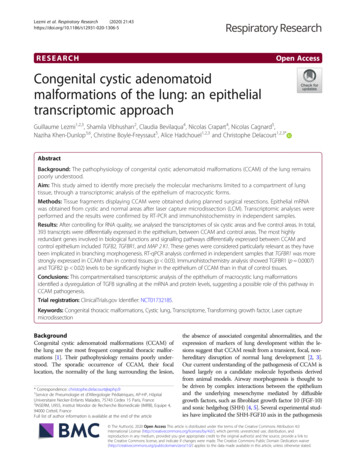
Filtering out lowly expressed genes We keep any gene that is (roughly) expressed in at least onegroup. 12 samples, 6 groups, 2 replicates in each group.Keep if CPM 0.5 in at least 2 out of 12 nalcellsPregnantLactating
Filtering out lowly expressed genes We keep any gene that is (roughly) expressed in at least onegroup. 12 samples, 6 groups, 2 replicates in each group.Keep if CPM 0.5 in at least 2 out of 12 samplesVirgin expressedBasalcellsPregnant expressedLactating expressedVirgin unexpressedLuminalcellsPregnant unexpressedLactating unexpressed
Filtering out lowly expressed genes We keep any gene that is (roughly) expressed in at least onegroup. 12 samples, 6 groups, 2 replicates in each group.Keep if CPM 0.5 in at least 2 out of 12 samplesVirgin unexpressedBasalcellsPregnant expressedLactating unexpressedVirgin unexpressedLuminalcellsPregnant unexpressedLactating unexpressed
Filtering out lowly expressed genes We keep any gene that is (roughly) expressed in at least onegroup. 12 samples, 6 groups, 2 replicates in each group.Keep gene if CPM 0.5 in at least 2 or more samplesVirgin unexpressedBasalcellsPregnant expressedLactating unexpressedVirgin unexpressedLuminalcellsPregnant unexpressedLactating unexpressed
QC and visualisation (part 2)
MDS Plots A visualisation of a principle components analysiswhich looks at where the greatest sources ofvariation in the data come from. Distances represents the typical log2-FC observedbetween each pair of samples– e.g. 6 units apart 2 6 64-fold difference Unsupervised – separation based on data, noprior knowledge of experimental design.– Useful for an overview of the data. Do samplesseparate by experimental groups?– Quality control– Outliers?
QC and visualisation (part 3)
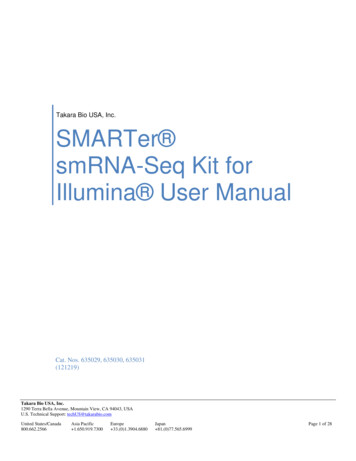
Normalisation for composition biasA. Example: Unnormalised data JMS8 3JMS8 4JMS8 5JMS9 P7cJMS9 P8cLog cpmIf we ran a DE analysis on5 Sample 1 and Sample 3, almostall genes will be down0regulated in Sample 1!! JMS9 P8c JMS9 P7c 5 JMS8 5 JMS8 4 JMS8 3 JMS8 2 purep53 9 6 5 11 5010 10 6 5 11 JMS8 2 purep53 10 6 5 11Log cpm1015 9 6 5 11 15B. Example: Normalised data 5
Normalisation for composition biasA. Example: Unnormalised data 15 15 5 5 10 6 5 119 6 5 11purep53JMS8 2JMS8 3JMS8 4JMS8 5JMS9 P7cJMS9 P8c0JMS9 P8cpurep53 JMS9 P7c JMS8 5 5 JMS8 4 JMS8 3 9 6 5 11 JMS8 2010Log cpm 10 6 5 11Log cpm10 B. Example: Normalised data 5
Normalisation for composition bias TMM normalisation (Robinson and Oshlack, 2010) How do we make the expression of all the genes go UP inthe one sample?– Scaling factors E.g. scale library size by 0.1 so effective library size is1M.Library sizeCountCPM10M1011M1010 Scaling factor 1 makes the CPM larger.
Voom
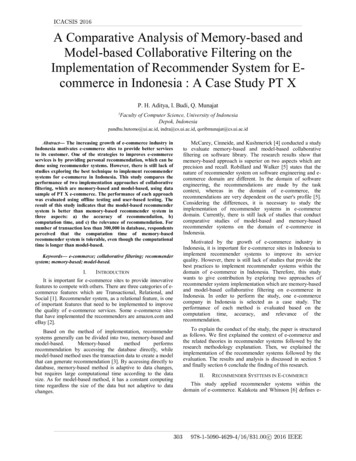
Variance of log-cpm depends on meanof log-cpmSEQC(tech var only)Mouse(low bio var)Nigerian(high bio var)D melanogaster(systematically dif)Average log2(count 0.5)Simulations(mod bio var)25
RNA-seq data is discrete has non-constant mean-variance trend Voom Transform to log-counts per million Remove mean-var dependence throughthe use of precision weightsNormal dist. assumes that the data is continuous has constant variance
Variance weights Obtain variance estimates for each observation usingmean-var trend. Assign inverse variance weights to each observation. Weights remove mean-variance trend from the data.After: constant varianceLog2- varianceQtr-root varianceBefore: trended varianceMean log-countMean log-cpm
Filtering out lowly expressed genes Use a CPM threshold to define "expressed" and "unexpressed" As a general rule, a good threshold can be chosen for a CPM value that corresponds to a count of 10. In our dataset, the samples have library sizes of 20 to 20 something million. Librarysize Count CPM 1M 1 1 10M 10 1 20M 10 0.5 We .