Transcription
W W W. I N V E S T O R S . C O MYOUR QUICK-START GUIDEUsing Investor’s Business DailyTo Find Winning Stocks.This Quick-Start Guide is designed to show you how to get themost out of Investor’s Business Daily’s innovative features andhelp you become a more educated, confident investor.We’ll show you the most valuable and time-saving features in IBD ,give you definitions and explain why certain areas of the paper arevital if you want to make money in the stock market.With IBD you can easily:Discover new investment ideas.Find stocks setting up for possible breakouts.Gauge the true health of any stock.Track and understand current market conditions.Red-flag individual stock & general market sell signals.Learn the finer points of smart investing.Every day you’ll be learning a little more about the historically grounded, common-senseinvestment rules and guidelines IBD was founded upon. We hope you find thisguide useful. Here’s to your future investing success!IBD’s Top 10The Big PictureYour fast briefingon the day’stop stories. Inminutes you getup to speed onthe markets &economy.Three out of four stocks follow the market’s direction. So should you. The Big Picture givesyou a daily briefing on market direction and objective analysis on the price action of leadingstocks. This is not personal opinion; rather, IBD editors help you understand the market’sdirection and its key indicators, which are vital to your investing success. The Big Picturehelped observing readers get out of the market before the big losses in 2008 and back inthe market in March at the start of the current rally.Online Resources: IBD’s market editors cover the action every hour during market hours.It’s the top story on Investors.com.
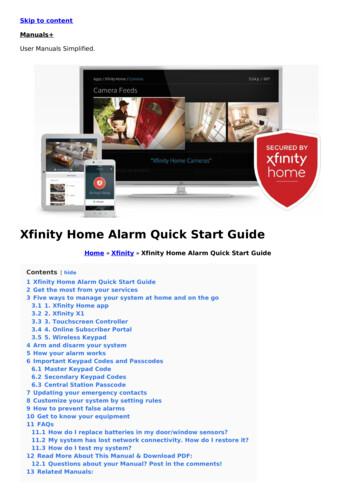
INVESTOR’S BUSINESS DAILYINVESTORS.COMIBD teaches you essential investing strategies every dayNYSE and Nasdaq Stocks On The Move Sideby-Side!IBD teaches you essential investing strategies every day.IBD’s one-of-a-kind daily screens list stocks trading inmuch higher than normal volume, indicating institutionalbuying. This helps you spot leaders you won’t find onstandard most active lists appearing in other newspapers.Stocks On The Move also shows you stocks that are downin higher than average volume, a sign of weakness andpossible further price declines.Appearing each day in IBD and at Investors.com, this is the best wayto begin broadening your knowledge. This section serves as a tutorialon IBD’s unique tools and addresses investment questions on buying,selling, chart analysis, spotting market trends, and much more.Online Resources: Visit our Investor’s Corner Archive onInvestors.com/education for a huge library of previously publishedarticles. They are grouped into seven main topics from chart readingto investor psychology.Online Resources: Our intraday version of this screen ison the homepage of Investors.com and updated everytwo minutes during trading hours!-2-
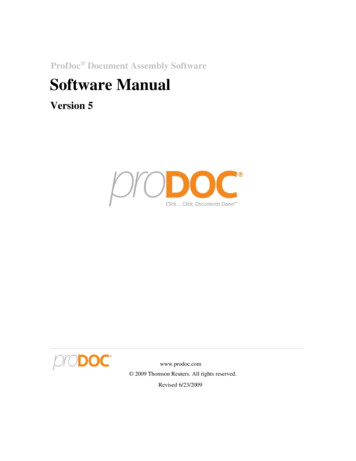
INVESTOR’S BUSINESS DAILYINVESTORS.COMHOW’S THE MARKETHow’s The Market PageTop 10 FidelityIndustry FundsMUST READ!This IBD exclusive list tellsyou the top sectors leadingthe market now. A greatplace to find investing ideas!IBD’s founder created the first daily stock computer databasein the 1960s. IBD now has models of all top-performing stockseach year from 1880 to 2008. We analyzed all key fundamental& market variables present just before these super-winnersincreased 100% to 1000% and up. They all emerged from oneof seven classic price consolidation structures (chart bases ofseven to 65 weeks). Crucially, over 90% of these bases wereformed during general market sell-offs that occur once or twicea year.M U S T R E A D!IBD’s 197 Industry Sub-GroupRankings Help You See New Trends!So, the correct time to learn to buy the next potential big newleader that has accelerating earnings and sales is when a keygeneral market index finally rallies. The signal occurs on afourth or later day of its attempted rally, when the index has afollow-through day up a huge percentage in price on a volumeincrease from the day before. Once this happens, the beststocks typically move up in price and emerge from properlyformed bases.Specific industry groups lead every new marketuptrend, & specific stocks within those groupsare the drivers. Group action also influences atleast half of a stock’s performance.IBD’s 197 Industry Sub-Group Rankings filtersstocks into very specific sub-groups to helpyou find where the real leadership resides.This helps you focus on key stocks drivingthe trends and making better price gains! It’sessential information you can’t get anywhereelse!Therefore, you need to learn to read charts and track IBD’smarket indexes. IBD’s The Big Picture column will help you bypointing out follow-through days as well as periods of excessivedistribution (selling) days over any 4 or 5 week period.So, keep learning more from IBD and discover how tocapitalize on America’s relentless parade of remarkable newentrepreneurial leaders!Industry rankings are computed based onperformance over the past week, three, six andseven months. Strongest groups each day areboldfaced to identify potential trends early on.The weakest are underlined.-3-
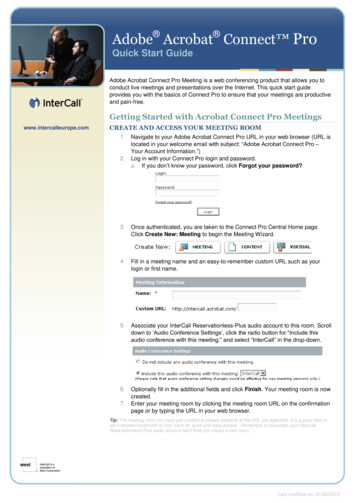
INVESTOR’S BUSINESS DAILYINVESTORS.COMSUCCESSFUL INVESTORS READ INVESTOR’S BUSINESS DAILY IBD’s New Research Tables Help YouSave Time and Spot Leading Stocks!IBD’s Research Tables revolutionize how vital stock data is presented and dramatically cut the time ittakes you to find winning stocks.1 Stocks are first filtered by the best-performing 33 broad economic industry sectors.2 The Group Ranking from previous weeks is indicated, so you know whether the group is movingup or down.3 We show you up to 10 fundamentally and technically superior stocks alphabetically at the top ofeach sector list. Additional key data is given on these stocks.4 Tables have wider columns & bigger type, making them easier for you to read than ever before.5 NYSE and Nasdaq stocks are combined into one table to further save you time. At least 2,500stocks are listed -- 1,000 more than other leading business dailies.With this exclusive format, you can do a quick 30-second scan of IBD’s first several sectors andimmediately spot up to 30 high-rated stocks in the best market sectors!Sorted By Top Sector Performance1Actual Size in IBDTip:Join an IBD meetupgroup in your areaand learn from othersubscribers!Group Ranking2This is a good way to spot groupsbecoming more powerful and groupsfaltering.Up To 10 Top Performing StocksAre Spotlighted3When the market is in a rally, this is a greatplace to find leading stocks.-4-
INVESTOR’S BUSINESS DAILYINVESTORS.COMSUCCESSFUL INVESTORS READ INVESTOR’S BUSINESS DAILY IBD’s Key Ratings No Other Source Gives YouWe rate and compare all domestically traded stocks in IBD’s huge database togive you a fast assessment of a stock’s strengths and weaknesses and overallpotential. You have daily updates on the most relevant and vital performancemeasurements. No other daily financial paper offers you this data!-Wider Columns-Bigger Type-Easier To Read41. COMPOSITE RATING: The IBD SmartSelect Composite Rating combinesall 5 SmartSelect Ratings into one easy-to-use rating. More weight is placed onEarnings Per Share & Relative Strength. Stock’s percent off its 52-week high isalso included in the formula.2. EARNINGS PER SHARE GROWTH RATING (EPS): Compares short- andlong-term profit growth of every publicly traded company and ranks them from1 to 99. A stock with an EPS Rating of 99 has delivered profit growth betterthan 99% of all other companies.3. RELATIVE PRICE STRENGTH RATING (RS): Looks at how much a stockhas gained or lost in the past 12 months and compares its performance withevery other publicly traded company (1 to 99).4. SALES MARGINS RETURN ON EQUITY RATING (SMR) : Graded onan A to E scale; lets you spot companies with superior Sales Growth, ProfitMargins, and % Return on Equity.5. ACCUMULATION / DISTRIBUTION RATING : This important rating,unavailable elsewhere, accurately tracks the relative degree of professionalbuying (accumulation) and selling (distribution) in a particular stock over thelast 13 weeks. Updated daily, stocks are rated on an A to E scale.Actual Size in IBDA Heavy buying to E Heavy sellingOnline Resources: You can use the Stock Quotes & News investing tool onInvestors.com for a quick view of SmartSelect Ratings for any stock!NYSE and NASDAQ Combined5 Vital Ratings for 2,500 LeadingNYSE & Nasdaq StocksIBD’s New Research Tables Help You See Top Performers in Seconds!1. Boldfaced Composite Rating: Any stock with Composite Rating 95 or higher. . .making it easy for you to scan for top-rated stocks.2. Volume % Change: IBD’s unique supply and demand indicator when combined witha stock’s price change is the truest measure of trading in a stock. A quality stock up inprice with a big volume % change could be the first hint big investors (mutual funds,etc.) may be moving into a stock, which is likely to push up the price over time.13. Underlined Stocks: Stock closed at a new 52-week low or price is down at least 1.00.24. Boldfaced Stocks: Stock closed at a new 52-week high or price is up at least 1.00.5. Boldfaced 52-Week High: The stock’s price is within 10% of its 52-week high.6. Stocks With a Dot: Denotes that a New America or IBD 100 story was written about thecompany in the past six months.345-5-6
INVESTOR’S BUSINESS DAILYINVESTORS.COMSTOCKS IN THE NEWSStocks In The NewsShows you market-leading stocks every day. It’s a great place for you to find investing ideas, especiallyas soon as a key general market index has a follow-through day (FTD) and starts a new uptrend.Historically, FTD’s succeed 70% of the time and the best new leaders break out in the first 3 weekswhen most people hesitate buying. Don’t miss these future turns! Charts are selected by a dailyscreening.Also, IBD editors give you a detailed analysis on select stocks to help you assess their potential.Online Resources: Use IBD Charts on Investors.com to accurately spot the potential buy points wediscuss here.Leading Market Sector IndexesThese market sector indexes track stocks representative of key sectors of the U.S. economy. Thetop-performing sectors year-to-date are shown daily, YTD % change is at the top right above eachchart.Where possible, companies comprising the sector index are listed, to show you stocks behind thetrend.MU ST RE A D!IBD’s 52-Week Highs and LowsUnlike any other business or financialpublication, IBD combines all NYSEand Nasdaq stocks making new pricehighs or lows and places them intoIBD’s 33 broad industry sectors. Wethen list the sectors in order of thoseshowing the largest number of newhighs followed by the sectors showingthe largest number of new lows.This quickly lets you recognize andunderstand which industry sector isthe strongest and the weakest.But that’s not all. IBD then lists newhighs within each sector in order ofthose that showed the greatest %increase in their trading volume forthat day. Each stock’s symbol isshown so you can easily check anIBD chart on Investors.com. IBD alsogives you the stock’s EPS rank andclosing price. Stocks with an EPS rankof 95 or higher are boldfaced.Finally, IBD provides you with 5other professional measurements foryou to cross-check and zero in withunmatched accuracy on the top sectorfor your investments, plus the sectorsfor you to avoid:1. IBD’s stock tables sorted by sectorwith the best recent price action.2. IBD’s 197 Industry Sub-Group table3. IBD’s box of groups with the highest% of their stocks making new highs.4. Fidelity’s year-to-date top 10performing industry funds.5. IBD’s leading market sectors dailymini price and volume charts.Now it’s up to you.-6-
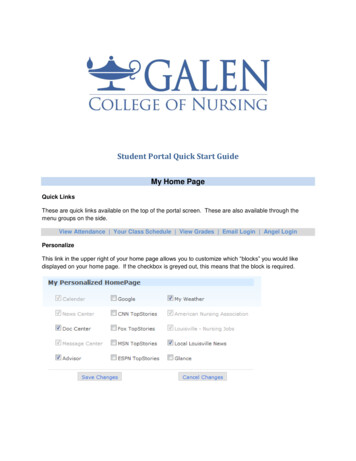
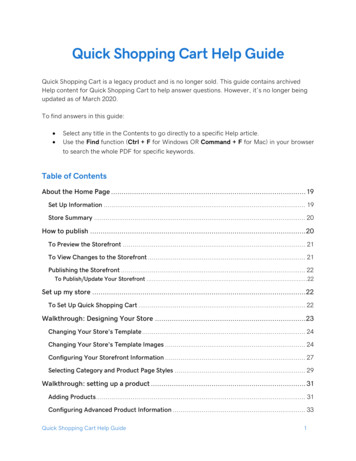
INVESTOR’S BUSINESS DAILYINVESTORS.COMThe 20 Rules are based on decades of research into how the market actually works -- and they’rethe foundation for all the features, screens and tools you will get with Investor’s Business Dailyand Investors.com. If you get serious and carefully follow all of these historically proven rules, yourinvestment results can substantially improve. You can do it if you make up your mind!MUSTREA D!IBD’S 20 Rules For Investment Success.111Focus on stocks with each of the last three years’earnings up 25% , return on equity of 17% and recentearnings and sales accelerating.12.23Recent quarterly earnings and sales should be up25% or more.13Avoid cheap stocks. Buy higher-quality stocks selling at 15 a share and higher.Cut every loss when it’s 8% below your cost. Makeno exceptions so you can always avoid huge, damaginglosses. Never average down in price.Follow selling rules on when to sell and take profiton the way up.Don’t buy because of dividends or P-E ratios.Pick companies with a superior new productor service.16Invest mainly in entrepreneurial New Americacompanies. Pay close attention to those with an IPOin the past 8 years.Buy when market indexes are in an uptrend. Reduceinvestments and raise cash when general marketindexes show five or more days of volume distribution.17Check into companies buying back 5% to 10% oftheir stock and those with new management.1819Don’t try to bottom-guess or buy on the way down.Never argue with the market. Forget your pride and ego.20Do a post-analysis of all your buys and sells. Poston charts where you bought and sold each stock.Evaluate and develop rules to correct your majorpast mistakes.81415.7Current quarterly after-tax profit margins should beimproving, near their peak and among the best in thestock’s industry.Learn how to use charts to see sound base patternsand exact buy points.6Select stocks with increasing institutionalsponsorship in recent quarters.45Buy mostly in the top six broad industry sectors inIBD’s New Highs List.Read IBD’s Investor’s Corner and Big Picture columnsto learn how to recognize important tops and bottoms inmarket indexes.Find out if the market currently favors big-capor small-cap stocks.9Buy stocks with a Composite Rating of 90 or moreand a Relative Price Strength Rating of 85 or higher inthe IBD SmartSelect Corporate Ratings.10 Pick companies with management ownership of stock.IBD 100 PerformanceMU S TR E AD !Weekly changes in the IBD 100 since its inception, vs. the S&P 500250%IBD 100:S&P 500:200IBD 10080.3%-3.6%Performance 5/2/03 to 11/28/08IBD 100150The IBD 100 is our proprietary index of leading stockstrading in the U.S., showing superior earnings, strong priceperformance and leadership within their industry. Since itsinception, the IBD 100 Index has vastly outperformed theS&P 500. (See chart at right).100Published in every MONDAY issue.More ways to find winning stocksIBD Big Cap 20 - Ranking of leading large-capitalizationcompanies trading in the U.S. is based on a combinationof each company’s profit growth and our Composite andRelative Price Strength ratings.50Published in every TUESDAY issue.0Your Weekly Review - Based on the IBD 85/85 Index, thiscomputer generated stock list is another place to find greatinvesting ideas!Published in every FRIDAY issue.-50May ’03-7-’04’05’06’07’08
INVESTOR’S BUSINESS DAILYINVESTORS.COMYour Subscription Includes FREE ACCESS toPowerful Investing Tools on Investors.comMake sure you’re getting the most out of IBD by logging on at www.investors.com.If you don’t have a password, get registered now at: www.investors.com/register.Find StocksStocks on the Move Screen CenterIBD’s Real Most ActiveIBD Stock Research ToolThe IBD Stock Research Tool is located on the home page of the newInvestors.com, giving you quick access to everything you need for yourinvesting needs. This tool was designed to give you an effective stepby-step process for using theCAN SLIM Investing System.Evaluate StocksStock Checkup IBD chartsDaily Stock AnalysisTrack StocksMy Stock ListsMarket DirectionIntraday UpdatesThe Big PictureMarket PulseIndexes1New Investing IdeasThe Screen Center is a new timesaving feature that puts all the IBDscreens in one place. There are 6 valuable screens presented everyday, bringing you the best stocks in different categories. 1In addition to the Fundamental View shown above, you can also access the SmartSelect ratings for each stock in the Screen Centerby clicking on the Smart Select Ratings View tab. 22IBD ChartsSharp detailed daily and weekly charts allow you to quickly check for bullish chartpatterns, institutional support, buy points,and more! 2010 Investor’s Business Daily, Inc. Investor’s Business Daily, IBD and CAN SLIM and corresponding logos are registered trademarks owned by Data Analysis, Inc., an affiliate of Investor’s Business Daily.-8-BLKT-WKT-008
a stock's price change is the truest measure of trading in a stock. A quality stock up in price with a big volume % change could be the first hint big investors (mutual funds, etc.) may be moving into a stock, which is likely to push up the price over time. 3. Underlined Stocks: Stock closed at a new 52-week low or price is down at least 1 .