Transcription
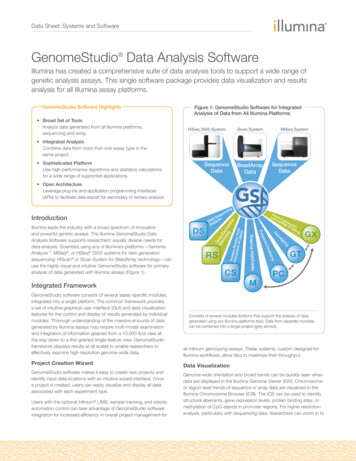
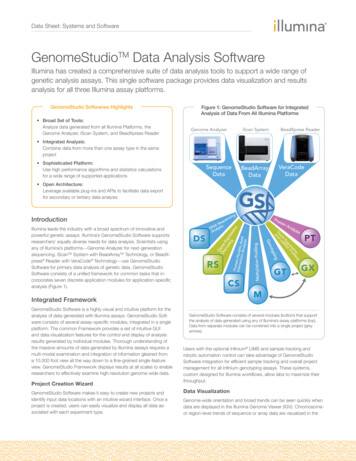
Data Sheet: Systems and SoftwareGenomeStudioTM Data Analysis SoftwareIllumina has created a comprehensive suite of data analysis tools to support a wide range ofgenetic analysis assays. This single software package provides data visualization and resultsanalysis for all three Illumina assay platforms.GenomeStudio Softwarwe Highlights Broad Set of Tools:Analyze data generated from all Illumina Platforms, theGenome Analyzer, iScan System, and BeadXpress ReaderFigure 1: GenomeStudio Software for IntegratedAnalysis of Data From All Illumina PlatformsGenome AnalyzeriScan SystemBeadXpresspReader Integrated Analysis:Combine data from more than one assay type in the sameproject Sophisticated Platform:Use high performance algorithms and statistics calculationsfor a wide range of supported applicationsSequenceDataVeraCodeDataBeadArrayData Open Architecture:Leverage available plug-ins and APIs to facilitate data exportfor secondary or tertiary data analysisCSProject Creation WizardGenomeStudio Software makes it easy to create new projects andidentify input data locations with an intuitive wizard interface. Once aproject is created, users can easily visualize and display all data associated with each experiment type.GTPTGXMIntegrated FrameworkGenomeStudio Software is a highly visual and intuitive platform for theanalysis of data generated with Illumina assays. GenomeStudio Software consists of several assay-specific modules, integrated in a singleplatform. The common Framework provides a set of intuitive GUIand data visualization features for the control and display of analysisresults generated by individual modules. Thorough understanding ofthe massive amounts of data generated by Illumina assays requires amulti-modal examination and integration of information gleaned froma 10,000 foot view all the way down to a fine-grained single-featureview. GenomeStudio Framework displays results at all scales to enableresearchers to effectively examine high-resolution genome-wide data.Methylation ProfilingProteInter in-Nucleicaction Ana AcidlysisRSRSypnotGeDSProteinAnalysisgon linsi fies ropr A PEx Ne iRen mG ndaingIllumina leads the industry with a broad spectrum of innovative andpowerful genetic assays. Illumina’s GenomeStudio Software supportsresearchers’ equally diverse needs for data analysis. Scientists usingany of Illumina’s platforms—Genome Analyzer for next-generationsequencing, iScanTM System with BeadArrayTM Technology, or BeadXpress Reader with VeraCode Technology—use GenomeStudioSoftware for primary data analysis of genetic data. GenomeStudioSoftware consists of a unified framework for common tasks that incorporates seven discrete application modules for application-specificanalysis (Figure 1).ngnciueeqSA isDN alysAnGDi enesc Exov per rey ssionIntroductionGenomeStudio Software consists of several modules (bottom) that supportthe analysis of data generated using any of Illumina’s assay platforms (top).Data from separate modules can be combined into a single project (greyarrows).Users with the optional Infinium LIMS and sample tracking androbotic automation control can take advantage of GenomeStudioSoftware integration for efficient sample tracking and overall projectmanagement for all Infinium genotyping assays. These systems,custom designed for Illumina workflows, allow labs to maximize theirthroughput.Data VisualizationGenome-wide orientation and broad trends can be seen quickly whendata are displayed in the Illumina Genome Viewer (IGV). Chromosomeor region-level trends of sequence or array data are visualized in the
Data Sheet: Systems and SoftwareTable 1: Visual ResultsGlobal VisualizationIllumina Genome Viewer (IGV)Illumina Chromosome Browser (ICB)Illumina Sequencing Viewer (ISV)GraphsDendrograms and Clustering AnalysisHeat MapsScatter PlotsHistogramsLine GraphsBox PlotsFrequency Plotssample-independent controls so researchers have confidence thatthey are producing the highest quality data. The performance of allcontrols can be monitored easily with the GenomeStudio Softwareintegrated Controls Dashboard.Application-Specific Analysis ModulesGenomeStudio Modules support the wide range of available Illuminaassays and applications. The modular nature of the software enablespowerful assay-specific analysis and allows individual applications tobe updated or added as necessary. GenomeStudio Modules cover thespectrum of Illumina applications, such as DNA sequencing, chromatin immunoprecipitation sequencing (ChIP-Seq), mRNA sequencing,microarray-based genotyping, microarray-based gene expression,microarray-based methylation, and immunoprotein assay analysis.DNA Sequencing Module (DS)SNP TableDNA sequencing data generated using the Genome Analyzer andPipeline Software tools can be analyzed to discover and confirmSNPs and chromosomal breakpoint regions. Visualization tools displayconsensus reads in the reassembled genome and indicate SNPs withcolored letters (Figure 2). Newly discovered SNPs can be exported touse in customized iSelect genotyping array designs.Alleles TableChIP Sequencing Module (CS)Probe TableData from Illumina Whole-Genome Chromatin ImmunoprecipitationSequencing experiments performed using the Genome Analyzersystem and Pipeline Software can be parsed to the GenomeStudioChIP Sequencing Module to create global binding site maps of DNAassociated proteins. Differential binding levels between experimentalgroups can be identified by comparing sequences, regions, and peaksin table or chromosome views.Pie ChartsTablesSamples TableSequence or Lane TablesGene, Exon, or Junction TablesPlus other assay results tablesIllumina Chromosome Browser (ICB). The ICB can be used to identifystructural aberrants, gene expression levels, protein binding sites, ormethylation of CpG islands in promoter regions. For higher resolutionanalysis, particularly with sequencing data, researchers can zoom in tosee single base calls in the Illumina Sequence Viewer (ISV) to preciselyidentify individual SNPs, CpG loci, splice junctions, or cSNPs.Figure 2: SNPS Identified From Aligned ReadsDisplayed in DNA Sequencing ModuleTo find trends across samples, markers, or different assays, theGenomeStudio Framework provides a wide range of graphical plottingand display tools (Table 1). Researchers can choose to display dataas line graphs, histograms, scatterplots, pie charts, dendrograms, boxplots, frequency plots, or heat maps. These tools are used to easilycompare samples from different experimental conditions in order toidentify differential expression levels, protein expression, or methylationlevels.When trends or interesting regions are identified with graphicalanalysis tools, looking at individual data points becomes essential.GenomeStudio Software supports this single-site level of analysis ofindividual SNP genotypes, splice junctions, gene or exon expressionlevels, CpG loci methylation status, or protein binding site occupationlevels with table displays. Table views are customizable for sortingand to show or hide various data categories. Table data can also beexported in formats compatible with other downstream analysis tools.Controls DashboardIllumina array-based assays (including Infinium and GoldenGate Genotyping or Methylation Profiling, and Direct Hyb, DASL , or microRNAExpression Profiling Assays) contain internal sample-dependent andAligned sequencing reads (yellow and purple blocks) are stacked on areference genome in the ICB. SNPs are identified with red characters and inthe called SNPs data track. Two SNPs are highlighted with a ruler indicatingthe position of the called SNPs in the aligned reads relative to the referencegenome.
Data Sheet: Systems and SoftwareFigure 3: RNA Sequencing Module Alleles TableGene Expression Module (GX)Data from Direct Hyb, DASL, and Whole-Genome DASL Gene Expression Profiling Assays or MicroRNA Profiling Assays generated usingthe BeadArray Reader, iScan System, or BeadXpress Reader areall analyzed using the GX Module. The results generated using thismodule provide meaningful conclusions from the continuous expression data on gene-level statistical analysis tools. Differential expressionanalysis can be visualized as line plots, histograms, dendrograms, boxplots, heat maps, scatter plots, frequency plots, pie charts, samplestables, and gene clustering diagrams. Simplified data managementtools in GenomeStudio Software include hierarchical organization ofsamples, groups, group sets, and all associated project analysis.Methylation Module (M)Sequence information for more than 130 million reads from a flow cell isaccessible and viewable in real-time in the Sequences Table of the RNASequencing Module (left). All called cSNPs can be individually explored indepth with the Alleles Table (right).DNA methylation data from scanned microarray images collected fromthe BeadArray Reader, iScan System, or BeadXpress Reader are analyzed with the Methylation Module. This module calculates methylationlevels(beta values) and analyzes differential methylation levels betweenexperimental groups. CpG island methylation status is visualizedacross the genome with the IGV and ICB. Results from single-siteresolution data are visualized as line plots, bar graphs, scatter plots,frequency plots, pie charts, histograms, dendrograms, box plots, orheat maps. Methylation data can also be combined with gene expression profiling experiments within the same GenomeStudio Projectfor correlation between levels of methylated sites (beta values) anddifferential gene expression levels (p-values).RNA Sequencing Module (RS)Protein Analysis Module (PT)Data generated from mRNA sequencing experiments using theGenome Analyzer and Pipeline Software tools are displayed in the GenomeStudio RS Module as expression levels and variants discovered.This module performs digital gene expression profiling by aggregatingdata from the Genome Analyzer Pipeline Software to count the abundance of reads falling within specific exons, genes, and splice junctions. The data are then graphically displayed as tables or plots withGenomeStudio Software (Figure 3). Genome views display consensusreads in the transcriptome by aligning reads to known abundantsequences and splice junctions. Coding SNPs and splice variants areidentified and confirmed visually with single-base resolution in the ICB.Data generated using Carboxyl VeraCode Beads on the BeadXpressReader are analyzed using the PT module. Users can determineanalyte concentration using a standards curve, or differential proteinexpression levels between samples. If applicable, protein levels canbe compared to mRNA expression levels. Results are be visualized asline plots, histograms, dendrograms, frequency plots, pie charts, boxplots, heat maps, scatter plots, samples tables, and gene clusteringdiagrams.Figure 4: Genotyping Module GenoplotGenotyping Module (GT)GoldenGate and Infinium Genotyping Assay data generated using theBeadArray Reader, iScan System, or BeadXpress Reader are analyzedwith the GenomeStudio Genotyping Module. Primary data analyses,such as raw data normalization, clustering, and genotype calling areperformed using algorithms in the GT Module. Data quality is rapidlyconfirmed with internal controls and other QC functions. IndividualSNPs can be viewed as GenoPlots and edited if necessary (Figure 4).Genotype summary statistics and results are automatically reportedand exportable for use in other third-party downstream analyses.Structural variation is identified using the same markers as genotypingand intensity-only probes with algorithms to calculate loss of heterozygosity (LOH), and abnormal copy numbers (CNVs). Identified structuralvariants can be bookmarked (with auto-bookmarking features) andviewed in the context of the entire chromosomes with the ICB or IGV.GenomeStudio Software also provides data plots displaying CNV values, log R ratios, B-allele frequencies, and bookmarks for one or moresamples within the IGV.The graphical display of results in GenomeStudio GT Module is a GenoPlot,with data points color coded for the call (red AA, purple AB, blue BB). Genotypes are called for each sample (dots) by their signal intensity(Norm R, y-axis) and Allele Frequency (Norm Theta , x-axis) relative tocanonical cluster positions (dark shading) for a given SNP marker.
Data Sheet: Systems and SoftwareFigure 5: Gene Expression Module Heat Mapwith GenomeStudio Software or in the upstream Genome AnalyzerPipeline Software. Primary data analysis functions for genotype calling,CNV identification, sequence read alignment, exon and splice junctioncounting, and SNP calling tools are provided by algorithms such asGenCall, GenTrain, cnvPartition, ELAND, and CASAVA.GenCallGenotype calls are made from BeadChip marker two-color signalintensities by comparison to canonical genotype clusters. The millionsof calls resulting from Infinium BeadChip assays are made quickly andreproducibly for display in GenomeStudio Software with the integratedGenCall algorithm. Cluster position identification, when necessary, isperformed by the GenTrain algorithm.cnvPartitionUsing the heat map in the GX Module allows easy visualization and analysisof large amounts of data. This heat map dendrogram clusters rows (TargetID) and columns (Differential Scores).Integrated Analysis From Multiple ApplicationsThe research community is taking advantage of the multiple types ofassays and platforms offered by Illumina to perform multiple typesof genetic variation analysis studies. GenomeStudio Software supportsthese powerful integrative studies with the ability to combine datasets from different assay types in a single project requiring minimaldata handling and preparation by researchers. For example, data frommethylation and gene expression assays can be combined in a singleGenomeStudio GX Module project table where combined statistics areshown and integrated plots can be generated.Sophisticated Analysis AlgorithmsGenomeStudio Software is part of the overall molecular biology informatics platform supporting the analysis of all Illumina assays. Primarydata analysis involves several algorithms that are either integratedcnvPartition uses Illumina BeadChip genotyping array data (signalintensities and genotype calls) to identify regions of unexpected copynumber and calculate the copy numbers of those regions with confidence scores. The copy number values are then used to create CNVregions and bookmarks in GenomeStudio Software for visualization ofaberrant chromosomal regions across the genome.ELAND and CASAVAThe Genome Analyzer Pipeline Software outputs processed sequencedata that GenomeStudio Modules display graphically. Single or pairedend sequence read alignments to a reference sequence are performedby ELAND.The CASAVA Software package performs post-sequencing analysis(including SNP allele calls and counts of exons, genes, and splicejunctions from RNA samples) of data from reads aligned to the reference genome.Open ArchitectureGenomeStudio Software offers a flexible and open architecture foreasy integration with third-party applications and tools. Available application programming interfaces (API) ensure that GenomeStudio Software serves as a robust core of any analysis workflow. GenomeStudioSoftware offers an API for each module that permits users to createFigure 2: GenomeStudio System RecommendationsPARAMETERSEQUENCING DATA ANALYSISMICROARRAY DATA ANALYSISMICROARRAY AND SEQUENCINGDATA ANALYSISCPU SpeedIntel Pentium 2.0 GHz or fasterIntel Celeron Duo or fasterIntel Celeron Duo or fasterProcessor32-bit or 64-bit64-bit*64-bitMemory2 GB or more4 GB or more4 GB or moreHard Drive250 GB or larger100 GB or larger250 GB or largerVideo Display1,280 1,0241,280 1,0241,280 1,024Operating SystemWindows XP SP2 or VistaWindows XP SP2 or VistaWindows XP SP2 or VistaSpecific OSRequirementsMicrosoft .NET Framework 3.5Microsoft .NET Framework 3.5Microsoft .NET Framework 3.5NetworkConnection1 GbE or faster1 GbE or faster1 GbE or faster*GX and M Module data analysis can be performed on 32-bit systems
Data Sheet: Systems and Softwarereport plug-ins (dlls) for parsing data from GenomeStudio Software todownstream analysis tools. The illumina Connect third party partnership program encourages informatics software vendors and the opensource community to leverage this open architecture. This programhas led to several custom report plug-ins created and supported byvarious illumina Connect partners1.SummaryGenomeStudio Software provides a diverse and integrated platformfor data analysis of Illumina assays. Researchers doing sequencing,genotyping array, and gene expression array experiments use thesame powerful software package. The graphical display of resultsgenerated from primary data analysis with assay-specific modulessupports high-level and in-depth views of whole-genome variation.Integrated analysis is directly supported by combining data from different modules into a single ering InformationAccess to appropriate GenomeStudio modules is included with instrument purchase. Licenses for additional users and applications may bepurchased separately. Representative options are listed below, and afull listing is available in the Illumina Product Guide2.Ordering InformationProductSeat LicenseCatalog No.GenomeStudio DNA Sequencing ModuleSingle SeatSW-600-1001Five SeatSW-600-5001GenomeStudio ChIP-Seq ModuleSingle SeatSW-500-1001Five SeatSW-500-5001Single SeatSW-700-1001Five SeatSW-700-5001Single SeatSW-100-1001Five SeatSW-100-5001Single SeatSW-200-1001Five SeatSW-200-5001Single SeatSW-300-1001Five SeatSW-300-5001GenomeStudio Protein Analysis ModuleSingle SeatSW-400-1001GenomeStudio Sequencing Bundle (Includes DS, RS, CS Modules)Single SeatSW-820-1001Five SeatSW-820-5001EnterpriseSW-820-2001Single SeatSW-810-1001Five SeatSW-810-5001EnterpriseSW-810-2001Five SeatSW-800-5001EnterpriseSW-800-2001GenomeStudio RNA Sequencing ModuleGenomeStudio Genotyping ModuleGenomeStudio Gene Expression ModuleGenomeStudio Methylation ModuleGenomeStudio Microarray Bundle (Includes GT, GX, M Modules)GenomeStudio Software Integrated System Bundle (All Modules)Illumina, Inc. 9885 Towne Centre Drive, San Diego, CA 92121 USA 1.800.809.4566 toll-free 1.858.202.4566 tel techsupport@illumina.com illumina.comFOR RESEARCH USE ONLY 2010 Illumina, Inc. All rights reserved.Illumina, illuminaDx, Solexa, Making Sense Out of Life, Oligator, Sentrix, GoldenGate, GoldenGate Indexing, DASL, BeadArray,Array of Arrays, Infinium, BeadXpress, VeraCode, IntelliHyb, iSelect, CSPro, GenomeStudio, Genetic Energy, HiSeq, and HiScan areregistered trademarks or trademarks of Illumina, Inc. All other brands and names contained herein are the property of their respectiveowners. Pub. No. 970-2008-038 Current as of 9 January 2009
Software for primary data analysis of genetic data. GenomeStudio Software consists of a unified framework for common tasks that in-corporates seven discrete application modules for application-specific analysis (Figure 1). Integrated Framework GenomeStudio Software is a highly visual and intuitive platform for the analysis of data generated .