Transcription
Published by :http://www.ijert.orgInternational Journal of Engineering Research & Technology (IJERT)ISSN: 2278-0181Vol. 10 Issue 07, July-2021Data Analysis using PythonKiranbala NongthombamDeepika SharmaUniversity Institute of Sciences(Mathematics Department) Chandigarh University,Punjab, IndiaUniversity Institute of Sciences(Mathematics Department)Chandigarh University, Punjab, IndiaAbstract- In this paper, the analysis of data using PythonProgramming Language is studied. The very basic processes ofdata analysis like cleaning, transforming, modeling of data isbriefly explained in this paper and focus more on exploratorydata analysis of an already existing dataset and finding theinsights. Some graphical analysis of the data from the dataset willbe shown using different libraries and functions of Python. Here,a dataset named “World Happiness report 2021” is used toanalyze and extract various information in both numerical andpictorial form.Keywords:- Data analysis; python; data visualization; pandas;seaborn; exploratory data analysisI.INTRODUCTIONData are those raw facts and figures with no properinformation hence need to be processed to get the desiredinformation. While information is those results which we getafter processing the raw data in different levels or extractedconclusions from a given dataset through a process called dataanalysis.Data Analysis is simply the analysis of various data meanscleaning the data, transforming it into understandable form, andthen modeling data to extract some useful information forbusiness use or an organizational use. It is mainly used in takingbusiness decisions. Many libraries are available for doing theanalysis. For example, NumPy, Pandas, Seaborn, Matplotlib,Sklearn, etc. [7]. NumPy: NumPy is a library written in Python, usedfor numerical analysis in Python. It stores the data inthe form of nd-arrays (n-dimensional arrays). Pandas: Pandas is mainly used for converting data intotabular form and hence, makes the data morestructured and easily to read. Matplotlib: Matplotlib is a data visualisation andgraphical plotting package for Python and itsnumerical extension NumPy that runs on all platforms. Seaborn: Seaborn is a Python data visualisationpackage based on matplotlib that is tightly connectedwith pandas data structures. The core component ofSeaborn is visualisation, which aids in dataexploration and comprehension. Sklearn: Scikit-learn is the most useful library formachine learning in Python. It includes numeroususeful tools for classification, regression, clustering,and dimensionality reduction.Data visualization will help the data analysis to make it moreunderstandable and interactive by plotting or displaying thedata in pictorial form. Pandas, a Python open-source packagethat deals with three different data structures: series, dataIJERTV10IS070241frames, and panels, solves that need of analyzing andvisualization of data [2].Data analysis using Python makes task easier since PythonProgramming language has many advantages over any otherprogramming language. It has prominent features like being ahigh-level programming language (the codes are in humanreadable form) it is easy to understand and use by anyprogrammer or user. Many libraries and functions for statistical,numerical analysis are available in Python. Moreover, thesource code is freely available to anyone (free and open source).This paper includes all the basic terms and functions which aremuch needed by a beginner to know what data analysis is. Thepaper is divided broadly into 4 sections. In section II, the mainsteps in data analysis will be discussed. In section III, dataanalysis using python will be studied with all the basic needs ofpython in doing data analysis and data visualization will aid theanalysis by representing them in picture format. In section IV,conclusion of the paper is given.II.MAIN PHASES IN DATA ANALYSISA. Data requirementsData are the most important unit in any study. Data mustbe provided as inputs to the analysis based on the analysis’requirements. The term “experimental unit” refers to the typeof organization that would be used to gather data (e.g., aperson or population of people). It is possible to identify andobtain specific population variables (such as height, weight,age, and salary). It doesn’t matter whether the data isnumerical or categorical.B. Data Collecting:The collecting of data is simply known as Data Collecting.Data is gathered from a variety of sources, including relationaldatabases, cloud databases, and other sources, depending onthe study’ needs. Field sensors, such as traffic cameras,satellites, monitoring systems, and so on, can also be used asdata sources.C. Data processingData that are collected must be processed or organized foranalysis. For instance, these may involve arranging data intorows and columns in a table format (known as structured data)for further analysis, often through the use of spreadsheet orstatistical software.D. Data cleaning:The method of cleaning data after it has been processedand organized is known as data cleaning. It scans for datawww.ijert.org(This work is licensed under a Creative Commons Attribution 4.0 International License.)463
Published by :http://www.ijert.orgInternational Journal of Engineering Research & Technology (IJERT)ISSN: 2278-0181Vol. 10 Issue 07, July-2021inconsistencies, duplicates, and errors, and then removesthem. The data cleaning process includes tasks such as recordmatching, identifying data inaccuracy, data sort, outlier dataidentification, textual data spell checker, and data qualitymaintenance. As a consequence, it keeps us from havingunexpected outcomes and assists us in delivering high-qualitydata, which is essential for a successful outcome.C. Platform used: Anaconda (Jupyter Notebook)D. Dataset used: World Happiness record 2021E. Exploratory data analysis:Once the datasets are cleaned and free of error, it can thenbe analyzed. A variety of techniques can be applied such asexploratory data analysis- understanding the messagescontained within the obtained data and descriptive statisticsfinding average, median, etc. Data visualization is also atechnique used, in which the data is represented in a graphicalformat in order to obtain additional insights, regarding theinformation within the data [4].F. Modeling and algorithms:Mathematical formulas or models (known as algorithms),may be applied to the data in order to identify relationshipsamong the variables; for example, using correlation or causation.G. Data productA data product, is a computer application that takes datainputs and generates outputs, feeding them back into theenvironment. It may be based on a model or algorithm.III.DATA ANALYSIS USING PYTHONIn this section, data analysis using python will be studied. Themost basic things like why using python for data analysis willbe understood. Moreover, how anyone can start using pythonwill be shown. The important libraries, the platforms, thedataset to carry out the analysis will be introduced. Usage ofvarious python functions for numerical analysis are givenalong with various methods of plotting graphs or charts arediscussed.A. Why using Python?Python is a high-level, interpreted, multi-purposeprogramming language. Many programming paradigms rogramming is supported in python. It can be used for manyapplications, that includes statistical computing with variouspackages and functions. Moreover, it is easy to learn. It canbe picked up by anyone including those who has lessprogramming skills [9].Some features of Python are as listed below: Open source and free Interpreted language Dynamic typesetting Portable Numerous IDEFig. 1. A view of the dataset (World Happiness record 2021)E. Working with dataset Importing libraries:Libraries that would be used in the process of analysis are to beimported first. Here are the codes to import the libraries.import pandas as pdimport numpy as npimport matplotlib.pyplot as pltimport seaborn as snsFig. 2. Importing libraries Importing datasetHere, the dataset (World Happiness report 2021) is imported inthe jupyter notebook.mydata pd.read csv(“World Happiness report 2021.csv”)mydataB. Packages used: NumpyPandasSeabornMatplotlibIJERTV10IS070241Fig. 3. Importing datasetwww.ijert.org(This work is licensed under a Creative Commons Attribution 4.0 International License.)464
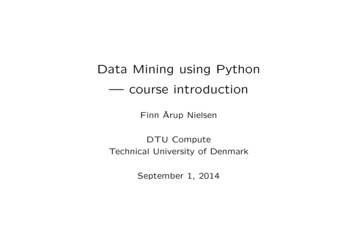
Published by :http://www.ijert.orgInternational Journal of Engineering Research & Technology (IJERT)ISSN: 2278-0181Vol. 10 Issue 07, July-2021 Cleaning DataRemoving unwanted data or null values are done in the processof data cleaning. So, first we need to check the dataset whetherit contains any null value or empty cells [6].# isnull() returns true in the entry where there is no value or NAvalue. And sum() is used together with isnull() to find the totalnumber of null values in every columns.mydata.isnull().sum()F. Exploratory Data AnalysisIn statistics, exploratory data analysis is an approach ofanalyzing data sets to summarize their main characteristics,often using statistical graphics and other data visualizationmethods. A statistical model can be used or not, but primarilyEDA is for seeing what the data can tell us beyond the formalmodeling or hypothesis testing task. Exploratory data analysiswas promoted by John Tukey to encourage statisticians toexplore the data, and possibly formulate hypotheses that couldlead to new data collection and experiments [4][8]. Data types: Datatype refers to the type of data- int,object, float are the basic datatypes in python. Printingthe types of data of all the columns in the dataset usingdtypesmydata.dtypesFig. 4. Checking null values in the datasetAccording to our needs for the analysis, we can extract someparticular rows or records from the dataset. Here is an exampleto extract the top most and last rows from the dataset.#head() is used to extract the top-most data in the dataset. 5 isthe default value of the head(). Here, top 10 rows from thedataset is taken.headdata mydata.head(10) headdataFig. 7. Datatypes of the whole coumns in the dataset Describing the dataset: Describing data of a datasetmeans extracting the summary of the given dataframesuch as mean, count, min, max, etc. It can be doneusing describe() function-For the whole dataset: mydata.describe()Fig. 5. Top 10 rows of the dataset#tail() is used to extract the last rows in the dataset. 5 is thedefault value of the tail(). taildata mydata.tail(10) taildataFig. 8. Summary of the whole datasetFig. 6. Last 10 rows of the datasetIJERTV10IS070241www.ijert.org(This work is licensed under a Creative Commons Attribution 4.0 International License.)465
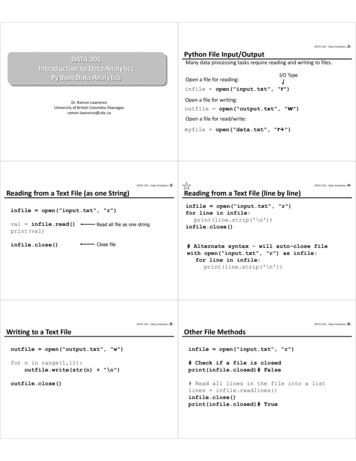
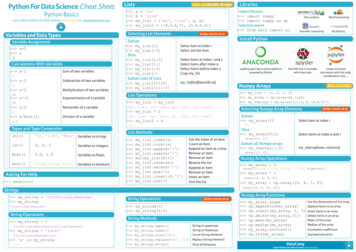
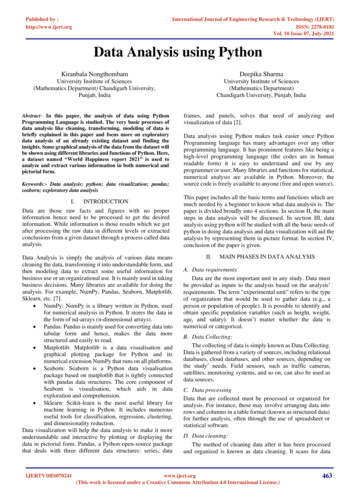
Published by :http://www.ijert.orgInternational Journal of Engineering Research & Technology (IJERT)ISSN: 2278-0181Vol. 10 Issue 07, July-2021For some selected rows: taildata.describe()outliers. We also divided GEDA into three categories:Univariate GEDA, Bivariate GEDA, and Multivariate GEDA.We’ll go through these important varieties in more detail in thefollowing paragraphs and aspects of GEDA [5].First, a subset of the dataframe is taken to analyse or visualizeusing it.Fig. 9. Summary of some selected entries(10 last rows) Correlations: Correlation shows the relation betweenany two variables in the dataset. The strength of alinear relation between two variables is measured bycorrelation. Printing Correlation of various attributesusing corr() [1].# For whole datasetmydata.corr()Fig. 12. A subset of the dataframe1.Univariate GEDA Histogram: A histogram is a data representation thatlooks like a bar graph that buckets a variety ofoutcomes into columns along the x-axis. The y-axiscan be used to illustrate data distributions byrepresenting the numerical count or percentage ofoccurrences in each column. Histogram in python canbe drawn using matplotlib.pyplot.hist()-Fig. 10. Correlation of the whole dataset# For some selected coulmns or attributesmydata[[‘Country name’, ‘Regional indicator’, ‘Ladderscore’, ‘Standard error of ladder score’, ‘Logged GDP percapita’, ‘Social support’, ‘Healthy life expectancy’,‘Generosity’, ‘Perceptions of corruption’]].corr()Fig. 13. Histogram Stem Plot: A stem plot draws vertical lines from thebaseline to the y axis and sets a marker at each x point.The x-positions are not necessary. The formats can bespecified as keyword-arguments or as positionalarguments. Stem plot in python can be drawn usingmatplotlib.pyplot.stem()Fig. 11. Correlation of some attributes in the datasetG. Graphical EDAFundamentally, graphical exploratory data analysis is thegraphical equivalent to conventional non-graphical exploratorydata analysis. EDA that examines data sets in order tosummarise their statistical characteristics by focusing on thesame four main features, such as measures of central tendency,measures of spread, distribution form, and the presence ofIJERTV10IS070241Fig. 14. Stem plotwww.ijert.org(This work is licensed under a Creative Commons Attribution 4.0 International License.)466
Published by :http://www.ijert.org International Journal of Engineering Research & Technology (IJERT)ISSN: 2278-0181Vol. 10 Issue 07, July-2021Box Plot: Box plot is a visual representation of andcomparison of groups of data. The box plot depicts thelevel, spread, and symmetry of a data distribution byusing the median, approximate quartiles, outliers, andthe lowest and highest data points (extreme values)[10].Fig. 17. Heatmap Fig. 15. Boxplot2.Count Plot: A Seaborn count plot is a graphicalrepresentation of the number of occurrences orfrequency for each category data using bars to depictthe number of occurrences or frequency. Thecountplot() function is used to visualize the number ofobservations in each categorical category as bars.Here, Count plot is plotted for the subdata dataframe.Multivariate GEDA Scatter plot: Dots are used to indicate values for twodifferent numeric variables in a scatter plot. The valuesfor each data point are indicated by the position of eachdot on the horizontal and vertical axes. Scatter plotsare used to see how variables relate to one another.Here, scatter plot of “Ladder score” against “Standarderror of ladder score” is plotted below-Fig. 18. CountplotIV.Fig. 16. Scatter Plot Heat Maps: A heatmap is a graphical depiction of datathat uses a color-coding method to represent variousvalues. It represents two- dimensional table of colorshades. This technique of plotting is popularly used inbiology to represent gene expression and othermultivariate data [3].A heatmap example is shown in the fig. 17.CONCLUSIONIn this paper, various phases of data analysis including datacollection, cleaning and analysis are discussed briefly.Explorative data analysis is mainly studied here. For theimplementation, Python programming language is used. Fordetailed research, jupyter notebook is used. Different Pythonlibraries and packages are introduced. Using various analysisand visulaization methods, numerous results are extracted. Thedataset “World Happiness Record 2021” is used and extractimportant informations like the difference in the score ofhappiness of different countries, the dependence of one attributein building up the score, how a variable affects another variable,etc. are seen in this analysis and various graphs has been plottedusing various attributes in the dataset and draw conclusions inan easy way.V.ACKNOWLEDGMENTI express my heartfelt gratitude towards my mentor Ms.Deepika Sharma for guiding me to accomplish such a greatwork. I offer my sincere appreciation towards the Head ofDepartment, University Institute of Sciences (MathematicsDepartment), Chandigarh University for giving me such achance to gain a wider view of knowledge.IJERTV10IS070241www.ijert.org(This work is licensed under a Creative Commons Attribution 4.0 International License.)467
Published by :http://www.ijert.orgInternational Journal of Engineering Research & Technology (IJERT)ISSN: 2278-0181Vol. 10 Issue 07, July-2021VI.REFERENCES[1] Viv Bewick, Liz Cheek, and Jonathan Ball. Statistics review 7: Correlationand regression. Critical care, 2003.[2] Dr Ossama Embarak, Embarak, and Karkal. Data analysis andvisualization using python. Springer, 2018.[3] Nils Gehlenborg and Bang Wong. Heat maps. Nature Methods, 2012.[4] Michel Jambu. Exploratory and multivariate data analysis. Elsevier, 1991.[5] Matthieu Komorowski, Dominic C Marshall, Justin D Salciccioli, and YvesCrutain. Exploratory data analysis. Secondary analysis of electronichealth records, 2016.[6] Wes McKinney. Python for data analysis: Data wrangling with Pandas,NumPy, and IPython. ” O’Reilly Media, Inc.”, 2012.IJERTV10IS070241[7] Fabio Nelli. Python data analytics: Data analysis and science usingPANDAs, Matplotlib and the Python Programming Language. Apress,2015.[8] Kabita Sahoo, Abhaya Kumar Samal, Jitendra Pramanik, and SubhenduKumar Pani. Exploratory data analysis using python. InternationalJournal of Innovative Technology and Exploring Engineering (IJITEE),2019.[9] Guido Van Rossum et al. Python programming language. In USENIXannual technical conference, 2007.[10] David F Williamson, Robert A Parker, and Juliette S Kendrick. The boxplot: a simple visual method to interpret data. Annals of internal medicine,1989.www.ijert.org(This work is licensed under a Creative Commons Attribution 4.0 International License.)468
much needed by a beginner to know what data analysis is. The paper is divided broadly into 4 sections. In section II, the main steps in data analysis will be discussed. In section III, data analysis using python will be studied with all the basic needs of python in doing data analysis and data visualization will aid the