Transcription
Performance and power efficiency ofDell PowerEdge servers with E5-2600 v2This white paper shows the performance and power efficiency improvementsof Dell PowerEdge and PowerEdge C servers with the Intel Xeon processor E5-2600 v2 product family.Solutions Performance AnalysisDell Enterprise Solutions Group
Performance and power efficiency of Dell PowerEdge servers with E5-2600 v2This document is for informational purposes only and may contain typographical errors and technicalinaccuracies. The content is provided as is, without express or implied warranties of any kind. 2013 Dell Inc. All rights reserved. Dell and its affiliates cannot be responsible for errors or omissions intypography or photography. Dell, the Dell logo, and PowerEdge are trademarks of Dell Inc. Intel and Xeon areregistered trademarks of Intel Corporation in the U.S. and other countries. Microsoft, Windows, and WindowsSQL Server are either trademarks or registered trademarks of Microsoft Corporation in the United Statesand/or other countries. Other trademarks and trade names may be used in this document to refer to either theentities claiming the marks and names or their products. Dell disclaims proprietary interest in the marks andnames of others.Members of Dell’s Solutions Performance Analysis team contributing to this whitepaper are: Louis Barton,Brian Bassett, John Beckett, Burton Culley, Burton Finley, Waseem Raja, Donald Russell, Daniel Turner, BruceWagner and Juergen Zimmermann.October 2013 Version 1.11ii
Performance and power efficiency of Dell PowerEdge servers with E5-2600 v2ContentsExecutive summary. 5Introduction . 5Key findings. 5Power efficiency with E5-2600 v2 . 5Performance with E5-2600 v2 . 5Methodology . 6Integer performance . 7SPEC CPU2006 integer tests . 7Java server tests . 9Floating point performance . 11SPEC CPU2006 floating point tests . 11HPC performance tests . 13Memory subsystem performance . 15Workloads performance . 16Database performance. 16VDI .17Virtualization . 18Big data . 19Power efficiency . 20Summary . 22Appendix A — Test configurations . 23iii
Performance and power efficiency of Dell PowerEdge servers with E5-2600 v2TablesTable 1: Benchmark configurations . 23FiguresFigure 1: Performance improvement running SPECint rate base2006 . 7Figure 2: Performance improvement running SPECint base2006 . 8Figure 3: Performance improvement running SPECjbb2005 . 9Figure 4: Performance improvement running SPECjbb2013 . 10Figure 5: Performance improvement running SPECfp rate base2006 . 11Figure 6: Performance improvement running SPECfp base2006 . 12Figure 7: Performance improvement running Linpack. 13Figure 8: Performance improvement running SPEC OMP2012 . 14Figure 9: Performance improvement running STREAM . 15Figure 10: Performance improvement running a database workload . 16Figure 11: Performance improvement running Login VSI .17Figure 12: Performance improvement running VMmark 2.5 . 18Figure 13: Performance improvement running HiBench K-Means Clustering benchmark . 19Figure 14: Power efficiency improvement of the R720 running the SPECpower ssj2008 benchmark . 20Figure 15: Power efficiency improvement of the M620 running the SPECpower ssj2008 benchmark 21iv
Performance and power efficiency of Dell PowerEdge servers with E5-2600 v2Executive summaryIntroductionDell PowerEdge and PowerEdge C servers are now available with the Intel Xeon processor E5-2600 v2product family, code named “Ivy Bridge-EP”. These new Xeon processors feature up to 12 cores and arefabricated on a 22-nanometer process for improved power efficiency.In order to show customers the performance and power efficiency improvements that E5-2600 v2 processorsbring to PowerEdge servers, Dell’s Solutions Performance Analysis team performed a series of benchmarksusing the new processors then compared the results to those obtained using the Intel Xeon processor E52600 product family, code named “Sandy Bridge-EP”.Based on the results of performed testing, PowerEdge servers with E5-2600 v2 processors perform 23% to50% better and have as much as 52% better power efficiency, compared to the same servers running E5-2600processors.Key findingsPower efficiency with E5-2600 v2 The PowerEdge R720 is the world’s most power-efficient server, achieving a 54% higher overall scorein the industry standard SPECpower ssj2008 benchmark with two E5-2660 v2 processors. The PowerEdge M620 is once again the world’s most power-efficient blade server, achieving a 51%higher overall score in the industry standard SPECpower ssj2008 benchmark with two E5-2660 v2processors.Performance with E5-2600 v25 The PowerEdge R720 server with two E5-2697 v2 processors supported 50% more virtual desktopsusing the industry standard Login VSI benchmark. The PowerEdge R620 server with two E5-2697 v2 processors achieved 48% higher gigaFLOPSrunning the Linpack scientific-computing benchmark.
Performance and power efficiency of Dell PowerEdge servers with E5-2600 v2MethodologyTo highlight the performance improvements gained by PowerEdge servers running E5-2600 v2 processors,few configuration changes were made between those runs and the runs with E5-2600 processors that wereused for comparison. However, as PowerEdge servers with E5-2600 v2 processors support up to 16 DIMMsrunning at 1866MT/s, that speed memory was used in most benchmarks, except as noted in Appendix A.6
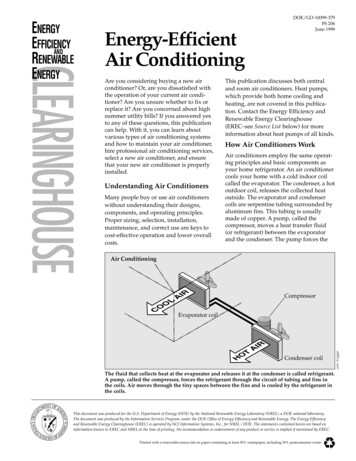
Performance and power efficiency of Dell PowerEdge servers with E5-2600 v2Integer performanceSPEC CPU2006 integer testsThe industry standard SPEC CPU2006 benchmark is described on SPEC.org as:CPU2006 is SPEC's next-generation, industry-standardized, CPU-intensive benchmark suite, stressinga system's processor, memory subsystem and compiler. SPEC designed CPU2006 to provide acomparative measure of compute-intensive performance across the widest practical range ofhardware using workloads developed from real user applications.The integer portion of the benchmark is particularly good at measuring a server’s ability to run generalbusiness applications. In Figure 1, we see a 41% improvement in the SPECint rate benchmark with E5-2600 v2processors.Figure 1: Performance improvement running SPECint rate base2006SPECint rate base2006100093880041%600666R620 with E5-2697 v2R620 with E5-269040020007
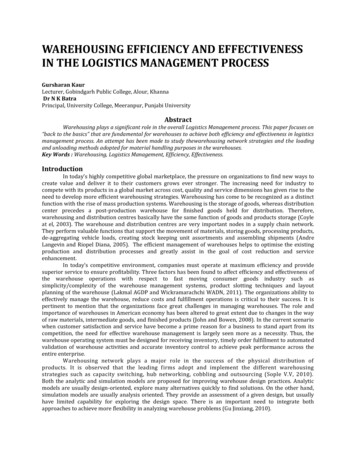
Performance and power efficiency of Dell PowerEdge servers with E5-2600 v2Even the SPECint base 2006 benchmark, which only runs a single copy of each benchmark, benefits with theupgrade to E5-2667 v2, as seen in Figure 2.Figure 2: Performance improvement running SPECint base2006SPECint base2006(higher is M620 with E5-2667 v2M620 with E5-2680
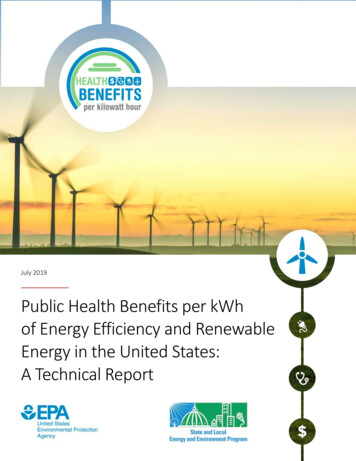
Performance and power efficiency of Dell PowerEdge servers with E5-2600 v2Java server testsThe SPECjbb2005 and SPECjbb2013 are also useful for measuring a server’s ability to run general businessapps. As described on SPEC.org:SPECjbb2005 (Java Server Benchmark) is SPEC's benchmark for evaluating the performance of serverside Java. SPECjbb2005 evaluates the performance of server side Java by emulating a three-tierclient/server system (with emphasis on the middle tier).SPECjbb2005 is a multithreaded benchmark, and as Figure 3 shows, scores 42% higher with E5-2697 v2.Figure 3: Performance improvement running SPECjbb2005SPECjbb2005 score(BOPS, higher is 00500,000091,493,52942%M620 with E5-2697 v2M620 with E5-2680
Performance and power efficiency of Dell PowerEdge servers with E5-2600 v2SPECjbb2005 was retired on October 1, 2013, for the newer SPECjbb2013 benchmark, which is described asfollows:A usage model based on a worldwide supermarket company with an IT infrastructure that handles amix of point-of-sale requests, online purchases and data-mining operations.As Figure 4 shows, the performance improvement with SPECjbb2013 is 33%.Figure 4: Performance improvement running SPECjbb2013SPECjbb2013 score(SPECjbb2013-MultiJVM max-jOPS, higher is 0,00001042,43133%R720 with E5-2697 v2R720 with E5-2690
Performance and power efficiency of Dell PowerEdge servers with E5-2600 v2Floating point performanceSPEC CPU2006 floating point testsFloating point performance is important to those running science, simulations and HPC workloads. SPECCPU2006 contains a suite of floating point tests which when in “rate” (multithreaded) mode, show a 39%performance improvement with E5-2697 v2, as seen in Figure 5.Figure 5: Performance improvement running SPECfp rate base2006SPECfp rate base2006(higher is better)80070068160050040030020010001139%491T620 with E5-2697 v2T620 with E5-2690
Performance and power efficiency of Dell PowerEdge servers with E5-2600 v2SPECfp base2006 runs a single copy of each benchmark. In Figure 6 we see a 26% performanceimprovement with the E5-2667 v2 processor.Figure 6: Performance improvement running SPECfp base2006SPECfp base200612010410082.88060402001226%M620 with E5-2667 v2M620 with E5-2680
Performance and power efficiency of Dell PowerEdge servers with E5-2600 v2HPC performance testsThe Linpack benchmark is used to measure a system’s floating point processing power by solving linearequations. We ran the Intel Optimized Linpack Benchmark against a single node using both generations ofprocessors. The E5-2697 v2 shows a 48% performance improvement, as seen in Figure 7.Figure 7: Performance improvement running LinpackLinpack performance(gigaFLOPS, higher is 0.013R620 with E5-2697 v2R620 with E5-2690
Performance and power efficiency of Dell PowerEdge servers with E5-2600 v2SPEC OMP2012 is another scientific computing benchmark, described on SPEC.org as:SPEC OMP2012 is designed for measuring performance using applications based on the OpenMP 3.1standard for shared-memory parallel processing. The benchmark suite includes 14 scientific andengineering application codes, covering everything from computational fluid dynamics (CFD) tomolecular modeling to image manipulation.Figure 8 shows that running E5-2697 v2 processors on the PowerEdge R720 provides a 38% upli
Performance and power efficiency of Dell PowerEdge servers with E5-2600 v2 9 Java server tests The SPECjbb2005 and SPECjbb2013 are also useful for measuring a server’s ability to run general business apps. As described on SPEC.org: SPECjbb2005 (Java Server Benchmark) is SPEC's benchmark for evaluating the performance of server side Java. SPECjbb2005 evaluates the