Transcription
Improving Cost Efficiency andCustomer Service for the PhoenixWater ServicesDepartmentRussell Becker, Les Stotler, Mark Roye - City of PhoenixEsteban Azagra - Red Oak Consulting
IT Governance New Deputy CIO position created in 2006for Water Services Department Reports to City CIO and Assistant WaterServices Director Joined the City in 2006 All of my prior work experience was inprivate sector
Business Issues Limited view of deployed assets No consolidated view of spare parts inventory No real-time work order scheduling Limited preventative maintenance Limited long term replacement cost forecasting Numerous manual data entry tasks resulted ininaccurate or inconsistent data No end-to-end view of customer servicerequests
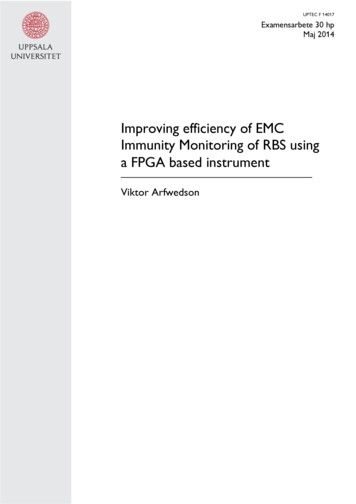
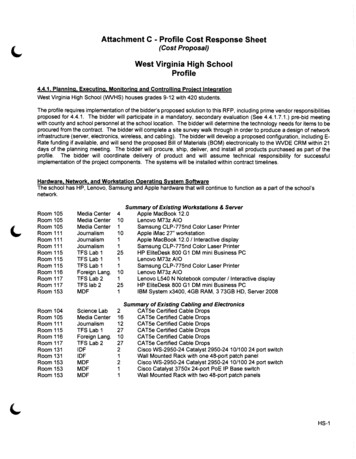
Technology bottleneck WSD and City SystemsData xcelWDSRWork OrderManagementSystemsHARS /SCADAGISManual DataExchangeMAPSSIERRAData Exchange(Manual)Manual DataExchangeHANSENManualReportsExcelCCB (WCIS)HRDataeCHRIS (PeopleSoft)
Why did this happen? No defined strategy for work order andasset management Water Services did not think departmentwide, technology decisions were made atdivision level Didn’t rely on citywide IT infrastructureWe needed a vision!
Department Goals in Three Broad AreasEnhanceCustomerServiceImprove AssetPerformanceBetterManage Costs
Goals to Enhance Customer ServiceStreamlineperformance reporting,focus and act on servicemetricsGIS integration, use GISintegration to creatework orders, locateassets, improve serviceEnhanceCustomerServiceSingle integrated workorder system , reduceresponse timesField crews to usemobile solution, livemapping, new workorders, and real-timestatus updates
Goals to Better Manage CostsConsolidate redundantsystems, reduce supportlabor, eliminate ITmaintenance feesIntegrate Service Ordersand Work Orders,eliminate duplicate dataentry labor costsManage the supplychain, reduce inventorycarrying costsBetterManage CostsUse asset management,to optimize R&Rbudgeting (long termcost control)Increase use of ReliabilityCentered Maintenance,reduce critical asset risk, andunplanned maintenancecosts
Goals to Improve Asset PerformanceUse consistent assetcharacteristics, shareassets and parts acrossall divisionsStreamlineperformance reporting,focus and act on assetperformance metricsTimely and accurateinventory, make soundmaintenance and R&RdecisionsImprove AssetPerformanceContinuousimprovement, assetmanagement practicesand system useIncrease use ofReliability CenteredMaintenance, optimizeperformance of criticalequipment
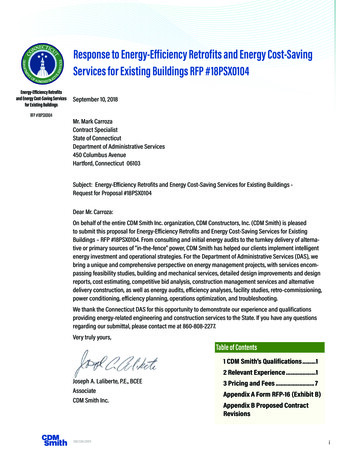
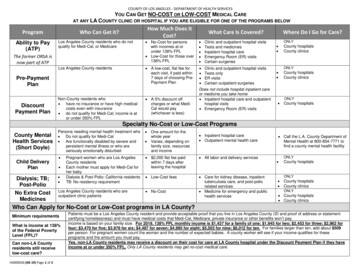
What did we do? Engaged Red Oak Develop business requirements Assess current technology Develop strategy Develop high level project plan and phases Develop a staffing and support planRecommendation: Migrateto Oracle’s WAM application
to an integrated solutionSAPOracleWAMGISPeopleSoftLegendOracle WAMOther Oracle ProductsCity/WSD Systems
Goals1. Consolidate Redundant IT Systems2. Consistent WAM Asset characteristics3. Timely and Accurate Inventory4. Integrated Service and Work OrderProcess5. Managed Supply ChainBalancing Goalsand Cost6. Reliability Centered Maintenance (RCM)at Plants7. Streamlined Performance Reporting8. Field Crew to Use Mobile Solution9. GIS Integration for WAM10. Optimize R&R Budget11. Continuously Improve12. Establish WAM Roles andResponsibilities
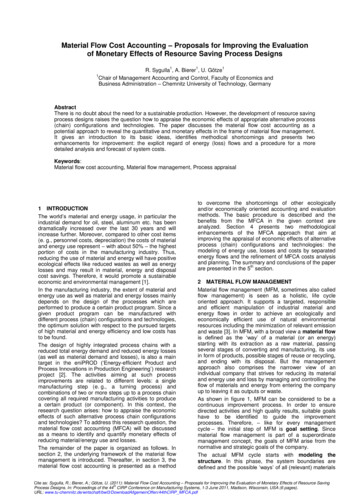
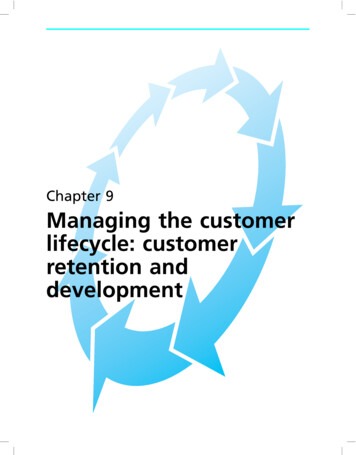
Oracle Business Analytics(Dashboards, Reports and Analysis)OracleCC&BFULL SYSTEMINTEGRATIONOracleWAMOracleMWMOracle Integration Services .FUTURESTATESAPHARS/UCOSESRI GISPeopleSoftLegendOracle Utilities SuiteOther Oracle ProductsCity/WSD Systems
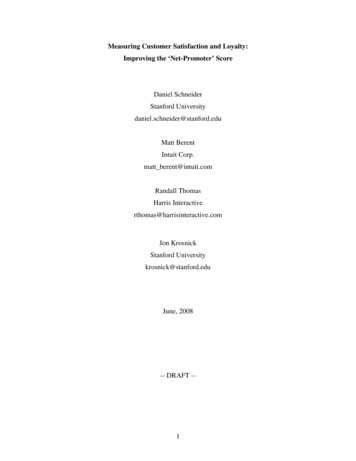
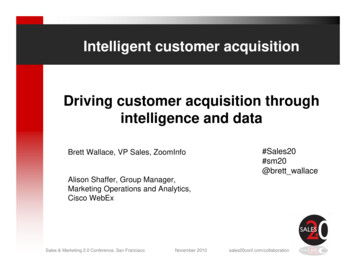
Background Population Served – 1,507,899 over 540 Sq. miles PlantsWater Production - 5Wastewater Treatment – 2 Miles of Linear InfrastructureWater – 6,953Wastewater – 4,984 AssetsWater – 1,570,000Wastewater – 670,000Hydrants – 54,001
Phoenix Area Water 4th STREETSaltRiverExisting Water Treatment PlantFuture Water Treatment PlantExisting Wastewater Treatment PlantReclaimed WastewaterExisting Water Reclamation Treatment PlantFuture Water Reclamation Treatment Plant
Preliminary ObservationsOrganizational No single individual or organizational unitresponsible for work and asset managementoversight Division-level organizations to support Work andAsset Management (WAM) are inconsistent System administration and enhancement supportfor “WAM” is minimal Most interviewed employees want change
Preliminary ObservationsWork Process Many “WAM” processes are disjointed Service request and work order coordination After-the-fact work orders; duplicate data entry Condition assessments separate from work ordermanagement Asset Inventory is not complete or consistently applied Asset Hierarchy is geography-based and may not facilitatedesired queries or reporting Work orders are not labor-costed Limited coordination of CIP/R&R planning and “WAM”processes
Preliminary ObservationsInformation Systems Current users OK with Oracle WAMVery little attachment to legacy work order systemsMany special purpose, obsolete software toolsVery little automatic integration of major systemsSoftware ease of use a big current and future issue
How did we do it Phase 1 – completed 9/26/12Collection and DistributionPhase 2 – currently ongoingDevelop Core Team and RolesBuild full two way integrationpoints with our GIS systemIntegration with other majorsystems, SAP and PeopleSoftRollout of mobile solution forthe field staffWater Treatment andPhase 3 – Start 2013Production plants conversion tothe new systemBuild integration points withthe Oracle Utility suite MWMIntegration with process control and CC&B(UCOS) for runtimeImplement full businessReconcile phase 1 decision and analytics applicationimprove business processes
Demo
Real OutcomesProjectCore TeamBusinessProcessPeopleTechnology
Project Phased projects will need to be reconciledafter completed implementation Survey your users often Don’t treat your vertical assets like linearassets Listen to the SME in “your” organization Start your change management early in theproject
Core Team Created the role of Asset Manager With the duties of Business Process Optimization Asset Organization Linear vs. Vertical Asset specifications consistency and QA/QC Role is similar to a Business Analyst with the focuson Assets Larger support staff after go live than youthink (consider 24x7)
People Steep learning curve for the end users Slow adoption to new business processes Continuous QA/QC is really necessary Continuous training Face time with the field staff at their location Share your reporting with the users, as well asmanagement
Technology Valuable integration with GIS Saved duplicate data entry with interface withfinancial system Field use of laptop has reduced travel time Easy access to GIS and live system data hasprovided increased productivity Document management Keeping vanilla has its drawbacks
Business Processes Standardized business processes across thedepartment for asset management and WOprocessing Increase accountability for inventory “Real” costing for assets maintenance Asset work history is more complete
Goals Report CardGoalsGrade1. Consolidate Redundant IT SystemsA 2. Consistent WAM Asset CharacteristicsA3. Timely and Accurate InventoryB4. Integrated Service and Work Order ProcessA5. Managed Supply ChainC6. Reliability Centered Maintenance (RCM) at PlantsPhase 27. Streamlined Performance ReportingPhase 28. Field Crew to Use Mobile SolutionB9. GIS Integration for WAMA10. Optimize R&R BudgetWIP11. Continuous ImprovementA12. Establish WAM Roles and ResponsibilitiesB
Financial Outcome Operating saving will be 2.7million dollars over the first fiveyears of this consolidation.
Financial Outcome Comparison of Four MaintenancePrograms : Reactive Maintenance (Breakdown or Run-toFailure Maintenance): Cost: 18/hp/yr Preventive Maintenance (Time-BasedMaintenance): Cost: 13/hp/yr Predictive Maintenance (Condition-BasedMaintenance): Cost: 9/hp/yr Reliability Centered Maintenance (Pro-Active orPrevention Maintenance): Cost: 6/hp/yrReference: Piotrowski, J. April 2, 2001. Pro-Active Maintenance for Pumps, Archives, February 2001 .
More reasons we will be more efficientin the future Proactive vs. Reactive Maintenance(increased system reliability) Reduced Asset Maintenance Costs Increased Accuracy of Future CIP Planning Single System Asset Information and History
Final Reason for Success--------Business Analytics-------- Management level reports Ability to drill down to details Speed to develop reports Ad-hoc reporting needs Ability to mash-up data sources Provide end user data analysis Fast user adoption Mobility
Answering key questions on performancefor everyoneWhat happened?Why?What should webe doing?
Questions/Comments?Contact informationRuss Becker, ITS Deputy CIOruss.becker@phoenix.govMark Roye, Water Services,WAM Project Managermark.roye@phoenix.govLes Stotler, ITS Applications Managerles.stotler@phoenix.gov
mobile solution, live mapping, new work orders, and real-time status updates . GIS integration, . Asset Inventory is not complete or consistently applied . SAP and PeopleSoft Rollout of mobile sol