Transcription
July 2019Public Health Benefits per kWhof Energy Efficiency and RenewableEnergy in the United States:A Technical Report
ContentsAcknowledgments. 1Executive Summary . 2When to use benefits-per-kWh screening values? . 2When not to use benefits-per-kWh values? . 2Benefits-per-kWh screening values . 2Understanding the Values . 4How to use BPK values?. 4Introduction . 5Background . 6Methods. 8Overview of Approach. 8Modeling Scenarios Development . 10Project, Program, and Policy Size Assumptions . 13Electricity and Emissions Modeling . 14Air Quality and Health Impact Modeling . 15Developing the Health Benefits-per-kWh Estimates . 16Uncertainty. 17Limitations . 19Results . 21Discussion . 27Conclusions . 29References . 30Appendix A: AVoided Emissions and geneRation Tool (AVERT) . 35Appendix B: Co-Benefits Risk Assessment (COBRA) Health Impacts Screening and MappingTool . 37Appendix C: Sensitivity Analyses on Project, Program, or Policy Size and Peak EnergyEfficiency Definition . 40Appendix D: Top 200 Hours of Demand Benefit-per-kWh Results. 49Appendix E: Health Impact Functions . 50Appendix F: Health Benefits Valuation. 52Appendix G: Detailed Benefits-per-kWh Results. 53Appendix H: Conversions . 56
AcknowledgmentsThis report was developed by EPA’s State and Local Energy and Environment Program withinthe Climate Protection Partnerships Division of EPA’s Office of Atmospheric Programs. DeniseMulholland led a technical team of EPA experts to develop this report, including EmmaZinsmeister, Robyn DeYoung, Nikolaas Dietsch, Neal Fann, and Elizabeth Chan, withsignificant analytic support from David Cooley and Kait Siegel of Abt Associates.The EPA technical team would like to thank Carolyn Snyder, Director of EPA’s ClimateProtection Partnerships Division, and Julie Rosenberg, Chief of EPA’s State and Local Branch,for their leadership on and support of this project.The team would also like to thank the following technical experts for comments they providedon earlier drafts of this report: Susan Annenberg (George Washington University), JamesCritchfield (EPA), Tom Eckman (Lawrence Berkeley National Laboratory), Mimi Goldberg(DNV GL), Etan Gumerman (Nicholas Institute, Duke University), Sara Hayes (AmericanCouncil for an Energy-Efficient Economy), Ed Holt (Ed Holt and Associates), David Hoppock(Maryland Public Service Commission), Jeff Loiter (Optimal Energy), Dev Millstein (LawrenceBerkeley National Laboratory), Jason West (University of North Carolina), and Ryan Wiser(Lawrence Berkeley National Laboratory).In addition, EPA would like to thank Pat Knight and Nina Peluso from Synapse EnergyEconomics Inc. and Ariel Horowitz from the Massachusetts Clean Energy Center (formerlyfrom Synapse Energy Economics, Inc) for their assistance with AVERT for this analysis.1
Executive SummaryEPA has developed a set of values that help state and local government policymakers and otherstakeholders estimate the monetized public health benefits of investments in energy efficiencyand renewable energy (EE/RE) using methods consistent with those EPA uses for health benefitsanalyses at the federal level. It’s important to note that EPA is continually reviewing methodsand assumptions for quantifying public health benefits. The values presented here and theassociated documentation will be updated as appropriate to reflect any future changes in methodsor assumptions.When to use benefits-per-kWh screening values?Benefits per kilowatt-hour (BPK) values are reasonableapproximations of the health benefits of state EE/REinvestments that can be used for preliminary analysiswhen comparing across state and local policy scenarios toindicate direction and relative magnitude.Examples of analyses where it would be appropriate to usethem include: Estimating the public health benefits of regional,state, or local-level investments in EE/RE projects,programs, and policiesUnderstanding the cost-effectiveness of regional,state, or local-level EE projects, programs, andmeasuresIncorporating health benefits in short-termregional, state, or local policy analyses anddecision-makingAudience for BPK screening valuesStakeholders interested inapproximating the outdoor air qualityrelated public health benefits fromEE/RE, including: State and local energy, air quality,or public health agenciesPublic utility commissionsEnergy efficiency and renewableenergy project developersIndustry organizationNongovernmental organizationsOther researchersWhen not to use benefits-per-kWh values?BPK values are not a substitute for sophisticated analysis and should not be used to justify or informfederal regulatory decisions. They are based on data inputs, assumptions, and methods that approximatethe dynamics of energy, environment, and health interactions and include uncertainties and limitations, asdocumented in the technical report.Benefits-per-kWh screening valuesEPA used a peer reviewed methodology and tools to develop a set of screening-level regionalestimates of the dollar benefits per kilowatt-hour from four different types of EE/RE initiatives. Uniform Energy Efficiency - Energy efficiency programs, projects, and measures thatachieve a constant level of savings over time,Peak Energy Efficiency - Energy efficiency programs, projects, and measures thatachieve savings during 12pm-6pm when energy demand is high (i.e. peak),Solar Energy – Programs, projects, and measures that increase the supply of solar energyavailable (e.g. utility-scale and rooftop solar generation), andWind Energy – Programs, projects, and measures that increase the supply of windavailable (e.g. wind turbines).2
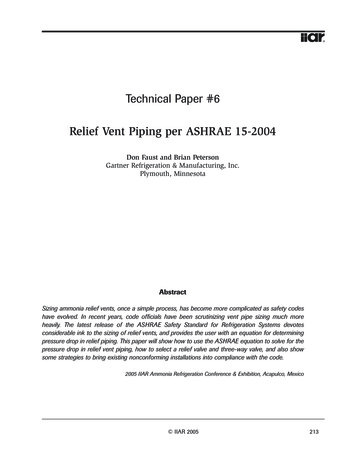
Table ES.1. 2017 Benefits-per-kWh Values (cents per kWh, 2017 USD) 1RegionCaliforniaGreat Lakes/ MidAtlanticLower MidwestNortheastPacific NorthwestRocky MountainsSoutheastSouthwestTexasUpper MidwestProject TypeUniform EEEE at PeakSolarWindUniform EEEE at PeakSolarWindUniform EEEE at PeakSolarWindUniform EEEE at PeakSolarWindUniform EEEE at PeakSolarWindUniform EEEE at PeakSolarWindUniform EEEE at PeakSolarWindUniform EEEE at PeakSolarWindUniform EEEE at PeakSolarWindUniform EEEE at PeakSolarWind3% Discount Rate2017 /kWh2017 /kWh(low estimate)(high 27.062.756.222.896.533.207.237% Discount Rate2017 /kWh2017 /kWh(low estimate)(high 86.302.455.552.585.832.856.45In addition to using these regional values, users can also use EPA’s AVERT and COBRA tools to develop more specific analyses,such as state- or county-level health benefits estimates. For more information on other more sophisticated options formodeling health benefits for or how to quantify the electricity impacts of energy efficiency and renewable energy, see the EPAreport, Quantifying the Multiple Benefits of Energy Efficiency and Renewable Energy: A Guide for State and Local Governments.13
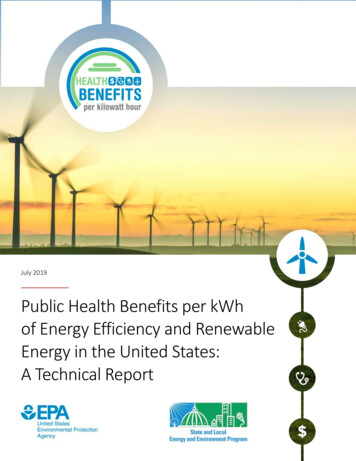
Understanding the ValuesEPA created BPK valuesusing existing tools, includingEPA’s AVoided Emissionsand geneRation Tool(AVERT) and CO-BenefitsRisk Assessment (COBRA)Health Impacts Screening andMapping Tool. BPK valuesare: Available for each ofthe four project typesfor each of the tenAVERT regionsshown in the mapFigure ES.1. AVERT Regions.belowBased on 2017electricity generation data and emissions, population, baseline mortality incidence rate,and income growth projectionsPresented in 2017 dollars and reflecting the use of either a 3% or a 7% discount rate asrecommended by EPA’s Guidelines for Preparing Economic Analyses (2010)Calculated using the same health impact functions EPA uses for regulatory impactanalyses, including the calculation of low estimates of mortality using health impactfunctions that assume people are not very sensitive to changes in PM 2.5 levels and highestimates of mortality using functions that assume people are more sensitive to changesin PM 2.5How to use BPK values?States and communities interested in having screening-level estimation of outdoor air qualityrelated health impacts of energy efficiency or renewable energy can multiply the BPK values,presented in Table ES. 1 in cents per kilowatt hour, by the number of kWh saved from EE orgenerated from RE to estimate potential health benefits from projects in dollars saved. Usersshould keep in mind there are uncertainties associated with any modeled estimates wheninterpreting or reporting results.4
IntroductionState and local government policymakers have increasingly been asking for theU.S. Environmental Protection Agency’s (EPA’s) help in understanding the opportunities forusing energy efficiency and renewable energy (EE/RE) to reduce air pollution and improvepublic health. Many recognize that EE/RE projects, programs, and policies can reduce airpollution emissions from the electric power sector either by decreasing demand for electricitygeneration or by displacing fossil fuel-based generation with zero-emitting sources of generation.They also recognize that these avoided emissions may lead to tangible public health benefits,such as reducing the number of premature deaths, incidences of respiratory and cardiovascularillnesses, and missed work and school days. 2 However, in many cases, state and local decisionmakers are not quantifying or fully reflecting the health benefits of existing or planned EE/REprojects, programs, and policies in their decision-making processes. EPA has found that state andlocal decision-makers may not be fully aware of or confident in the available quantification toolsand methods; or they lack the time, resources, or expertise needed to quantify the health benefits.EPA seeks to address this gap by providing state and local governments and their stakeholderswith tools and information to estimate the public health benefits of EE/RE. In particular, EPAhas developed screening-level regional estimates of the benefits per kilowatt-hour (kWh) ofEE/RE projects, programs, and policies. 3 The goal of these estimates is to create credible andcomparable values (i.e., factors) that stakeholders, such as state and local governments, EE/REproject developers, and nongovernmental organizations (NGOs), can use to estimate healthbenefits of EE/RE projects, programs, and policies. EPA has also sought to ensure that thesevalues are easy to use, and do not require state and local governments or other users to downloadspecific modeling software packages.This report describes EPA’s approach for developing this set of screening-level estimates of themonetized health benefits per kWh that represent the benefits from fossil fuel-based generationreduced or avoided as a result of EE, solar, and wind projects, programs, and policies. Theestimates use a 2017 profile of the electricity system to represent the benefits in the near-term ofEE/RE projects, programs, and policies that have already been or are about to be implemented.The resulting health benefits-per-kWh (BPK) values can be used by state and local governments,EE/RE project developers, and other stakeholders to develop a more complete picture of thepublic health benefits of existing or proposed EE/RE projects, programs, and policies. Note thatbecause BPK values provide a screening-level estimate of health benefits of EE/RE, they maynot be appropriate for certain analyses, such as federal air quality rulemaking. It’s also importantto note that EPA is continually reviewing its methods and assumptions for quantifying publichealth benefits. The health BPK values presented here and the associated documentation will beupdated as appropriate to reflect any future changes in EPA methods or assumptions.2The Health Effects Institute (2018) estimates that in 2016, 105,669 premature deaths in the United States wereattributable to air pollution [93,376 due to fine particulate matter (PM2.5) and 12,293 due to ozone (O3)].3These estimates include the contiguous United States, but do not include Alaska and Hawaii. These states are notincluded in the AVoided Emissions and geneRation Tool (AVERT) used to estimate impacts of EE/RE on airpollution emissions because they do not report emissions data for most of their electric generating units (EGUs) toEPA. Alaska and Hawaii are also not included in the Co-Benefits Risk Assessment (COBRA) Health ImpactsScreening and Mapping Tool used to estimate the health impacts of EE/RE because they were not included in the airquality modeling originally used to develop the tool.5
BackgroundElectricity generation in the United States is essential to our economy but it also results insignificant emissions of air pollution, depending upon how it is generated. In 2014, the electricitygeneration sector emitted more than 1 million tons each of nitrogen oxides (NO x ) and sulfurdioxide (SO 2 ); and more than 170,000 tons of PM 2.5 , which is more than the PM 2.5 emissions ofhighway vehicles in that year (EPA 2018). Emissions of these pollutants can result in serioushealth impacts, including premature mortality, non-fatal heart attacks, asthma exacerbations, andother respiratory diseases. EPA’s retrospective analysis of the Clean Air Act (CAA) found thatapproximately 85 percent of the public health benefits of air quality regulations are due to PMreductions, with the remainder coming from other air pollutants, such as ozone (O 3 ) (EPA2011b).While the U.S. electric power sector has historically been a significant source of air pollution, thesector has undergone rapid change in recent years. Between 2007 and 2016, coal and oilgeneration sources combined have decreased from just over 50 percent of the U.S. generationresource mix to 31 percent; and renewables, including wind, solar, and geothermal, haveincreased from just over 1 percent to nearly 7 percent of the resource mix (Table 1). Similarly,electricity savings from energy-efficiency programs were over 180 terawatt hours (TWh) in2016, an increase of more than 115 percent from 2008 (IEI 2017). All of these changes amountto a cleaner U.S. electric power sector with reduced emissions and health impacts.Table 1. U.S. Generation Resource Mix, 2007–2016Generation Resource Mix 7.50.51.66.219.54.40.40.40.1201630.40.6Source: EPA ilIn order to help state and local governments quantify the health benefits of EE/RE, EPA firstneeded to understand the current state of the scientific literature to determine if there are bestpractices or factors that states could apply. EPA commissioned a literature review that examinedmore than 60 studies for BPK values in order to better understand current methods and healthbenefits of EE/RE projects, programs, and policies (EPA 2017). Through the literature review,EPA found that the results varied depending on the approach used, the benefits included, and thegeographic focus of the analysis. Therefore, the resulting sets of BPK values identified in theliterature review were not easily comparable to one another.Lawrence Berkley National Laboratory (LBL), for example, published several studies examiningboth the prospective and retrospective health benefits from wind, solar, and renewable portfoliostandard (RPS) programs across the United States (Table 2). The benefits reported by each studyare an average value of health benefits calculated using multiple different air quality and healthimpact models, including the Air Pollution Emission Experiments and Policy Analysis Model6
(AP2), EPA’s benefit-per-ton methodology, EPA’s CO-Benefits Risk Assessment (COBRA)Health Impacts Screening and Mapping Tool, and the Estimating Air Pollution Social ImpactUsing Regression (EASIUR) model. Overall, these studies provide a range nationally between2.6 /kWh and 10.1 /kWh for recent years, and between 0.4 /kWh and 8.2 /kWh when lookingprospectively. Other studies included in the literature review generated a different range ofresults that were not directly comparable to the LBL estimates, typically because they used avariety of models or included additional benefits. For example, some of the models used instudies identified in the literature review include non-health, welfare benefits, such as avoidingdamages from decreased timber and agricultural yields, reduced visibility, acce
and geneRation Tool (AVERT) and CO-Benefits Risk Assessment (COBRA) Health Impacts Screening and Mapping Tool. BPK values are: Available for each of the four project types for each of the ten AVERT regions shown in the map below Based on 2017 electricity generation data and