Transcription
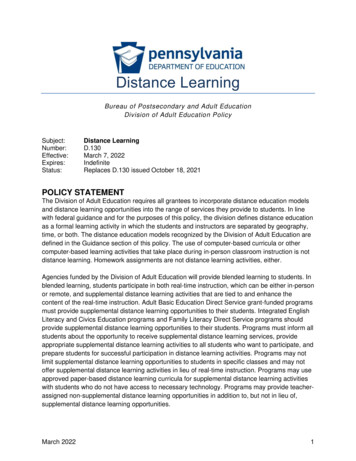
DISTANCE EDUCATIONSPRING 2022 Snapshot Report
Texas Woman’s UniversityDistance Education Summary ReportSpring 2022General InformationDistance Education Courses OfferedCollege of Arts and Sciences Degrees Offered Electronically Bachelor of Applied Arts and Sciences in Professional Studies Bachelor of General Studies Bachelor of Science in Criminal Justice Bachelor of Science in Informatics Bachelor of Science in Sociology Master of Arts in Multicultural Women’s and Gender Studies Master of Arts in Sociology Master of Arts in Theatre Master of Science in Informatics Professional Science Masters in Biotechnology Doctor of Philosophy in RhetoricCollege of Business Degrees Offered Electronically Bachelor of Business Administration (Accounting, Finance, Health CareAdministration, Human Resources Management, Management,Marketing) Master of Business Administration (Accounting, Business Analytics,General Business, Healthcare Administration, Human ResourcesManagement, Marketing, Sport Management, Women in Leadership) Master of Health Care Administration (Business Analytics, GlobalHealth)College of Health Sciences Degrees Offered Electronically Bachelor of Applied Arts and Sciences in Health Sciences Bachelor of Applied Science in Health Studies RDH to Bachelor of Science in Dental Hygiene Bachelor of Science in Health Informatics Bachelor of Science in Health Studies Bachelor of Science in Kinesiology Master of Public Health Master of Science in Education of the Deaf Master of Science in Health Studies Master of Science in Kinesiology (Coaching or Sport Mgt. Emphases) Master of Science in Nutrition Master of Science in Speech-Language Pathology Doctor of Philosophy in Health Studies Doctor of Philosophy in Occupational TherapyCollege of Nursing Degrees Offered Electronically RN to Bachelor of Science in Nursing Master of Science in Nursing - Nursing Education Master of Science in Nursing-Nurse Practitioner Doctor of Nursing Practice Doctor of Philosophy in Nursing ScienceCollege of Professional Education Degrees Offered Electronically Bachelor of Science in Child Development Bachelor of Science in Education EC-6 Bachelor of Science in Family Studies Master of Arts in Library Science Master of Arts in Multilingual and Multicultural Studies Master of Arts in Teaching Master of Education in Early Childhood Education Master of Education in Educational Leadership Master of Education in Reading Education Master of Education in School Counseling Master of Education in Special Education Master of Education in Teaching, Leadership & Collaboration Master of Library Science Master of Science in Child Development Master of Science in Child Life Master of Science in Family Studies Doctor of Philosophy in Educational Leadership and OrganizationFall 2021Spring 2022Unique distance education courses . 642 . 627Total distance education sections . 1289 . 1202Distance Education Student FactsFall 2021Spring 2022Total students enrolled . 12728 . 100.0% . 11493 . 100.0%Students in DE courses only . 6824 . 53.6% . 6082 . 53.0%Students in DE/F2F Combo. 5904 . 46.4% . 5411 . 47.0%EthnicityFall 2021Spring 2022Caucasian . 176 . 1.4% . 101 . 0.9%African American . 108 . 0.8% . 84 . 0.7%Asian American . 48 . 0.4% . 23 . 0.2%American Indian/Alaskan . 6 . 0.0% . 1 . 0.0%Hispanic . 173 . 1.4% . 103 . 0.9%International . 12 . 0.1% . 5 . 0.0%Other . 12205 . 95.9% . 11176 . 97.3%GenderFall 2021Spring 2022Female . 11678 . 91.7% . 10548 . 91.8%Male . 1042 . 8.2% . 941 . 8.2%Not Reported . .8 . 0.1% . 4 . 0.0%Academic level by instructional methodFall 2021Spring 2022Graduate-DE Only. 3737 . 3335Graduate-DE/F2F . 1242 . 1087Undergraduate-DE Only. 3087 . 2747Undergraduate-DE/F2F . 4662 . 4324Age—students in distance education courses onlyFall 2021Spring 202221 & under . 768 . 87522-30 . 3302 . 277031-40 . 1621 . 144241-50 . 815 . 70851 . 318 . 287Location (Spring 2022)DE OnlyDE/F2FTexasStudentsStudentsAlamo Region . 142 . 36Capital Region. 200 . 40Central Texas Region . 101 . 30Coastal Bend Region . 32 . 10Gulf Coast Region . 924 . 649High Plains . 52 . 8Metroplex . 4027 . 4458Northwest Texas Region . 29 . 16South Texas Border . 58 . 18Southeast Texas. 20 . 10Texas Panhandle. 0 . 0Upper East Texas Region . 49 . 49Upper Rio Grande Region . 30 . 8West Texas . 26 . 10Out-of-State. 379 . 69Out-of-Country. 13 . 0TWU Office of Teaching & Learning with Technologyhttp://www.twu.edu/TLT2
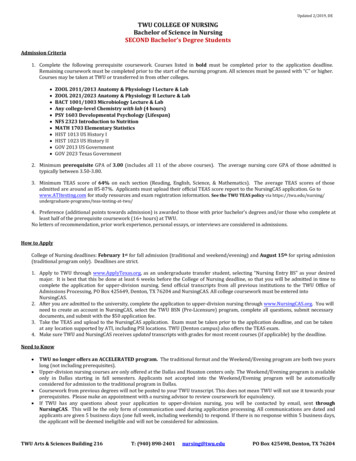
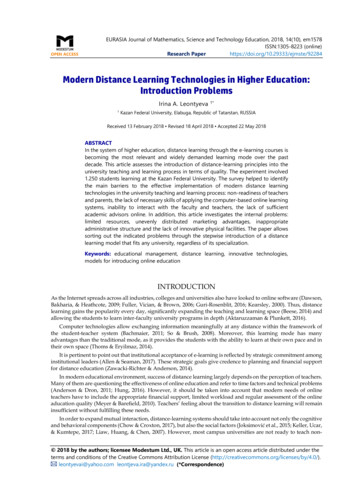
Texas Woman's UniversityDistance Education l2017Spring2018Fall2018Spring2019Fall2019 22Students Taking DE 6918613958130211272811493Students Taking Only DE 941738126823568246082TWU Office of Teaching and Learning with TechnologySpring 20223
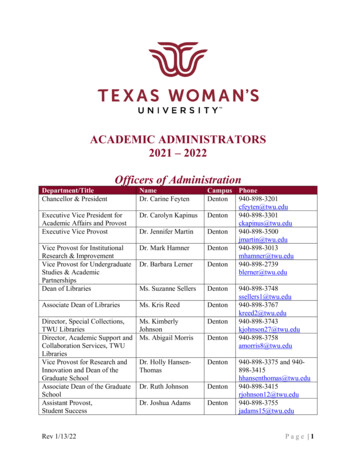
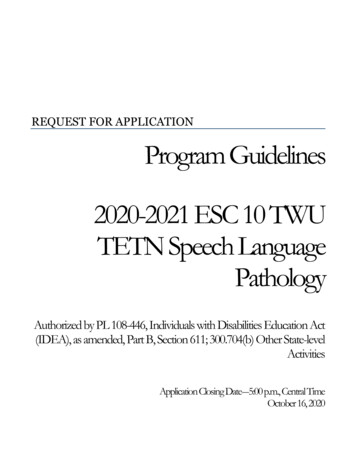
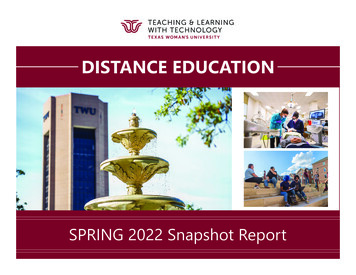
Students Taking Distance Education Classes OnlySpring 20226082Fall 20216824Spring 20218235Fall 20208126Spring 20204173Fall 2019 - 4209Spring 20193961Fall 20184000Spring 20183455Fall 20173752Spring 20173555Fall 20163872Spring 20163542Fall 20153811Spring 20153639Fall 20143834010002000TWU Office of Teaching and Learning with TechnologySpring 202230004000500046000700080009000
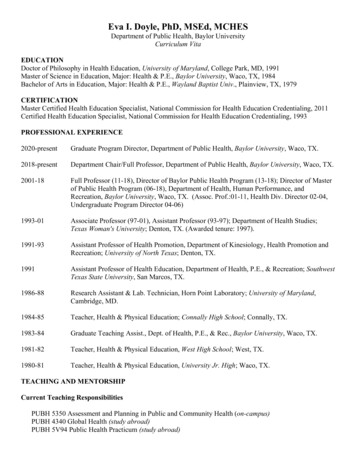
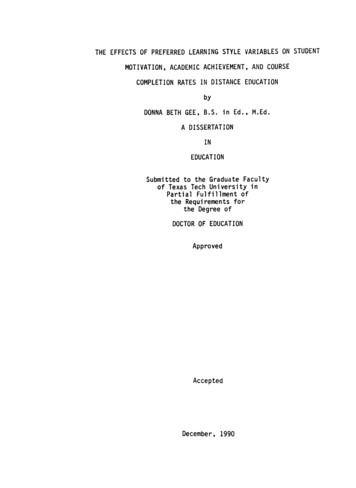
Distance Education as Percent of Total ing2018Fall2018Spring2019Students taking face-to-face coursesSemesterStudents taking DE & face-to-face coursesStudents taking DE courses onlyTWU Office of Teaching and Learning with TechnologySpring 2022527%42%40%Fall2021Spring202228%SpringFall2019 - 2020FA/FA1Fall2020Spring2021
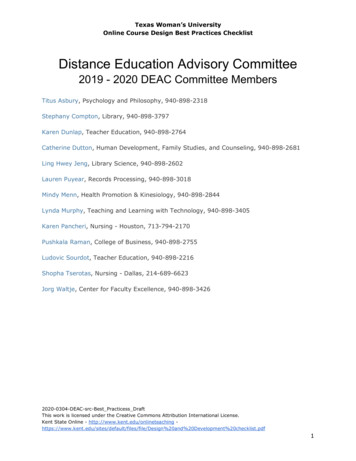
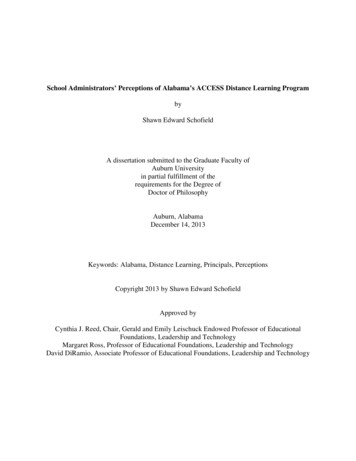
Distance Education Courses and Sections1800160014001200# DE Sections1000# Unique DE ng2016Fall2016Spring2017TWU Office of Teaching and Learning with TechnologySpring 2022Fall2017Spring2018Fall2018Spring Fall Spring2019 2019 - 2020FA/FA16Fall2020Spring2021Fall2021Spring2022
Number of UniqueDistance Education Courses at TWUSpring 2022627642Fall 2021869Spring 2021Fall 2020857Spring 2020470Fall 2019 - 468Spring 2019465Fall 2018472Spring 2018461Fall 2017451Spring 2017432Fall 2016427Spring 2016395Fall 2015382Spring 2015393Fall 20143710100200300TWU Office of Teaching and Learning with TechnologySpring 202240050076007008009001000
Distance Education Sections byTHECB Classifications18001600140012001132Fall 2014Spring 20151000Fall 2015Spring 2016Fall 2016800Spring 2017Fall 2017Spring 2018600Fall 2018Spring 2019400Fall 2019 - FA/FA1Spring 2020Fall 20202000Spring 202170Fall 2021Spring 2022HybridTWU Office of Teaching and Learning with TechnologySpring 2022Fully DE8
Distance Education Section SizeSpring 202230-39 students12%40-49 students15%20-29 students22%Less than 10 students26%10-19 students16%Office of Teaching and Learning with TechnologySpring 202250 students9%9
Distance Education Enrollmentby Instructional Method140001149312000100008000Fall 20156082Spring 2016Fall 201654116000Spring 2017Fall 2017Spring 2018Fall 20184000Spring 2019Fall/Fall 1 2019Spring 2020Fall 20202000Spring 2021Fall 2021Spring 20220DE/F2FTWU Office of Teaching and Learning with TechnologySpring 2022DE OnlyTotal10
Distance Education Enrollment by Gender140001200010548100008000Fall 2016Spring 2017Fall 2017Spring 20186000Fall 2018Spring 2019Fall/Fall 1 20194000Spring 2020Fall 2020Spring 2021Fall 20212000Spring 202294104MalesTWU Office of Teaching and Learning with TechnologySpring 2022FemalesNot Reported11
Student Enrollment by RegionDistance Education Only StudentsTWU Office of Teaching and Learning with TechnologySpring 202212
Student Enrollment by RegionDistance Education/Face-to-Face StudentsTWU Office of Teaching and Learning with TechnologySpring 202213
Location of Out-of-State StudentsTaking DE CoursesN onnecticutDistrict of kaNevadaNew HampshireNew JerseyNew MexicoNew YorkNorth CarolinaNorth DakotaOhioOklahomaOregonPennsylvaniaSouth CarolinaSouth sinWyoming05101520TWU Office of Teaching and Learning with Technology14Spring 2022253035404550
Student Enrollment by Age RangeDistance Education Only Students400035003000250021 & under22-30200031-4041-50150051 10005000Fall 2016Spring2017Fall 2017Spring2018Fall 2018TWU Office of Teaching and Learning with TechnologySpring 2022Spring2019Fall/Fall 1201915Spring2020Fall 2020Spring2021Fall 2021Spring2022
Student Enrollment by Age RangeDistance Education/Face-to-Face Students350030002500200021 & under22-3031-40150041-5051 10005000Fall 2016Spring2017Fall 2017Spring2018Fall 2018TWU Office of Teaching and Learning with TechnologySpring 2022Spring2019Fall/Fall 1201916Spring2020Fall 2020Spring2021Fall 2021Spring2022
Student Enrollment by Academic LevelDistance Education Only Students450040003335350030002747Fall 20162500Spring 2017Fall 20172000Spring 2018Fall 2018Spring 20191500Fall/Fall 1 2019Spring 2020Fall 20201000Spring 2021Fall 20215000Spring 2022GraduateTWU Office of Teaching and Learning with TechnologySpring 2022Undergraduate17
Student Enrollment by Academic LevelDistance Education/Face-to-Face Students500043244500400035003000Fall 2016Spring 20172500Fall 2017Spring 20182000Fall 2018Spring 2019Fall/Fall 1 201915001087Spring 2020Fall 20201000Spring 2021Fall 20215000Spring 2022GraduateTWU Office of Teaching and Learning with TechnologySpring 2022Undergraduate18
TWU FTE CompositionDE Only Grad FTEDE/F2F & F2F Grad FTEDE Only Undergrad FTEDE/F2F & F2F Undergrad 094120126001602Fall 201625851457Spring201726561575Fall 20172581247316931472Spring2018Fall 2018TWU Office of Teaching and Learning with TechnologySpring 202225051777Spring20191612Fall/Fall l 20203088Spring2021Fall 2021Spring2022
TWU Distance Education FTE Grad/Undergrad by YearStudents Taking Only DE CoursesDE Only Grad FTE11131602Fall 20169821457Spring 201711061575Fall 201797911791472Spring 20181693Fall 2018TWU Office of Teaching and Learning with TechnologySpring 2022DE Only Undergrad FTE109412011777Spring 20191612Fall/Fall 120192011613627369329763088Fall 2020Spring 20212555227726302352Fall 2021Spring 20221892Spring 2020
TWU Distance Education % FTE Grad/Undergrad Ratio by YearStudents Taking Only DE CoursesDE Grad FTE %41%59%Fall 201640%60%Spring 201741%59%Fall 201740%41%60%Spring 201859%Fall 2018TWU Office of Teaching and Learning with TechnologySpring 2022DE Undergrad FTE %38%43%62%Spring 201957%Fall/Fall 120192138%55%54%45%46%Fall 2020Spring 202149%49%51%51%Fall 2021Spring 202262%Spring 2020
Percentage of Distance Education FTE & SCH Generatedby Undergraduate Students by SemesterStudents Taking Only DE ll2017DE Undergrad FTE %41%Spring201740%DE Undergrad SCH %48%47%Fall 2016Spring2018Fall201841%Spring201840%48%47%Fall 2017TWU Office of Teaching and Learning with TechnologySpring 2022Spring2019Fall/Fall1 ll/Fall 1201943%Spring202038%48%45%50%45%Fall 201822Fall2021Spring202255%Spring202154%62%61%Fall 202049%Spring202249%56%56%Fall 2021
Percentage of Distance Education FTE & SCH Generatedby Graduate Students by SemesterStudents Taking Only DE ll2017Spring2018Fall2018Spring2019Fall/Fall1 2019Fall 2016 Spring 2017 Fall 2017 Spring 2018 Fall 2018 Spring 2019DE Grad FTE %59%60%59%60%59%62%DE Grad SCH %52%53%52%53%52%55%TWU Office of Teaching and Learning with TechnologySpring 22Fall/Fall 1Spring 2020 Fall 2020 Spring 2021 Fall 2021 Spring 2022201957%62%45%46%51%51%50%55%38%39%44%44%
TWU Semester Credit Hour Composition* As of 8317,54220,003Fall 2015Spring2016Fall 2016Spring2017Fall 2017Spring2018Fall 2018Spring2019Fall/Fall 12019Spring2020DE GradFace-to-Face GradTWU Office of Teaching and Learning with TechnologySpring 2022DE 2539,8858,44833,77434,740Fall 2020Spring2021Face-to-Face Undergrad15,62716,00428,54625,425Fall 2021Spring2022
Semester Credit Hour ng2017Fall2017Spring2018Fall2018Spring Fall/Fall Spring2019 1 2019 ce SCH 104,358 94,739 105,106 95,802 103,796 94,234 101,849 93,083 102,414 90,632 51,247 43,080 70,880 66,044DE SCH48,636 48,257 50,593 48,277 51,335 49,551 53,707 52,510 53,612 56,059 111,041 107,492 87,927 79,653*Preliminary data as of 2/3/2022TWU Office of Teaching and Learning with TechnologySpring 202225
Undergraduate Semester Credit Hour Spring2018Fall2018Spring2019Fall/Fall1 ,90073,15141,36234,63255,25350,040DE Undergrad rgrad*Preliminary data as of 2/3/2022TWU Office of Teaching and Learning with TechnologySpring 202226
Graduate Semester Credit Hour l1 Face-to-Face 2019,51417,4819,8858,44815,62716,004DE 8317,54220,00333,77434,74028,54625,425*Preliminary data as of 2/3/2022TWU Office of Teaching and Learning with TechnologySpring 202227
Fall 2015. Spring 2016. Fall 2016. Spring 2017. Fall 2017. Spring 2018. Fall 2018. Spring 2019. Fall 2019 - FA/FA 1. Spring 2020. Fall 2020. Spring 2021. Fall 2021. Spring 2022. Students Taking DE Classes