Transcription
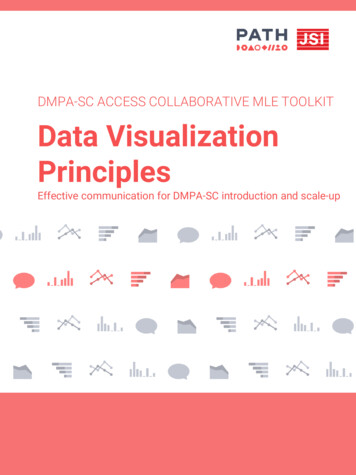
DMPA-SC ACCESS COLLABORATIVE MLE TOOLKITData VisualizationPrinciplesEffective communication for DMPA-SC introduction and scale-up
OVERVIEWThe importance of data from contraceptive self-injection and other self-care approachesData has the power to convey the lived experiences of women and adolescents, highlighting theimportance and potential of expanding choices to reduce unmet need for contraception.Contraceptive self-injection (SI) data is often missing in routine family planning measurement andevaluation. The Subcutaneous depot medroxyprogesterone acetate (DMPA-SC) AccessCollaborative has developed this resource to support family planning programs in tracking progresswith SI scale up, thereby advancing a broad contraceptive method mix and quality of care, andinfluencing policy development and procurement planning across public and private sectors.The purpose of this toolThis is part of a monitoring, learning, and evaluation (MLE) toolkit of three tools: the data use andindicators guide, data visualization principles, and Excel dashboard: how-to guide for dynamicdecision-making tools. The tools are primers in how to create dynamic and visually compelling selfinjection program data displays (e.g., dashboards, presentations) that facilitate comprehension anduse of SI data for family planning program decision-making. While this tool was developed withDMPA-SC self-injection in mind, many of these principles could be applied to data visualizationneeds across family planning programs and methods.Who should use this toolAll three tools are intended for use by individuals who will be presenting SI data to senior familyplanning program decision-makers. These individuals should have some experience with basic datamanipulation (e.g., HMIS focal people) and could be at the central, regional, or district level of thehealth system or an implementing partner.Where to find other tools in the toolkitPlease visit the DMPA-SC Resource Library at www.FPoptions.org to access the full MLE toolkit,Toolkit for DMPA-SC monitoring, learning, and evaluation.About the DMPA-SC Access CollaborativeThe PATH-JSI DMPA-SC Access Collaborative provides data-driven technical assistance,coordination, resources, and tools to ensure that have increased access to DMPA-SC self-injectionas part of an expanded range of contraceptive methods, delivered through informed choiceprogramming.The content in this document may be freely used for educational or noncommercial purposes,provided that the material is accompanied by an acknowledgement line.Developed in collaboration with the Data Visualization team,JSI’s Center for Health Information Monitoring and Evaluationwww.path.org/DMPA-SC www.FPoptions.org FPoptions@path.org
WHY VISUALIZE DATA?Family planning program managers, ministry officials, implementing partners, and other keystakeholders are often bombarded with information on a daily basis. With the sheer volume, textheavy, dense materials are ineffective vehicles for decision-makers. Instead, we must rethinkhow we present our information, which is where data visualization plays a key role. Datavisualization packages information into accessible messages that stakeholders are able tobetter process, retain, and use to make well-informed decisions.ACTIONKNOWLEDGEINFORMATIONDATAThe data-to-action process, as depicted in the pyramid, involvesanalysis and data visualization to transform data elements frombeing readable by computers to creating calls to action. Asdiscussed in the Excel guide, data inits rawest form is often easilyunderstood by computers. Tables andgraphs transform that data intoUnderstandable byhumansinformation, easily understood byhumans. Visualization principles,discussed in the following slides,Understandable byhighlight key pieces of thatcomputersinformation to create knowledge andspark action.In Family Planning programimplementation, there aremultiple stakeholder groups toconsider when transforming dataup the pyramid. To ensure theappropriate information is beingcommunicated and acted on,there are three key questions toconsider. Your informationdesign should be adapted toeach audience.Source: Rowley, Jennifer (2007). "The wisdom hierarchy: representations of the DIKW hierarchy". Journal of Information and CommunicationScience. 33 (2): 163–180.3
WHY VISUALIZE DATA?In order to move up the data-to-action pyramid, we must understand howwe process information. Research shows that visual information isprocessed more easily and stays with us longer than text.Pre-attentive processing is the subconscious accumulation ofinformation from the environment. Examples of pre-attentive attributesare listed below. These attributes help us to process and rememberinformation more quickly and easily.Pre-attentiveattributes arethe buildingblocks of datavisualization.Source: Van der Heijden, A. H. C. (1996). Perception for selection, selection for action, and action for perception. Visual Cognition, 3(4), 357-361.4
PLANNING FOR DATA VIZData visualizations are any graphic representations ofdata. Data visualization can communicate hugeamounts of data and help identify trends and areas ofinterest. Visualizing data is important during newservice delivery innovations to draw attention to areasfor improvement and key successes during programimplementation.Different stakeholders havedifferent data needs.Consider your stakeholders’literacy, visual literacy, andwhat data they need to makedecisions.TYPES OF VISUAL COMMUNICATIONThe matrix below plots types of visual communication on two axes: The horizontal axis depicts thekind of information you are communicating, ranging from concepts and ideas on the left to hard dataon the right. The vertical axis describes the interaction users have with the visual. Declarative visualstell a clear story, while exploratory communication allows users to interact with the data to reach theirown interpretations.Often during newservice deliveryinnovation & programimplementation, datavisualizations fall onthe right side of thismatrix in the datadriven space.Visualizations forreports (static),presentations, ordashboards (dynamic)are some of the mostcommon examples ofthese types of data.The left side of thematrix can be relevantduring the planningstages beforeimplementation.5
DESIGN BASICSA FEW DESIGN PRINCIPLESTypefacePick appropriate fonts for your audience. Stick to 2-3 atthe most and be consistent in usage.ContrastUse contrast (light/dark, big/small, thick/thin) tohighlight/emphasize.BalanceThe eye tends to seek balance and willnotice if your design is unbalanced.Use this principle to make your graphicvisually pleasing and to highlight/emphasize.HierarchyColorUse color to emphasize or reinforce value. Avoid the“Skittles effect” of using too many different colors anddrowning out the key piece of informationGive your audience visual cues of whatis the most important part of yourmessage.CONTRASTCOLORCarefully considercontrast and colorfor accessibility.Incorporatewhite spaceto give theeye a break.vs.HIERARCHY & FONTUse different sizes and types of font to better organize text. This helps users quickly discern theinformation presented and helps support retaining information.BEFOREFacts about PenguinsPenguins are aquatic, flightless birds that are highly adapted to life in thewater. Their distinct tuxedo-like appearance is called countershading, aform of camouflage that helps keep them safe in the water. Penguins dohave wing-bones, though they are flipper-like and extremely suited toswimming. Penguins are found almost exclusively in the southernhemisphere, where they catch their food underwater and raise theiryoung on land.Diet Staples: Krill, fish and squid. In general, penguins closer to theequator eat more fish and penguins closer to Antarctica eat more squidand krill.Population: The penguin species with the highest population is theMacaroni penguin with 11,654,000 pairs. The species with the lowestpopulation is the endangered Galapagos penguin with between 6,00015,000 individuals.Location: Penguins can be found on every continent in the SouthernHemisphere from the tropical Galapagos Islands (the Galapagos penguin)located near South America to Antarctica (the emperor penguin).AFTERFACTS ABOUT PENGUINSPenguins are aquatic, flightless birds that are highly adapted to life in the water.Their distinct tuxedo-like appearance is called countershading, a form of camouflagethat helps keep them safe in the water. Penguins do have wing-bones, though theyare flipper-like and extremely suited to swimming. Penguins are found almostexclusively in the southern hemisphere, where they catch their food underwater andraise their young on land.DIETKrill, fish and squid. In general, penguins closer to the equator eat more fish andpenguins closer to Antarctica eat more squid and krill.POPULATIONThe penguin species with the highest population is the Macaroni penguin with11,654,000 pairs. The species with the lowest population is the endangeredGalapagos penguin with between 6,000-15,000 individuals.LOCATIONPenguins can be found on every continent in the Southern Hemisphere from thetropical Galapagos Islands (the Galapagos penguin) located near South America toAntarctica (the emperor penguin).6
SELECTING THE RIGHTCHART TYPEWhen designing effective data visualizations it is important to understand your dataand select the appropriate chart to communicate your message. The first step is todefine your data types then use the decision tree on the next page to see whichvisual best fits your data types.QUANTITATIVE DATA TYPESNominal/CategoricalData that can be sortedaccording to group orcategoryTypes of familyplanning productsOrdinalData of selected categoriesordered along a numericalscaleDegrees of clientsatisfaction in careDiscreteNumerical data that has afinite number of possiblevalues/unitsContinuousNumerical data that ismeasured along a continuumNumber of unitsdispensedAverage monthlyconsumption7
SELECTING THE RIGHTCHART TYPEQUANTITATIVE CHART CHOOSERCOMPOSITIONShows the makeup of one or more variablesusually in absolute numbers and in normalizedformsRELATIONSHIPVisualization methods that show relationshipsand connections between the data or showcorrelations between two or more variablesDISTRIBUTIONVisualization methods that display frequency,how data spread out over an interval or isgrouped.COMPARISONVisualization methods that help show thedifferences or similarities between values.8
COMMUNICATING CLEARLYWITH CHARTSIn addition to selecting the right chart type, there are a few additional key steps to clearlycommunicate your message. These techniques help users interpret and more easily understand keymessages about the data and information that you are presenting.Remove default lines, borders, and tickmarks that distract your audience. Onlyessential chart components remain in the‘after’ chart.Be clear and succinct in telling the reader the keytakeaway with your titles. Consider using datalabels sparingly, reserving them for key data points.AFTERCREATE PURPOSEFUL TITLES & LABELSBEFOREDECLUTTER YOUR CHARTTitle tells the story &labels are fully visibleClean chart area allows youto concentrate on theimportant informationUSE COLOR TO ADD IMPACT & ACCESSIBILTYUsing color sparingly makes it more powerful and helps the important points stand out. Considerblack and white printing and accessibility when choosing colors.Highlights the category withthe value of interest.Will print clearly in black &white and visible to colorblindaudiences.9
BEST PRACTICESAvoid 3D charts. Use a “flat” designinstead. In 3D charts, it is difficult toBEFOREAFTERdiscern where the top of the data endsbecause the columns becomeobscured. When comparing charts, usethe same chart style.BEFOREAvoid using pie charts if possible, especially forAFTERUse the full axis starting at zero.Starting a graph at zero avoids anychance of your graph beingmisleading with its data andmisunderstood by your audience. Forexample, a bar graph beginning abovezero risks exaggerating thedifferences between the data beingcompared.comparisons. While the pie chart is one of the most popularchart types, visually, information is not easily digested.Viewers are only able to gauge the size of slices if they arefamiliar with percentages (25%, 50%, 75%, 100%) andpositions (common angles). We interpret other anglesinconsistently, making it difficult to compare relative sizesand therefore, less effective as a visual representation ofdata. Even with data labels, the user needs to work tounderstand the data relationships. If using pie charts, sortthe categories in descending order and use less than fivecategories.BEFOREAFTER10
PITFALLS TO AVOIDThe examples presented on this page need improvements and includepractices that should be avoided.Percent of providers performing thefour critical steps of SI initiationNUMBERS THAT MAKE SENSEParts of a whole should not add up to more than100% like the graphic on the right. It is also importantto use appropriate shapes to tell your story. Apictogram may be more appropriate.ACCURATE SCALESMake sure your graphs correlate with your data. The graphimages on the left are the same between sectors andmode of administration, yet the data range from 0% to N/Ato 92%. When comparing shapes, adjust sizeappropriately. For example, when comparing circles,increase the circle size by area instead of diameter.APPROPRIATE DESIGN FOR USERSDon’t make the user work byoverwhelming the visualization. Thetimeline figure on the right is overlycomplicated and not intuitive, as thedates do not follow a linear timeline.Plotting fewer points and in a differentshape would help make the timelinemore clear.Changing the axis placement or order togo against norms (e.g., axis going from100-0 instead of 0-100), misconstrueyour data and is not recommended.11
ADDITIONAL RESOURCESIf you want to Check out Be inspired by greatdata visualizationsInformation is Beautiful informationisbeautiful.netFlowing Data flowingdata.comImprove yourpresentation designWeb:AEA Potent Presentations Initiative p2i.eval.orgRad Presenters Podcast radpresenters.comLea Pica leapica.comBooks:Slideology Nancy DuarteResonate Nancy DuarteLearn from chartredesignsPolicyViz policyviz.com/remakesStorytelling with Data storytellingwithdata.com/galleryFigure out what charttype to useData Visualization aphic Continuum blog.visual.ly/graphic-continuumBuild a better chart inExcelDecluttered Excel Templates from Storytelling withDataExcel Tutorials from Ann EmeryBuild a better chartusing an online toolVisage visage.comPiktochart piktochart.comwww.path.org/DMPA-SC www.FPoptions.org FPoptions@path.org
injection program data displays (e.g., dashboards, presentations) that facilitate comprehension and use of SI data for family planning program decision-making. While this tool was developed with DMPA-SC self-injection in mind, many of these principles could be applied to data visualization needs across family planning programs and methods.