Transcription
LizardTraderRenko BarsUser Manual
2Table of Contents1. Introduction to Renko Bars32. The LizardRenko Bars93. Quick Start Guide124. Working with LizardRenko Bars165. Applying Indicators to the Lizard Renko Bars216. The Renko Tools257. Accessing the Renko Bars via NinjaScript308. Backtesting and Automated Trading32The manual refers to version 1.3 of the LT Renko Bars for NinjaTrader 8.
31. Introduction to Renko ChartsA renko chart is a type of chart of Japanese origin which is built usingonly price movement. Presumably, renko charts are named after theJapanese word for bricks, “renga” as the chart looks like a series of bricks.The original renko chart uses the same brick size for all chart bars.A new brick is added above or below the last brick, as soon as price hasmoved a specific amount called the bricksize. For an upward move thebar close for the next renko bar is found by adding the brick size to thehigh of the prior bar. For a downward move the next bar close is found bysubtracting the brick size from the low of the prior bar.Pursuant to this assembly, Renko bars are designed to emphasize trendsand filter out sideways markets. Renko charts look smoother and make iteasy to identify trends. Furthermore renko bars eliminate both time andvolatility.
4A trend continuation bar closes after price has moved in the direction ofthe prior trend by an amount equal to the brick size. Conversely,completion of a reversal bar requires a move of twice the brick size in theopposite direction. Although both trend continuation and reversal barsare represented by a single brick, a reversal bar effectively has twice thesize of a trend continuation bar.Unwanted properties of renko chartsRenko charts also have a few unwanted properties that need to be takeninto account:- renko charts fill gaps with fake bars that have zero volume- a renko bar close may plot at a price level at which the chartedinstrument never traded- renko charts do not show real highs and lows as a new brick is onlyadded when the price move has reached the required brick size- all reversal bars on a renko chart have fake open prices, as the currentopen is drawn near the open and not near the close of the prior bar
5- all indicators that use the bar opens, bar highs or bar lows as an inputseries should not be applied to renko bars- strategies running on renko bars cannot be backtested, as marketorders will use fake open prices to simulate fills- most renko bars have false time stamps or time stamps that do notmatch the closing price of the renko bar- renko bars cannot be used in multi-bar series scripts or with tickreplayIn conclusion, renko bars – although they emphasize trends andeliminate sideways price action – are difficult to handle.Principles for building price bars suited for system tradingOur main goal for introducing the new renko bar was to get rid of all theunwanted properties. At the same time we wanted to follow the standardprinciples for building simple and effective price bars from a set ofconsecutive transactions: The opening price is the price of the first transaction of the set. The high of the bar is the highest price of all transactions of the set. The low of the bar is the lowest price of all transactions of the set. The closing price is the price of the last transaction of the set. The time stamp of the bar is the time stamp of the last transaction of theset. The volume is the total added volume of all transactions of the set.When these six principles are followed- indicators may be applied to the chart bars- backtests will return meaningful results- the chart bars may be synchronized with other suited bar types inmulti-bar series scripts- the bars may be used with tick replayMost of the renko bars available for NinjaTrader do not follow theseprinciples, because they focus on the visual design of the renko barsrather than making them suitable for system trading. The result are fakebars with false prices or zero volume.One solution to this problem is to create renko bars that are built fromgenuine prices and then dress these bars with appropriate chart styles tomake them look as standard renko bars.
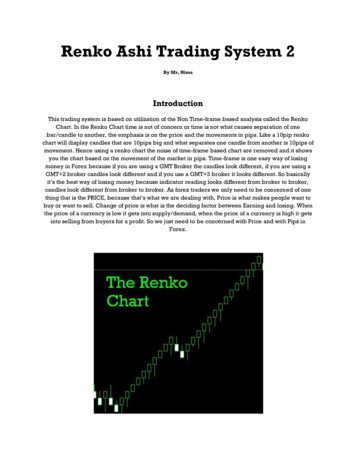
6Introducing chart stylesWhen building a renko bar based on the six principles, they do not lookas visually appealing as traditional renko bars. There are gaps and thereversal bars have larger bodies than trend continuation bars. Such arenko chart can be aweful to look at and is barely recognizable as a renkochart. Below is an example of a renko chart based on genuine data.Fixing the aweful looking chart introduces the topic of chart styles. Theycan be used to implement design features of renko bars without using fakeprices. Chart styles do not change the underlying data and have no impacton indicator calculations, backtests or other bar properties. Chart stylestypically recalculate bar open, bar high and bar low, but they do not touchthe bar close. When applying a chart style, the genuine open may bereplaced with an esthetically pleasing fake open and we may choose to keepor remove the wicks. As a result, the renko bars will again look astraditional renko bars, but eliminating most of the unwanted properties.
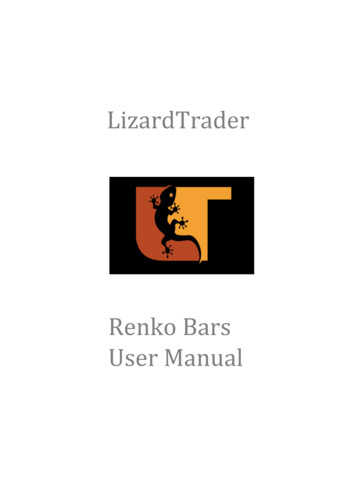
7This is the same chart as shown above, but with a chart style applied. Thechart style has the genuine open replaced with a fake open and the upperand lower wicks have been removed.Selecting the ratio between trend and reversal offsetClassic renko bars have a fixed ratio of 1:2 between the size of the trendoffset and the reversal offset. A trend continuation bar closes after pricehas moved in the direction of the prior trend by an amount equal to thebrick size. Conversely, completion of a reversal bar requires a move of twicethe brick size in the opposite direction. As the ratio for classical renko barsis always 1:2 only a single parameter – the bricksize – is needed to createthe renko bars.In the event that a different ratio than 1:2 is used for the renko bars, twoparameters are needed instead of one- number of ticks required to complete a new continuation bar (ticktrend)
8- number of ticks required to complete a new reversal bar (tickreversal)A renko bar labelled T2R5 sets the ratio between the size of continuationand reversal bars to 2:5. Because the ratio is higher than 1:2, the chart willhave a higher proportion of trending bars than the classic renko chart.Increasing the ratio to 1:3 or 1:4 will further increase the proportion oftrending vs. reversal bars displayed on the chart. The picture below showsthe structure of renko bars with a 1:3 ratio.Some renko bars even use a third parameter for selecting an open offset.However, such open offsets will produce fake opens and false backtests.Certain renko bars use the brick size as a parameter instead of a trend orreversal offset. Although this is feasible, it should be avoided because themechanics of renko bars are based on trend and reversal offsets.
92. The LizardRenko BarsThe LizardRenko bars were designed for systems trading. Accordingly, therules outlined above were adhered to when designing them: The opening price is the price of the first transaction of the set. The high of the bar is the highest price of all transactions of the set. The low of the bar is the lowest price of all transactions of the set. The closing price is the price of the last transaction of the set. The time stamp of the bar is the time stamp of the last transaction of theset. The volume is the total added volume of all transactions of the set.These rules partly contradict the traditional renko bars concept, but areneeded to make them suitable for system trading. In particular thefollowing properties were kept in mind:- Indicator values are only calculated from real prices as opposed tofake prices.- Gaps are not filled with zero volume fake bars.- The bars are fully backtestable.- The bars can be used in tick replay and synchronized in multi-barseries scripts.A Lizard Renko bar is closed as soon as the target level is reached. Newtarget levels are then based on the close of the prior bar. Therefore, theLizard Renko bars are not grid based and allow for gaps between two barswhen market liquidity is low.LizardRenko BarsThe Lizard Renko bars are built using two parameters, the tick trend andthe tick reversal, where- tick trend size of the tick move required to complete a newcontinuation bar- tick reversal size of the tick move required complete a new reversalbarThey do no have a third parameter to set a fake open, because the open isdependent on the selected chart style.
10D-Renko, T-Renko and Q-Renko BarsOther than the LizardRenko bars the package contains three fixed ratio bartypes. These are D-Renko, T-Renko and Q-Renko bars. The fixed ratio forthese bars is set to- D-Renko (D Double): ratio 1:2- T-Renko (T Triple): ratio 1:3- Q-Renko (Q Quadruple): ratio 1:4Of course, the fixed ratio bar types can also be built with the LizardRenkobars. For example a LizardRenko T3R6 is identical to a D-Renko T3. ALizardRenko T4R12 is identical to a T-Renko T4, whereas a LizardRenkoT2R8 is identical to a Q-Renko T2.The fixed ratio bar types were built for convenience purposes. Thepreconfigured bars can easily be added from the dropdown bar types menu,via the chart tool bar.Chart StylesThe LizardRenko bar, D-Renko bars, T-Renko bars and Q-Renko bars maybe used with the following chart styles:-Candlestick, Hollow candlestickOHLC, Open/CloseLizardBrickUniBrickWhen used with NinjaTrader in-built chart styles, the bars or candles willshow genuine prices, as displayed in the data box. This is different for thechart styles LizardBrick or UniBrick. Specifically, the chart open, high or lowof the bar will display as genuine renko bars. The adjustment used forapplying the chart styles to the renko bars does not affect the underlyingdata or bar properties in any way.The chart styles LizardBrick and UniBrick do not allow for setting the baropen via a specific offset. After consideration, we concluded it would notadd value other than simply modify the fake open.
11Chart Style LizardBrickThe chart style LizardBrick has three submodes:- Bricks (display of bricks as for classical renko bars)- Wicks (display of bricks and wicks with real highs and lows)- BarOpen (display of bricks, wicks and the bar open)The chart below shows D-Renko bars with the chart style “LizardBrick” insubmode “Wicks”.All bars show genuine high, low and close prices. The fake open is a designfeature of the chart style. The LizardBrick style replicates the logic ofclassical renko bars. For continuation bars, the current bar open is placed ator near the close of the prior bar. Conversely, for reversal bars the currentbar open is placed at or near the open of the prior bar. The underlying baropen, shown in the data box, is not affected by the embellishment.Switching the LizardBrick mode from “Wicks” to “BarOpen” will further adda little horizontal mark, displaying the genuine opening price.
12Chart Style UniBrickThe chart style UniBrick comes with similar submodes as the chart styleLizardBrick. Below is the identical chart, this time displayed with the chartstyle UniBrick in submode Wicks.The chart style UniBrick is designed in such a way that all bars display anidentical brick size. This is achieved by selecting an appropriate fake openprice. Again, the underlying bar open shown in the data box is not affectedby redesigning the bar.3. Quick Start GuideAfter downloading the install file for the LT Renko Bars, please open theNinjaTrader 8 Control Center and select Tools - Import - NinjaScriptAddon. Then select the install file and import. Once installed, please restartNinjaTrader so that the chart styles can load. The LizardRenko bars and thenew chart styles are then ready for use.
13In case that you update the LT Renko Bars to a new version, please firstuninstall the prior version of the LT Renko Bars via Tools - Remove NinjaScript Assembly. Please then import the new install file as explained above.Once installed, please restart NinjaTrader so that the updated chart stylescan load.Selecting the Bar TypePlease open a new chart with the DataSeries Type “LizardRenko”. There aretwo parameters that can be selected- tick trend number of ticks required to complete a new continuationbar- tick reversal number of ticks required complete a new reversal bar
14Typically a larger value is used for the tick reversal than for the tick trend.Selecting the Chart StyleThe default chart style for a new LizardRenko chart is the chart style“LizardBrick” with submode “Wicks”. If you change the chart style to adifferent submode, to “UniBrick” or to “Candlestick”, you may do so byaccessing the chart style button directly via the chart tool bar.When setting the chart style via the chart tool bar, the bars are not reloadedand indicator values are not recalculated.The chart style “Candlestick” will always display candles with the genuinebar open, bar high, bar low and bar close – as displayed in the data box ofthe chart. The two renko bar styles will display bars with a modified baropen. However, the modified bar open is only used for displaying thecandles, whereas indicators and backtests will always use the real prices.
15Adding the Renko Tools indicatorThe install file further comes with an indicator LT Renko Tools, accessiblefrom the LizardTrader folder of the indicator dialogue box.The Renko Tools can be used to display the two alternative target levels forthe next renko bar. The current renko bar will close, when one of the twotarget levels is reached. The indicator also comes with sounds alerts whichmay be triggered at the completion of the current renko bar.Furthermore the Renko Tools come with paint bars, which allow fordetecting market conditions when one or more levels of the order bookwere skipped. This information can be used to avoid entering positionswhen market liquidity has dropped.The screenshot below shows the target levels for a T-Renko chart.
164. Working with LizardRenko BarsThere are a few things that make working with LizardRenko bars easier.When you open a new chart, NinjaTrader will apply the default charttemplate. In the event you use a template for loading different bar types, itis most likely set to the “Candlestick” chart style.The chartstyles LizardBrick and UniBrick can be used with the LizardRenko,D-Renko, T-Renko and Q-Renko bars to obtain the specific design. However,you may also use them with all other bar types. They will then emulate the“Candlestick” chart style. Accordingly, you may use LizardBrick or UniBrickfor your default chart template.Configuring the Chart Tool BarYou may configure the dropdown menu for bar types to include D-Renko,T-Renko and Q-Renko bars. You may also preset the bar periods as needed.
17The LizardRenko bars cannot be preconfigured, because they contain twoseparate parameters. You need to select them directly via DataSeries or byusing the Ctrl-F7 shortcut. This is also one of the main reasons why weadded the D-Renko, T-Renko and Q-Renko bars to our Renko package.Selecting Chart StylesThe chart styles LizardBrick and UniBrick are easiest to access via thebutton in the chart tool bar. Through that menu, you may also select threesubmodes for each of the chart styles. Furthermore, all Lizard renko barstypes may be used with the CandleStick and OHLC chart styles. The chartwill then display bars with genuine prices.When switching chart styles or submodes, underlying prices or indicatorvalues will not be changed. Backtest results will always remain unaffectedby the selected chart style. In other words, chart styles only affect the visualdisplay of the renko bars or candles.The chart below displays the T-Renko UniBrick chart style and emulates aMean Renko / Median Renko chart.
18Median Renko and Mean Renko charts have a 1:3 fixed ratio with a reversaloffset 3 times larger than the trend offset. The same applies to T-RenkoTbars. When applying the UniBrick chart style to T-RenkoRenko bars, the fake openis located in the middle of the prior bar resulting in a backtestable Medianor Mean Renko bar.If you wish to emulate other types of renko bars, please get in touch with usand we will make a suggestion for how to adapt the trend / reversal offsetsand chart style to match your needs.Setting the RatioTraditional renko charts have a fixed 1:2 ratio. Accordingly, the price moverequired for completing a new continuation bar is half that of the requiredprice move for plotting a new reversal bar. By design,design renko charts willtherefore have more continuation bars than reversal bars. When the ratiois increased, the percentage of continuation bars will expand further, givingthe appearance of major trends while eliminating sideways markets.markets Thebelowelow LizardRenko T1R30 with a 1:30 ratioo illustrates this effect.effect
19The LizardRenko T1R30 draws a new continuation following a 1-tick move,whereas a new reversal bar requires a price move of 30 ticks against thecurrent trend. The chart is further embellished with the UniBrick chartstyle.Although these trends are visually appealing, they are not easy to trade.Trading the downtrend would result in a modest gain of 5 ticks. Taking aposition in the small uptrend that followed would incur a 17 tick loss. Ingeneral, high ratio renko charts should be avoided, unless used for a specificpurpose or trading style.Widening Bid-Ask SpreadsAlthough LizardRenko bars look like conventional renko bars during liquidmarket conditions, they will appear very different in thin liquidityscenarios. Let us first have a look at a widening bid ask spread example. Thechart below is a D-Renko with a fixed ratio of 1:2 and comparable to atraditional renko chart.
20The LizardRenko bars do not fill the spaces between the bid and ask withzero volume fake bars. All bars are built from real transactions and realprice action. This is very different from what you would see on a traditionalrenko chart. Below is a traditional renko chart with the same resolution,displaying the same instrument at the same time. Following the rules forbuilding classic renko bars, all gaps are filled with fake bars.Numerous fake bars were inserted to create this chart and show anidealized image of the market. However, the chart is useless for entering orexiting trades. Out of the 160 price bars, 132 bars are zero volume fake barsand were inserted to bridge the spread. Visually appealing renko charts thathide real price action are not helpful for trading. Only genuine prices will letyou know what is going on in the markets.LizardRenko bars display the genuine spreads and will not fill them withzero volume fake bars.
21Intraday GapsTraditional renko bars also fill intraday gaps with fake bars. These fake barsare then used to calculate fake indicator values or fake entry prices forbacktesting. The LizardRenko bars will leave the gap visible on the chart:5. Applying Indicators to the Lizard Renko BarsThe LizardRenko bars facilitate the application of indicators. All indicatorsare calculated from real trade data and therefore return accurate indicatorvalues.Indicator values do not depend on the selected chart style and submode.Whether you display the LizardRenko bars with the chart style CandleStick,OHLC, LizardBrick or UniBrick has no impact on indicator values. Highs andlows will be correctly fed into the indicator, regardless of whether the wicksare displayed or not.
22Support and Resistance IndicatorsIndicators used to determine support and resistance calculate correctlywhen applied to LizardRenko bars. The following LizardIndicators libraryindicators display accurate values when used with LizardRenko bars:-Daily high and lowFloor pivots and Globex pivotsRolling pivotsFibonacci retracements and projectionsCamarilla pivotsFibonacci pivotsRange projectionsThe above mentioned Library indicators will typically be off a few tickswhen used with conventional renko bars. This is because conventionalrenko bars feed false highs and lows into the indicators.The chart shown below is a LizardRenko T20R40 YM 12-19 chart on Oct 11,2019 applying Globex pivots. Yesterday’s high and pivot levels all displaycorrectly:
23This is the same indicator applying Globex pivots with in-built renko barson a 20 tick brick size:You may note that the first resistance level R1 is 18 ticks off, whereas thesecond resistance level R2 is 35 ticks off. This is because the in-built renkobars feed false high and low values into the indicator. Therefore you shouldnot rely on S/R indicators when using in-built renko bars.Indicators Using OHL DataAll indicators that use bar open, bar high or bar low (OHL) as input data donot return correct values when applied to conventional renko bars. Forexample a Stochastics indicator will exaggerate overbought and oversoldvalues when applied to in-built renko bars. At the same time the averagetrue range (ATR) will be underestimated. The zigzag indicator will showfalse highs and lows, because the real bar high and low is not accessible.
24The LizardRenko bars supply real OHL values and thus all indicator valuesare correctly calculated. Below is a sample chart for a zigzag indicatorapplied to LizardRenko bars:Although the wicks are not shown, swing highs and swing lows arecorrectly displayed.Filters and Moving AveragesRenko bars expand trends and compress sideways price action. This meansthat indicators take a larger fraction of input data from trending bars and asmaller fraction of input data from reversal bars representing range boundmarkets. As a result, linear filters and moving averages will adapt and showa similar behavior as the Kaufman Adaptive Moving Average (KAMA) orChande’s Variable Index Dynamic Average (VIDYA).
25The chart below compares a KAMA applied to a 10-minute chart with anEMA applied to a LizardRenko T5R10 chart.6. The Renko ToolsThe LizardRenko bars are supplied with an indicator LT Renko Toolswhich is installed along with the Renko bars and accessible from theLizardTrader folder of the indicator dialogue box.The Renko Tools can be used to show the projected high and low for thecurrent bar. It may furthermore be used to identify the current renko trendand to monitor market liquidity. The Renko Tools can also be accessedthrough other indicators or strategies.
26Projected High and LowThe Renko Tools indicator calculates the projected high and low for thecurrent renko bar. The projected high holds the price level that needs to bereached for an upclose, while the projected low holds the price levelrequired for a downclose.When the prior bar was an upclose, the projected high is calculated byadding the continuation offset (tick trend) to the prior close. The projectedlow is calculated by subtracting the reversal offset (tick reversal) from theprior close. Conversely, when the prior bar was a downclose, the projectedhigh is calculated by adding the reversal offset to the prior close. Theprojected low is calculated by subtracting the continuation offset from theprior close.This logic is slightly modified for the first bar of the session. Continuationand reversal offsets are then added or subtracted from the current open.The prior trend is not dependent on the prior bar being an upclose ordownclose, but obtained by comparing the open of the new session with theclose of the prior session.
27Projected highs and lows are always displayed for the last bar on the chart.When the indicator is set to Calculate.OnBarClose, projected highs and lowsare calculated from the last bar close. For the first bar of the session, theprojected high and low cannot be shown, because the calculation requiresthe current open, which is not available in Calculate.OnBarClose.However, when the indicator is set to Calculate.OnPriceChange, the currentbar open is available and projected high and low will also be shown on thechart for the first bar of the session. Therefore it is recommended to use theindicator with the setting Calculate.OnPriceChange (default setting).The projected high, projected low and the reference value (prior close orcurrent open for the first bar of the session) can be accessed throughindicators and strategies via the public properties- ProjectionHigh- ProjectionLow- PriorCloseThe property PriorClose holds the prior close for all bars with the exceptionof the first bar of the session, where it holds the current open. InCalculate.OnPriceChange the projected high, low and prior close for thecurrent bar can be accessed as ProjectionHigh[0], ProjectionLow[0] andPriorClose[0]. These properties should not be accessed inCalculate.OnBarClose, as it will not be possible to access the projections forthe first bar of the session.The indicator also comes with two sound alerts for an upclose or downclosewhich can be triggered once a new renko bar has completed.Renko TrendThe Renko Tools indicator can further be used to determine the currenttrend of the renko bars. Basically, the trend is up (renko trend 1) for anupclose and down (renko trend -1) for a downclose. It may also be neutral(renko trend 0) in the event that the last bar of the session is a doji barthat closes at the same value as the second but the last bar of the session.The Renko Trend can be accessed through indicators and strategies via apublic property “RenkoTrend”.
28Market LiquidityThe Renko Tools indicator also allows for detecting situations when thebid-ask spread increases or one or several levels of the order book areskipped. This indicates a thin order book, i.e. when the size of the incomingmarket orders significantly exceeds the size of the order book.The indicator detects a thin market- when there is a gap of more than 1 tick between the close of a renkobar and the opening price of the next renko bar- or when a renko bar closes above the projected high or below theprojected low (no transaction occurred at the projection levels)A thin order book may occur during the night session, when marketliquidity has dropped. However, a similar situation may occur during anews release, when the liquidity of the order book cannot absorb theincoming market orders.Below is a LizardRenko chart during a news release:
29The thin order book is shown via blue and yellow paint bars. The blue andyellow paint bars may be used to filter trade signals and refrain fromentering positions.Another application is to detect increased bid-ask spreads as shown in thechart below:This is indicative of an algorithm gone mad during the night session. Theindicator may be used to detect abnormal market conditions and invalidateall trade signals and avoid entering or exiting positions.For some instruments such as FOREX instruments that trade at 1/10th of apip, a single skipped level may not be significant. It may then beappropriate to increase the default value for the number of skipped levelsto a higher value, such as 3 or 4. As a result the indicator will then onlydetect market conditions, where transaction prices jump by 4 or 5 ticks in asingle step.
30Illiquid market situations may be displayed via paintbars. Additionally theindicator comes with a sound alert that will be triggered when it isactivated and when such a situation occurs.The Renko Tools indicator further comes with a public Series bool MarketLiquidity that can be accessed via an indicator or strategy. Theseries will return the value 1 (MarketLiquidity 1) when the market isliquid. It will return the value 0 (MarketLiquidity 0) when one or severallevels of the order book have been skipped.Short Reference Guide for Renko ToolsGroupParametersRenko ProjectionsShowprojectionlevelsShow priorcloseShow labelsThin Order BookShowchannelShow paintbarsSkipped ticklevelsAllowableValuesTrue, FalseTrue, FalseTrue, FalseTrue, FalseTrue, FalseInteger 0DescriptionActivates or deactivates theprojection high andprojection low plotsActivates or deactivates theplot for the prior closeActivates label for projectionplots and prior closeConnects projection highsand lows to display a channelActivates the paint bars fordetecting a thin order book.Allows for selecting thenumber of ticks that need tobe skipped without printingany transactions.7. Accessing the Renko Bars via NinjaScriptThe LizardRenko, D-Renko, T-Renko and Q-Renko bars are fullysynchronizable and can be called from a NinjaScript indicator or strategy asa secondary bar series.This can be done by adding the NinjaScript method AddDataSeries() inOnStateChange() as soon as State State.DataLoaded has been reached.
31The Renko bars are registered asLizardRenko: BarsPeriodType (BarsPeriodType)12490D-Renko: BarsPeriodType (BarsPeriodType)12492T-Renko: BarsPeriodType (BarsPeriodType)12493Q-Renko BarsPeriodType (BarsPeriodType)12494Example: Adding LizardRenko T5R10 bars to an indicator or strategyif(State State.Configure){AddDataSeries(new BarsPeriod(){BarsPeriodType (BarsPeriodType)12490, Value 5, Value2 10});}Example: Adding D-Renko T8 bars to an indicator or strategyif(State State.Configure){AddDataSeries(new BarsPeriod(){BarsPeriodType (BarsPeriodType)12492, Value 8});}Example: Adding T-Renko T6 bars to an indicator or strategyif(State State.Configure){AddDataSeries(new BarsPeriod(){BarsPeriodType (BarsPeriodType)12493, Value 6});}Example: Adding Q-Renko T4 bars to an indicator or strategyif(State State.Configure){AddDataSeries(new BarsPeriod(){BarsPeriodType (BarsPeriodType)12494, Value 4});}
328. Backtesting and Automated TradingThe LizardRenko, D-Renko, T-Renko and Q-Renko bars were specificallydesigned for systems trading and are fully backtestable. The barsthemselves are built from genuine trade data, making them as reliable for abacktest as tick bars or minute bars.The chart styles LizardBrick and UniBrick can be considered as differentkimono variations for the price bars, making them easier to read. Agai
Introduction to Renko Bars 3 2. The LizardRenko Bars 9 3. Quick Start Guide 12 . Renko Tools 25 7. Accessing the Renko Bars via NinjaScript 30 8. Backtesting and Automated Trading 32 The manual refers to version 1.3 of the LT_Renko_ Bars for NinjaTrader 8. 3 1. Introduction to Renko Charts . The LizardRenko bars were designed for systems .