Transcription
EVA AND THE CONTROLLABILITY-CONGRUENCETRADE-OFF: AN EMPIRICAL INVESTIGATIONFRANÇOIS LARMANDEJEAN-PIERRE PONSSARDCESIFO WORKING PAPER NO. 1257CATEGORY 4. LABOUR MARKETSAUGUST 2004An electronic version of the paper may be downloaded from the SSRN website:www.SSRN.com from the CESifo website:www.CESifo.de
CESifo Working Paper No. 1257EVA AND THE CONTROLLABILITY-CONGRUENCETRADE-OFF: AN EMPIRICAL INVESTIGATIONAbstractIncentives theory suggests that compensation schemes should be analyzed along twodimensions: controllability and congruence. Most schemes cannot satisfy both criteria at once.EVA bonus schemes, a major managerial innovation of the 90’s, favor the congruencecriterion. This paper questions ist properties along the controllability dimension. The questionis addressed through an in-depth case study: after three years in operation the actual bonusespaid by the system, as well as qualitative feedback from the managers involved, are analyzed.It is argued that EVA bonus schemes may have a major controllability problem.JEL Code: D8, J33, M52.Keywords: EVA managementcompensation standards.François LarmandeLaboratoire d’économétrieCNRS-Ecole Polytechnique1, rue Descartes75005 trade-off,Jean-Pierre PonssardLaboratoire d’économétrieCNRS-Ecole Polytechnique1, rue Descartes75005 ParisFranceponssard@polypolytechnique.frThis paper benefited from the comments of Patrick Alix, Gérard Charreaux, Nicolas Mottis,Bernard Sinclair Desgagné, Olivier Saulpic, Hervé Tanguy and of participants at seminars atEtape (Paris) and Insead (Fontainebleau) and at the Workshop on Accounting and Economics(Frankfurt).
1.IntroductionThis paper is concerned with the design of compensation systems at the profit centerlevel. The trade-off between congruence and controllability is an important issue. Incentivestheory suggests that optimal schemes should exhibit both a high level of congruencebetween the selected performance measure and the objectives of the firm and a high degreeof control of the manager on that performance measure. Ordinarily, the feasible set ofperformance measures is limited to either high congruence and low control or vice-versa(Baker, 2001).Traditional schemes favor controllability: they eliminate most of “out of control”impacts on the performance measure either through ex-ante or ex-post adjustments(Merchant, 1989). The use of budget as standards also facilitate the degree of control ofmanagers. Such schemes have been criticized for a number of reasons: the incentives are tooweak, the lack of congruence may generate perverse effects, managers are encouraged to liein the budget process which negatively affects its coordination objective (Jensen, 2001).In the early 90’s a radically new compensation scheme appeared in the managerialliterature: the EVA bonus scheme – a name given by the consultancy firm Stern Stewart tothe performance measurement indicator used (Stewart, 1991; Stern et al., 1995). Emphasisis on congruence. The standard is no longer related to budget but to an external target ofvalue creation related to the stock market. Bonus banks and various economic adjustmentsare introduced to encourage a long term perspective for the managers, rather than an annualone. EVA bonus schemes have been adopted by a significant number of companies all overthe world (Ross, 1998 and special issues of the Journal of Applied Corporate Finance; forrecent data on France and Germany see Hossfeld and Lee, 2003).An interesting question is whether or not the EVA bonus scheme significantly enlargesthe set of feasible performance measures. If it does, it should be considered as a majorinnovation: the traditional congruence-controllability trade-off would be by-passed. If itdoes not, the gains in congruence might be achieved through a loss in controllability whichis worth analyzing.This paper provides an answer to this question through an in-depth case study. Itreviews the operation of an EVA bonus scheme in a large international company over athree-year period following its introduction in 1999. The case study suggests that EVAbonus schemes may have a controllability issue. This result offers a theoretic background tointerpret previous findings: EVA bonus schemes are an essential tool to change themanagement culture of a company (Haspeslagh et al., 2001) but the approach is oftenconsidered as complex (Mottis and Ponssard, 2001-2002, Riceman et al., 2002) and quite afew managers reject it, some firms have even reduced or given up their use of such schemes(Ittner and Larcker, 1998).When congruence is explicitly introduced as an issue in traditional schemes, ways arefound to improve them. The introduction of a controllability issue may help to design betterEVA schemes. Some hints are discussed on how to improve the degree of control withoutreducing too much the degree of congruence.This paper is organized as follows. Section 1 recalls the main characteristics of EVAbonus schemes. In section 2, the prior literature is reviewed. The research question and themethodology are discussed in sections 3 and 4. Section 5 provides all the details of the casestudy. Section 6 concludes.3
2.EVA bonus schemesThis compensation system was first described in details in Stewart (1991) and thenslightly evolved over time. In 1999, the system had the following characteristics:2.1. A specific performance indicator : Var EVAThe performance indicator, called Var EVA (variation of economic value added fromone year to the next onei), is calculated as follows for year n:Var EVAn EVAn - EVAn-1where: EVAn Nopatn – r.CEn-1 (Nopat net operating profit after tax, r weightedaverage cost of capital, CE capital employed).2.2. An external standardBy construction, for any given year n, the discounted value of future EVAs is equal tothe total market value added of the firm (MVA is the total of market value plus debt valueminus capital employed). For year 0:MVA0 Σn EVAn /(1 r)nAn external standard can be built: variations of EVA in future years should beconsistent with current MVA. In the terminology of S&S, these variations of EVA arereferred to as EIs (expected improvement).To identify the EIs one could simply assume a stationary increment for a number ofyears, and then posit an infinite leveling off towards zero. The corresponding EI would bethe standard for the next three years and then the whole evaluation process would be startedagain.This method was in use in the early 90’S and it seemed to apply quite well to mediumsize companies operating in stable environments, such as Briggs&Stratton, a primer onEVA.Later on, S&S developed more elaborate econometric methods based on longitudinalanalyses at industry level. In this case they talk of "industry curve". For a given year k in thepast and for a given firm in the industry the respective EIk is determined. A regression istested between EIk and EVAk-1 over a period of several years and for a number of quotedfirms in the industry. In the future, each year n, the EIn will be determined from theobserved EVAn-1 using the regression line. This method seems more appropriate for firms incyclical environments.2.3. Decentralization in the firmUnlike a stock option system, which is also based on an external standard, the EVAsystem can be decentralized in the firm. This decentralization consists partly in breakingdown the performance indicator (EVA) and partly in breaking down the standard, i.e. the EI.We thus have an indicator and a standard down to a fairly decentralized level in thefirm, for example the profit center level, provided that the invested capital is actually brokendown at this level.4
This possibility of defining a performance indicator at a local level while retaining anoutside standard is a major theoretical advantage of the system. It can be used to mobilizemanagers around indicators for which they feel directly responsible.2.4. A bonus bankA bonus bank is fed each year either positively or negatively, depending on the observedgap between the variation of the EVA and the corresponding EI, and managers are paid afraction of the capital accumulated in the bank as long as it is positive other wise they getnothing.2.5.Economic adjustmentsA series of adjustments on certain accounting aggregates are made to limit short termeffects. S&S propose over 150 possible adjustments. The principle of these adjustments isalways the same. The idea is to transform flows into capital stock or vice-versa to improvethe economic interpretation of the performance measure.For example, given that certain major investments in the firm can have deferred returns,and in order not to discourage this type of investment, it is suggested to capitalize thenegative EVA of the first years (e.g. for three years) and to transfer the capital loaduniformly over time. Capitalization is made on the basis of the business plan. Over the nextthree years, only the gap between the observed EVA and the expected EVA in the businessplan will impact on the year's current performance.3.Prior researchReduced to a basic element of financial theory, EVA contributes nothing substantial andis simply the old concept of residual benefit in a new wrapping (Bromwich and Walker,1998, O'Hanlon and Peasnell, 1998). Debate does exist on empirical relations between EVAand stock prices, and the presumed advantage of this indicator compared to other internalfinancial indicators such as net earnings per share (Ohlson, 1995). For its protagonists, theadvantage of the indicator relates above all to its use in a system of incentives, wheremanagers' interests are aligned with those of shareholders (see also Zimmerman, 1997, andWallace, 1998, for academic authors who stress this essential feature of the EVA system).Despite the large diffusion of the EVA system in management spheres, little researchhas been carried out on use of the indicator in compensation schemes. Wallace (1997)analyses the impact of EVA implementation on firms' financial results. If, and only if, EVAis used in compensation stock prices increase and capital employed is reduced. But EVAimplementation is not an independent change. Qualitative studies emphasize that adoptionsmay vary widely (the internal standard may be kept, the cascading down may remainlimited, bonus banks are rarely used except for top managers), it is often adopted inconjunction with a change in strategy and in CEO (Mottis and Ponssard, 2001), then theinvolvement of top management is required to truly generate a cultural change (Haspeslaghet al., 2001). A direct analysis which associates financial performance and EVAimplementation is difficult to interpret.Lovata and Costigan (2002) show that the EVA adoption rate is higher in firms withhigh agency problems (high institutional ownership and low insider ownership). They alsoshow that the rate of adoption is lower in firms with a high R&D ratio, which they relate tothe difficulty to construct economic meaningful adjustments.5
Riceman et al., (2002) evaluated the comparative efficiency of managers in relation tothe incentive schemes set up within a firm that had selectively adopted EVA. This study isbased on questionnaires in which managers are asked to evaluate the relationship betweenthe compensatory scheme that applied to them (EVA or not) and their own performance.Findings showed that, in terms of efficiency, the level of congruence is more important thanthe performance measure as such. In this study, congruence is defined as the alignment ofobjectives within the organization between superiors and subordinates. The choice of asingle indicator along hierarchical lines facilitates this congruence, but indicators othersthan EVA may do as well in this respect. The study also showed that a significant number ofmanagers failed to understand the EVA system. Managers far from the core business of thefirm or in charge of functional activities (such as HR) seemed particularly unhappy with thesystem.A number of firms have reduced or given up EVA because of its complexity. Ittner andLarker (1998) mention the case of ATT. This firm introduced EVA in 1992, later onintroduced customer and employee satisfactions as additional performance measures. Thefirm encountered problems to properly handle acquisitions, spin-offs, sales of units,restructuring. In 1997, bonus were high but the stock price had fallen, the CEO waschanged, the EVA system was dropped to return to the more traditional EPS system.This article completes this discussion of EVA bonus schemes by adding the controldimension. It will be showed that this greatly increases the understanding of theseobservations.4.The research questionBaker (1992, 2001) combines the simple economics of moral hazard with feasibilityconstraints on performance measures to obtain the congruence controllability trade-off.Define:- the degree of congruence as the level of coherence between the objective of thefirm and the performance measures serving as a basis for calculating the variablebonus;- the degree of control as the level of managers' control over those samemeasures.Principal agent models emphasize the control dimension in conjunction with theprinciple of informativity (Holmstrom, 1979): additional information which reduces thenoise of the performance measure should be introduced. The congruence dimension may beassociated to the multiple task literature (Holmstrom and Milgrom, 1991): suppose both costand quality are important to the firm, both should be aggregated in the performance measurefor better congruence. Control and congruence interact to set the intensity of the incentivescheme: suppose the quality indicator is very noisy compared to the cost indicator,incentives should be weakened otherwise the manager would allocate all of his or her effortto cost reduction.Consequently, theoretic efficient contracts exhibit a high degree of both congruence andcontrol, with calibration being fine-tuned accordingly. As emphasized by Baker, it howeveris an empirical observation that feasible performance measures with much congruence havelittle control and vice-versa. The congruence controllability trade-off points out this issue.The implementation of the proper balance between the two dimensions (and the actualcalibration of the scheme) is a tricky one and may lead to perverse effects (for a primer ofthe subject see Kerr, 1975, see also Jensen, 1991).6
The question addressed in this paper is the following: does the EVA bonus schemesignificantly enlarges the set of feasible performance measures ? If it does it should beconsidered as a major innovation, the trade-off associated with traditional performancemeasures would be by-passed. If it does not, the gains in congruence might be achievedthrough a loss in controllability which should be analyzed.5.MethodologyThis case study consisted of two phases. One of the author was initially requested by thefirm, in 1998, to accompany the implementation of the system. In 2002 the two authorswere asked to participate in its evaluation, and to suggest improvements. We thus hadaccess to internal reports and were able to carry out additional interviews, primarily with anumber of divisional financial managers and human resource managers. In their respectivedivisions, these executives had to transmit knowledge about the system to the managersdirectly concerned, to administer the system after its implementation, to review it after threeyears, and to centralize any requests for changes. Our mission was steered directly by thecorporate chief executive in charge of the EVA implementation for the entire company. This“research-action” position enabled us to familiarize ourselves with the implementation ofthe system. The information reported in this paper has been reviewed for accuracy byseveral company managers and cleared for outside publication by the corporate chiefexecutive. We are solely responsible for our interpretations.Such a methodology allows to identify the details of the incentive mechanismsimplemented, the motives behind trade-offs made, the quantitative bonus actually paid overthe period and the qualitative assessments of the managers involved. It also has drawbacks,the very detailed knowledge of this EVA system can lead to conclusions that cannotnecessarily be generalized. It will therefore be important to adjust these particularconclusions in light of more general observations obtained by means of different approachessuch as the ones described above.6.Case study: the company XYZ6.1. The contextThis international firm operates in over 75 countries. In 2001 it had a 14 billion dollarturnover and 80,000 employees. It is structured into four divisions, largely independentfrom an industrial and commercial point of view. A division consists of profit centers, fromaround ten to around forty depending on its size, a profit center corresponds to theintersection between a product line and a country.The different divisions of XYZ are characterized by high capital intensity, due to highcosts of new plants and of maintenance on industrial equipment. Because of the nature ofthe business, the EBIT is strongly affected by the specific economic situation of eachcountry.During the 1990s several initiatives were taken to introduce the concept of "valuecreation". Reports on investment choices had to show value created more explicitly.Analyses of net discounted value had to be quantified in relation to different levers.Acquisitions had to explain the corresponding synergies and economies. But most of thesecases involved only a handful of senior executives in each division, and most of the capitalexpenditures were still determined by organizational routines. At operational level attentionremained focused on the EBIT.7
Another way had to be found to mobilize all members of the executive committees of allprofit centers, i.e. about 1,000 to 1,200 managers, around the notion of value creation. Thismobilization probably had to be based on a specific indicator and on the revision of thereward system.The EVA approach matched these objectives and the decision to adopt it was taken in1998. In 2000 a new compensation system had been established and gradually appliedthroughout the firm. The system was to be revised during the third year before beingrenewed.6.2.The variable compensation system before 2000Before the year 2000 several variable compensation schemes existed in the XYZ Group.Most of them could be characterized as follows:- the performance indicator on which the bonus was calculated was the EBITDA or theEBIT, or exceptionally the ROCE ;- the standardii was determined, profit center by profit center, on the basis of the currentyear's budget;- this determination of the standard consisted in a negotiation between the head of theprofit center and her/his immediate superior (area manager), that took into account theprevious year's result;- theoretically the bonus varied on a scale of 0 to 200, depending on the observed result,but in reality it was usually established between 130 and 170.6.3.The variable bonus system introduced in 2000The EVA bonus scheme implemented by the firm XYZ included the strategicinvestment adjustment, a constant EI over the next three years, a yearly bonus and a threeyear bonus instead of a bonus bank, moreover caps and floors were introduced in bothbonuses.The company also introduced another type of adjustment concerning the capitalinvested. It decided not to apply the accounting values of assets directly to the calculation ofthe EVA, but to apply an economic adjustment in order to bring them closer to the marketvalue. Absolute EVA would be more meaningful for economic analysis. This type ofadjustment has no impact on Var EVA. No adjustment was provided for in the event oflocal devaluation.The size of the variable annual bonus (roughly between 12% and 30% of the basicsalary, depending on the level of responsibility) was harmonized throughout the group. Halfof this annual bonus was to depend automatically on the EVA. The other half wasdetermined in relation to quantified personal objectives. This break-down, valid at all levelsof the hierarchy, reflected the general management's wish to avoid excessive focus on theannual EVA at the expense of long-term goals. The three-year bonus depended solely on theEVA. Moreover, for the sake of solidarity, two-thirds of the bonus was calculated on theresults of the profit center and one-third on the results of the entity to which it was affiliated.The process that was applied to set the EIs was roughly as follows:- the EI level for the entire group was determined from the industry curve asrecommended by S&S ;- this EI level for the group was then first broken down on each division, then withineach division on each profit center, so that the sum of EIs for all the profit centersremained at all times equal to the group's EI. In this cascading down process twoconsiderations were used. First, the estimated industry curve was applied mechanically8
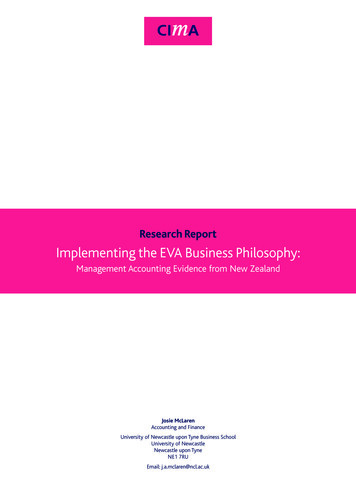
at each disaggregated level. Second, these initial EI proposals were submitted to localmanagers and compared to the results forecast by the profit center in its strategic fiveyear plan. Since most of these EIs were lower than the internal forecast, they wereseldom challenged.The intervals that set the caps and floors for maximal and zero bonus respectively weretaken as symmetric around the EI. These intervals were considered to be the responsibilityof the divisions, they were determined by taking into account the profit centers' projectedresults and their subjective appreciation of volatility.The EI and the Interval (noted as Int) peculiar to each profit center were expected toremain constant for each of the three years 2000, 2001 and 2002, contrary to S&Srecommendation of an annual adjustment of EI through the industry curve formula.Then the adopted annual bonus formula is linear from EI-Int to EI Int, while the threeyear bonus is linear from 3EI to 3EI 3Int, making it more challenging that the annual one.This approach was preferred to a bonus bank approach to allow managers to obtain apositive yearly bonus whatever their past results would be.From the point of view of the top management, this system reflected a balance betweenactive promotion of value creation in terms of results – "Creating value, rewarding results"–, and more traditional remuneration in relation to efforts. This system was supposed toapply uniformly throughout the firm.6.4.Quantitative results.In order to perform comparison between units, their performances have beennormalized. LetROCEn r EVAn /CEn-1ROCEtargetn r (EVAn-1 EIn )/CEn-1Define the normalized unit’s performance indicator as follows :(Var EVA – EI) / CE EVAn /CEn-1 – (EVAn-1 EIn )/CEn-1 ROCEn – ROCEtargetnThus, the normalized unit’s performance (from now on unit’s performance) measuresthe difference between the observed ROCE and a target ROCE that integrates the EIrequirement. Volatility of EVA is defined as the volatility of this units’ performanceindicator.Graph 1 gives the standard deviation of this indicator as observed ex post given theactual outcomes of years 2000, 2001 and 2002.9
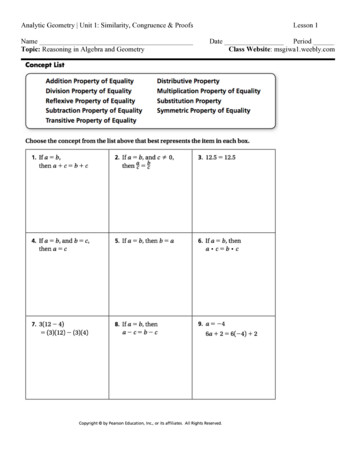
G raph 1: standard deviation (varEVA - EI)/C % to 2%2% to 4%4% to 6%m ore than 6%It is seen that more than 50% of units exhibit a standard variation higher than 2% (andclose to 20% higher than 4%) which is quite high. With a traditional bonus scheme, supposethat the target ROCE is 10%, to be almost sure to achieve a bonus one would take as aninterval twice the standard deviation that is a cap at 14% and a floor at 6% ! But thevolatility in a traditional bonus scheme is much lower because of the internal standard andadjustments for control.The fact that volatility is high suggests that the slope of the bonus scheme should be lowthat is, intervals should be large. Graph 2 shows that such is not the case.G raph 2: R elationship between volatility and size of the interval1 2,0 %1 0,0 %Int/CE8,0 %6,0 %4,0 %2,0 %0,0 %0,0 %2 ,0%4,0 %6,0 %8 ,0%1 0,0 %12,0%sts de via tion (V arE V A-E I)/CEThere is no correlation between the standard deviation of the unit’s performance and theunit’s interval as a percentage of capital employed. One should have a slope of 1 betweenthese two indicators to have 2/3 of chances to be in the linear portion of the bonus formula.The main reason for such low intervals seems to be the natural optimistic tendency ofmanagers: once they know what their EI is, EI Int appears as stretch goal triggering themaximal bonus. A small interval means a high probability of obtaining that bonus. Thedecentralized process used by the company to assess the intervals reinforced that tendency.The obvious consequence of small intervals is that many units will get either zero ormaximal bonuses. Graph 3 confirms this view. It shows a rather uniform distribution among10
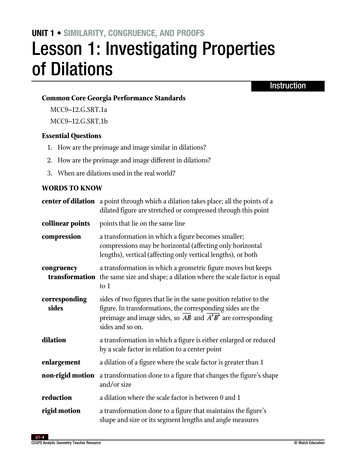
zero bonus, linear bonus and maximal bonus. Consequently, 2/3 of units lied on zones inwhich the incentive scheme was not operating. Though many units could not know it inadvance, they could certainly infer it along the year and eventually adapt their behavioraccordingly.Graph 3 : Yearly bonus45%40%35%30%25%20002001200220%15%10%5%0%zero bonuslinear bonus rangemaximal bonusGraph 3 gives the wrong feeling that the EIs are well set. This is misleading, quite a fewunits actually obtained three times there maximal bonus. There, the question is not so muchthe high volatility of the measure but the inadequacy of the standard.Graph 4 details the maximal bonus by Divisions. It can be observed that in one division,which happens to be the core business of the company, almost 40% units obtained theirmaximal three-year bonus, of which 50% obtained their maximal bonus every year. Thesepercentages are much lower on the other three divisions. It is worth noting that the biaseswould have been even more pronounced if the industry curve had been used. Cycles in thisbusiness seem go over several years.11
Graph 4 : Maximal bonus by Division45%40%35%30%25%Maximal 3-year bonusMaximal every year20%15%10%5%0%A6.5.BCDManagers’ qualitative assessments of the EVA bonus schemeA number of comments made by managers during internal audits and interviewsprovided further information, in addition to the statistics presented above. We noted that:- the EVA indicator as such was perceived positively, as easy to understand and usefulfor decision analysis; the objective of diffusing the concept of value creation based onan operational indicator was largely achieved;- profit center managers got into the habit of analyzing their balance sheet and no longeronly their income statement, and managed their assets more efficiently, at least the partover which they had real decision-making powers. In fact this enhanced analyticalcapability applied mainly to strategic reviews and budgets. For monthly control, on theother hand, EVA calculations required precise accounting data that were available toolate, so that control continued to be based on EBIT.Interviews also highlighted several difficulties regarding the bonus scheme associatedwith EVA:- Precise figures for a year's EVA were not available until March of the following year.It was therefore difficult to use the EI as a precise incentive until the accounts had beenfinalized, especially since the profit centers always found it difficult to clearlyunderstand the details of rules determined at Group level for calculating the capitalemployed;- Unlike the former system, the high level of volatility of bonuses granted was imputedprimarily to external economic conditions (simple variance analysis made on a sampleof units confirmed this view). The system thus seemed to reward results more thanmanagers' efforts, so that in certain extreme cases managers felt that it was simply aquestion of the luck of the draw. This observation covered two points: doubts as to therelevance of standards defined externally, and criticism of the intervals used, whichexperience suggested were far too short;12
- From the second and third year of application of the system, several units complainedthat even before the beginning of the year, all hope of a bonus seemed inaccessible whenthey compared their budget with the "standard" fixed one or two years earlier. In theiropinion the bonus system had lost much of its relevance due to the change of context.They considered that certain profit centers were simply "carried" by their environment,something that seemed unfair and caused them to question the rationale of the systemiii.To remedy this situation, management made a few ad hoc changes to the EIs andintervals and, in extreme cases it was even decided to "neutralize" the bonus system ofcertain profit centersiv;- In some instances managers would be reluctant to accept internal mobility proposals inthe perspective of losing high predictable bonus;- Many managers wanted to revert to an internal standard system in which the EI wouldbe set with reference to the budget, but the top management was against this.7.Discussion and concluding commentsThis case study provides ample evidence that the EVA bonus scheme implemented incompany XYZ suffers from a severe control problem and that this problem generate acongruence problem as well.Do these problems arise due to the specificity of the system implemented or because ofthe EVA schemes in general ? Three points are worth discussion:- it does not seem reasonable to have a constant EI in a cyclical business; still thecompany adopted one for the sake of simplicity but also because the notion of industrycurve as suggested by Stern and Stewart is difficult to grasp for the middle manager, andhardly applies to unlisted entities situated in geographic environments in which thenotion of peers is not easy to apply. It was therefore more an act of authority that was atthe origin of the initial EIs, and it was inconceivable for the
the economic interpretation of the performance measure. For example, given that certain major investments in the firm can have deferred returns, and in order not to discourage this type of investment, it is suggested to capitalize the negative EVA of the first years (e.g. for three years) and to transfer the capital load uniformly over time.