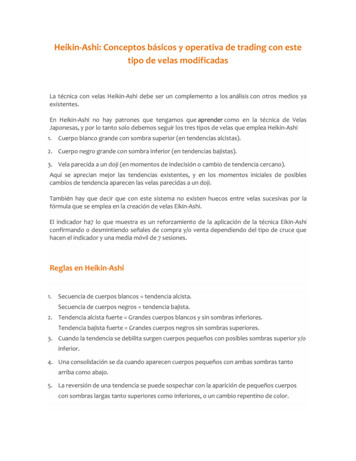
Transcription
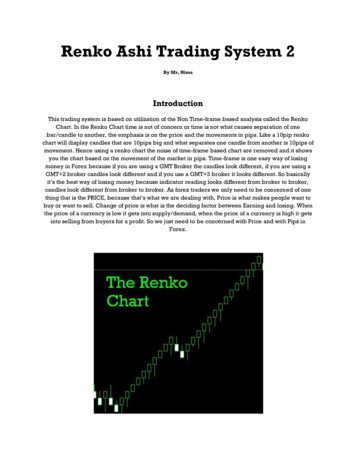
Renko Ashi Trading System 2By Mr, NimsIntroductionThis trading system is based on utilization of the Non Time-frame based analysis called the RenkoChart. In the Renko Chart time is not of concern or time is not what causes separation of onebar/candle to another, the emphasis is on the price and the movements in pips. Like a 10pip renkochart will display candles that are 10pips big and what separates one candle from another is 10pips ofmovement. Hence using a renko chart the noise of time-frame based chart are removed and it showsyou the chart based on the movement of the market in pips. Time-frame is one easy way of losingmoney in Forex because if you are using a GMT Broker the candles look different, if you are using aGMT 2 broker candles look different and if you use a GMT 3 broker it looks different. So basicallyit’s the best way of losing money because indicator reading looks different from broker to broker,candles look different from broker to broker. As forex traders we only need to be concerned of onething that is the PRICE, because that’s what we are dealing with, Price is what makes people want tobuy or want to sell. Change of price is what is the deciding factor between Earning and losing. Whenthe price of a currency is low it gets into supply/demand, when the price of a currency is high it getsinto selling from buyers for a profit. So we just need to be concerned with Price and with Pips inForex.
InstallationStep 1 – Check the images below.Go to Tools OptionsClick the Charts Tab and check all the boxes, Input 9999999999999 in both the fields.
Click the Expert Advisors Tab and make sure 4 check marks like in the image below.Click OK, That’s should be about it with the settings.Step 2 – Close the metatrader and copy all the contents of the Indicators.zip to experts/indicatorsfolder in your metatrader installation folder. Copy the contents of Renko.zip to the experts folder inyour metatrader installation folder. Copy the contents of templates.zip to the templates folder in yourmetatrader installation folder. Start Metatrader now.Step 3 - Open a 1 minute chart for example like EURUSD and manually Scroll back the 1minuteEURUSD chart as much as you can (You can simply keep pressing the HOME button on yourkeyboard), I recommend at least 1 or 2 months worth of 1minute chart data on your screen.Step 4 – Apply the RenkoLiveChart v3.2 EA to the 1minute EURUSD chart, Make sure the settings areas the images below.
Click OK and Enable the Expert Advisors Button.Now the Renko EA should be running and data from the 1minute chart should be able to feed data foryour Renko Chart.
Step 5 – Open the Renko Chart, Check the images.Click on File Open OfflineSearch for EURUSD M2 from the list and click on Open.
Now you have the renko chart running in a M2 Offline chart. Remember that you need to have the1minute chart as well as the EA running at all times , because data from the 1minute EURUSD chart isfeeding data to the EURUSD M2 Offline chart via the Renkolivechart 3.2 EA.That’s about it about how to start a renko chart in metatrader. You need to do the same steps for anyother pair you wish to run a renko chart for.
Final Step – Applying the Template. Check the Images belowRight click on the M2 Offline Renko Chart, in the menu select templates and load the renko ashi 2template.
The Indicators and what they meanTick Value – It will display the value of 1pip (minilot) and the spread.IINwmarrows – Shows when to sell and when to buy. You can check it at mql codebase catalog.http://codebase.mql4.com/3311SMC4Scalper Candles v3.1 – We will use this indicator instead of heiken ashi , provides moredetails other than buy/sell colors, like if the price is moving above the open of the candle it willdisplay a Aqua box and if the price is moving below the open of the candle it will display a Gold box.
Two Moving Average Channel – We will be using 2 Smoothed Moving averages, one basedon the High prices and one based on the Low prices to create a channel. This concept has been takenfrom the Synergy system; it helps identify Range bound/Trending and breakout Scenarios. It is also tobe used to place our stop loss which would be on the other side of the channel.Range BoundBreakout and Trend
MA In Color wAppliedPrice – We will use a Linear Weighted MA in Color of 10 periods tosee the next probable direction for a 100pips of movement.Blue Means BuyRed Means Sell
MACD with Alert – We will be using a MACD (Moving Average Convergence Divergence)Indicator to see the crossover of 10 EMA vs 20 EMA and Convergence/divergence between them, Wewill be using a 5 periods Signal SMA on the MACD.So what you’re basically seeing is a 100 pip average vs. a 200 pip average with a 50 pip signal line onthe MACD in the Renko Chart. This indicator will generate a sound and popup box alert.BuyingSelling
Wick-O-Gram – This indicator will basically show you the wicks generated by the renko candlesin a histogram window. Green bars means that the price went up before going down and red barsmeans the price went down before going up. You can also see how many pips the size of the wick byplacing the mouse cursor over the bar, It should show you the or – pips so you have the details.Histograms showing how many pips price went against the trend before heading back into theintended direction.Remember that in the Renko System if the price goes against 2 times the size ofthe renko candle, it is a reversal of the trend. In the Renko Ashi 2 System Itwould be 20 pips.
RenkoAM v2.0 – This is the most important indicator of the Renko Ashi 2 system. You have toknow that there is a flaw in the renko chart and that is the absence of Time, you can really never knowhow much time it took for one candle to another looking at a renko chart, further more you can reallynever tell if there was a sudden big movement and the renko chart shows you a trend, but in actualityit was not a tradable scenario because the movement was too fast to be able to trade, like for examplea big sudden movement due to news, spikes or volatility.For this reason we will need to pay attention to this indicator, It displays the time taken for the renkobars in a histogram, Now it’s not much of a concern if it took more time for the renko candle to close,But it is of Major concern if it takes too little time or due to the sudden big movements, So we use thisindicator to detect untradeable scenarios.The green bars on the histogram grows every minute more the Renko candle takes and the maximuma green bar can grow is 30 minutes (you can change the settings for more). I have put a horizontalred line on 5minutes, so if the green bars and renko candles closes below the red line, it is probablyan untradeable scenario and not actually a tradable setup.Check the images below for some illustration.
Miscellaneous IndicatorsNew Candle Alarm – This will send a sound and popup box alarm each time a renko candlecloses.MM Price THV – This will show the price of the currency, Green means going uptick and redmeans going downtick. I have modified this indicator so it shows you 4-digits even on a 5-digit brokerwhich is convenient to see.Candle TIME THV – This indicator will show you the time left for the candle, This indicator willbasically go into negative time on the renko chart, you just need to disregard the – sign and add2minutes to the number your seeing, That would basically be the amount of time the renko candle iscurrently taking.SweetSpots – This is a custom Price based Grid that shows you level of price, like 100 levels and50levels. 100 levels are in Blue horizontal lines and 50levels are in olive horizontal lines, 100 levelsmeans for example EURUSD at 1.5000 and 50 levels means for example EURUSD at 1.4950 (Pleasenote that I am using a 5-digit broker, so if you’re using a 4-digit broker you would need to change thevalues in the indicator to match)Optional StuffProbability Meter – This indicator will show you the strength and weakness between eachcurrency and also show you which way 21 indicators across all time-frames are pointed and thecombination of all this to generate a probability Percentage which is quite helpful to decide whichway to trade, But please do not follow this indicator blindly its just to be used for additionalInformation.Renko Script– This works the same way as the RenkoLiveChart v3.2 EA to generate a renko chartand feed data from the 1minute chart, except that you can use it to plot renko charts even onweekends when the market is not moving, because the Renko EA will only function when the marketstarts to move, The script can also be used for back testing purposes like back testing a Renko EA orback testing a renko manual strategy on the trading simulator.Trading Simulator – This Is a trading simulator that simulates the market so you can test yourmanual trading strategy on metatrader.The Optional Stuff are copywriter material and hence I will not be able to shareit openly on the forum or on the web, If you need these Optional Stuff pleasesend me an e-mail from the forex-tsd forum and I will be able to send it to you.
RULESBuy Rules1.2.3.4.5.Make sure the candles are green in colorMake sure the MA in applied price is blueMake sure the candles are broken out of the 2 Moving Averages channelMake sure the MACD is flipped Up and Signal is GreenEnter a Buy and place the stoploss on the other side of the 2 moving averages channel.
Sell Rules1.2.3.4.5.Make sure the candles are red in colorMake sure the MA in applied price is redMake sure the candles are broken out of the 2 Moving Averages channelMake sure the MACD is flipped Down and Signal is RedEnter a Sell and place the stoploss on the other side of the 2 moving averages channel.
Final WordsThis System has brought to me a new hope in life of making enough money for a forex retirementsomeday. I have made a lot of success ever since I discovered the renko and started using it. I mustFrankly let you know that just like any other system or strategy, This is not a 100% winning system ora holy grail thing, there will be losers here n there and moreover, I and the use of this system has putfull focus on getting the best entries, It is still flawed in the department of finding the perfect exitstrategies, I still have to come across someone or something that knows the perfect exit strategy andexit timings. This is as fool-proof as possible manual trading system today. Anyways I welcome youall to the world of making easy pips from forex and I am sure you will end up consistently profitableeven in the long-term from the use of Renko Ashi 2.Money Management, I’d always recommend that go very easy with it using this system, I wouldrecommend like no more than 5% and a maximum of 10% if the probability is high. Keepcompounding on the lot size as the balance grows, by 5% in lot size, you will be amazed that how inlike 10,000-20,000 pips you could make it to millions just by increasing your lot size by 5% of yourgrowing balance. Also I would like to suggest that do not put pressures on your trading with dailygoals like trying to make 100 pips everyday by forcefully trading, That is not how you do long-termsurvival business in forex, Just wait for the right setup whenever it happens and take what the marketcan easily give you, keep repeating this over and over again till success.I would recommend only using the renko ashi 2 system on the following pairsEURUSD, GBPUSD, AUDUSD, NZDUSD, USDCAD, USDCHF, USDJPY, EURJPY, GBPJPY, AUDJPY,CHFJPY, CADJPY, GBPCHF, EURGBP or any forex pair that has a spread of less than 10 pips is just fine.Please make sure that you are aware of the major sessions for the pairs you trade and to make sure ofthe newsbreaks and events for each of the pair by using an economic calendar. You can use thiscalendar located at forex factory, http://www.forexfactory.com/calendar.php to check on events foryour currency pairs. You can also use a timezone clock and install an alarm to check up on sessionsfor the pair your trading, The one I’m using is a free forex clock available on the web,http://qlock.com . For Example EUSUD only starts to move a lot after 7GMT when Frankfurt inGermany is open and GBPUSD only starts to move a lot at 8GMT when London in UK is open andUSDJPY only starts to move a lot when Tokyo is open and vice versa for other pairs. Please also payattentions to these two important days of the week, its probably usually the only times you couldmake a hell of a lot of pips, that is when the week starts on Monday, Monday markets really move alot, sometimes enough to make your weekly target and Fridays when the market ends there is usuallya big movement to make a lot of pips, so keep your eyes peeled on Mondays and Fridays.You can discuss or research more about the Renko Ashi Trading System 2 In the following forum topicat m.htmlFinally I have planned to open up a Skype Room Dedicated to Renko Ashi 2 Traders where you canchat, have fun and trade together this great system. You may add me at skype ID: mr-nims
Recommended BrokerThis is the best Broker on the Internet I've found so far, It has over 150 Currency and 500 CFD to tradeLow Spread on all pairs and leverage of 1:500 or 1:1000The best part is that its a GMT Broker so its very easy to trade sessions as you candles are on GMT Timezonehttps://www.exness.com/a/2705And there may be many more MT4 brokers with good spreads and trading conditions, youwill need to hunt them yourself, This is just the brokers I have been using since 3 yearswith no problems absolutely.Risk DisclaimerTrading in the Forex market is risky, you can lose partially or even completely all your funds in the forex market, Please makesure you are in sound financial condition and in light to accept any risk before trying to trade with live money. I will not be heldliable or responsible for losses from the use of my trading system, Please trade my system at your own risk. Thank you.
Breakout and Trend . MA_In_Color_wAppliedPrice – We will use a Linear Weighted MA in Color of 10 periods to . back testing a renko manual strategy on the trading simulator. Trading Simulator – This Is a trading
