Transcription
Dell Compellent StorageCenter SAN & VMware View 51,000 Desktop ReferenceArchitectureDell Compellent Technical Solutions
Dell Compellent Storage Center SAN & VMware View 1,000 Desktop Reference ArchitectureTHIS REFERANCE ARCHITECTURE IS FOR INFORMATIONAL PURPOSES ONLY, AND MAY CONTAINTYPOGRAPHICAL ERRORS AND TECHNICAL INACCURACIES. THE CONTENT IS PROVIDED AS IS, WITHOUTEXPRESS OR IMPLIED WARRANTIES OF ANY KIND. 2012 Dell Inc. All rights reserved. Reproduction of this material in any manner whatsoever withoutthe express written permission of Dell Inc. is strictly forbidden. For more information, contact Dell.Dell, the DELL logo, and the DELL badge and Compellent are trademarks of Dell Inc. VMware, ESXi andView 5 are trademarks of VMware Inc. Microsoft are trademarks of Microsoft Corp. Other trademarksand trade names may be used in this document to refer to either the entities claiming the marks andnames or their products. Dell Inc. disclaims any proprietary interest in trademarks and trade namesother than its own.January 20122
Dell Compellent Storage Center SAN & VMware View 1,000 Desktop Reference ArchitectureContentsIntroduction . 5Executive summary . 5Key findings . 6Dell Compellent Fast Track . 8Load Generation . 8Virtual Machine Properties .9VMware ESXi 5. 9Windows 7 . 11Antivirus . 11Storage Center Configuration . 11Data Progression, Replay Technology . 13Testing Results. 14Boot test . 14Load Test . 18View Planner Scoring Methodology . 18VMware View Planner 2.1 Workload Results . 19Functional IOPS. 20Conclusion . 21Reference Materials . 223
Dell Compellent Storage Center SAN & VMware View 1,000 Desktop Reference igureFigureFigureFigureFigureFigure1. Tested Architecture . 82. Virtual Disk Relationship per Volume . 103. VMware ESXi 5 Datastore Layout . 114. Storage Tiers SSD . 125. “VDI-SteadyState” Storage Profile . 136. Replay creation . 147. Replay statistics post workload run . 158. Total IOPS during boot storm . 179. SSD IOPS during boot storm . 1610. 15K IOPS during Boot Storm . 1711. IOPS with medium workload . 194
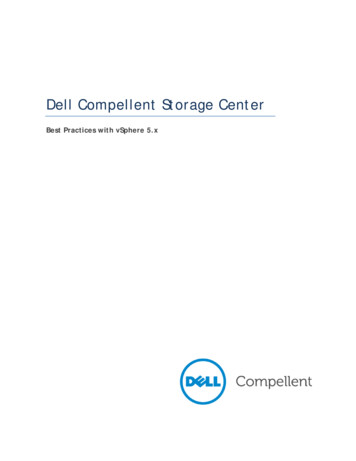
Dell Compellent Storage Center SAN & VMware View 1,000 Desktop Reference ArchitectureIntroductionThe intention of this document is to provide technical professionals with information to assist in theplanning, design and deployment of a Dell Compellent Storage Center SAN in a VMware View 5 VDIenvironment using VMware ESXi 5 as the hypervisor. This document is based on internal testing of 1,000virtual desktops on 16 Dell M710 HD physical blade servers. The data for this document was gatheredand validated at the Dell Compellent lab and design center.This document focuses on the impact of a virtual desktop infrastructure (VDI) on the Dell CompellentStorage Center SAN. As such, detailed information on host, network and other supporting infrastructureis out of the scope of this document. Host, network and supporting infrastructure is important to a VDIdeployment and should also be carefully evaluated when planning a VDI project.The information in this document is to serve as a reference to implementing VDI with the DellCompellent Storage Center SAN. Workloads will be different for each organization, depending onapplications and infrastructure. As such, it is strongly recommended that each organization run a VDIpilot to gather sizing and IOPS data as a basis for purchasing and provisioning the correct amount ofstorage.Executive summaryProper storage configuration is important to the success of a VDI project. Dell Fluid Data architectureand Dell Compellent integrated software features, such as automated tiered storage, thin provisioning,continuous snapshots and remote replication, provide a highly effective storage option for VMwareView.Dell Compellent Dynamic Capacity software separates storage allocation from utilization. Whileadministrators can create storage volumes of any size for virtualized applications, physical capacity isconsumed only when data is written to the disk. With thin provisioning, IT groups can avoid purchasingexcess capacity upfront. When applications require more storage, the system provisions it from thepool of unused capacity. For instance, thin provisioning can present 10 virtual storage volumes, 10TBeach, for use by 16 unique servers, but only require the physical capacity that is actually written foreach host.In addition, automated tiered storage from Dell Compellent, called Data Progression, can helporganizations optimize the use of storage in a VMware View environment with VMware ESXi 5. DataProgression can statically or dynamically move blocks of data between tiers of storage based onperformance characteristics. This allows the intelligent use of all tiers of storage, without the writepenalty typically associated with traditional storage arrays. Utilizing Data Progression, all writes intothe storage array occur at Tier 1, RAID 10. Over time, the software dynamically moves those blocks tomore efficient RAID levels, and the less frequently accessed blocks to lower tiers of storage. DataProgression reduces the need for large numbers of high-performance, high-cost disks by movingfrequently used data to higher performance tiers of storage while moving infrequently used data tolower cost, higher-density disks. The migration of data is done on the block level, so data within avolume can be moved based on performance characteristics. These technologies help to create anefficient storage platform for VMware View 5 with VMware ESXi 5.5
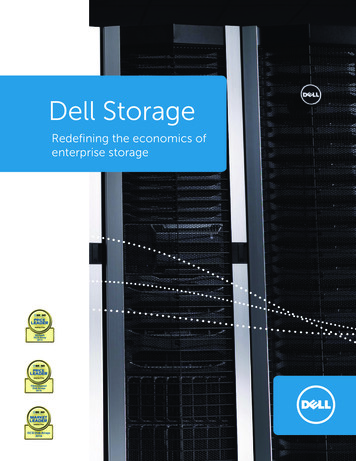
Dell Compellent Storage Center SAN & VMware View 1,000 Desktop Reference ArchitectureKey findingsThe Dell Compellent Technical Solutions team tested a sample of 1,000 virtual desktops and simulatedreal-world workloads using VMware View Planner 2.1 with VMware ESXi 5 and VMware View 5. Theenvironment included a Dell Compellent Storage Center SAN, Dell M1000e Blade enclosure, (16)M710HD blade servers, 10Gb iSCSI connectivity. VMware View Planner 2.1 uses standard officeapplications with periodic wait times to generate the simulated workload of a typical knowledgeworker.During the deployment of VMware View 5 virtual desktops, a selection of what datastore the replicadisks, delta disks, and persistent data disks reside becomes imperative to a successful VDIimplementation. Selecting different datastores for different types of VMware View disks allow a richend-user experience. Utilizing a Dell Compellent Storage Center SAN and 6 SSD drives to create avolume that stores the VMware View replica disks images helps offload the heavy read IOPS of a bootand login storm. Offloading the heavy read IOPS to the SSD disks allows the higher capacity, lower IOPS15k drives to handle the VMware View delta and persistent data disks.Using VMware View Planner 2.1 and the full user workload, a peak of 25,000 total IOPS and 400 MBPSthroughput was observed during View Planner boot-up initiation. Read/write percentage during boot-upsequence was 90% read and 10% write. After all 1,000 VDI desktops were booted and the workloadcommenced with a steady state of approximately 5,000 IOPS was observed. The read/write percentageduring the steady state workload testing was 10% read, and 90% write.In addition to the load test, a boot storm was emulated by powering on 1,000 virtual desktopssimultaneously via VMware vCenter. This generated IOPS as high as 36,000. During the boot storm anaverage of 70% of IOPS came from the SSD tier of storage, while the remaining 30% came from the 15Kdisk tier. While measuring sustained high IOPS, the length of the 1,000 virtual desktop boot storm wasapproximately six minutes.Tested architectureThe tested environment was comprised of 16 VMware ESXi servers running in two clusters with eightnodes per cluster. Each cluster was assigned to a single VMware View 5 Desktop Pool. Each VMwareView desktop pool consisted of 500 VDI desktops. Eleven volumes were provisioned from the DellCompellent Storage Center for each pool and corresponding VMware VMFS datastores were created onthose volumes: Five VMware datastores stored the delta disks, five VMware datastores stored thepersistent disks and one VMware datastore stored the replica disks.Powershell scripts were utilized to efficiently and accurately provision each volume in the DellCompellent array, and present and create the VMware VMFS datastores. (See appendix for example CSVanswer file) Each volume was 10TB in size; the disk size of 10TB was beyond the requirement for thetest. However, with thin provisioning from the Dell Compellent Storage Center, no space was wastedon the SAN.Additional infrastructure virtual machines were used to support the tested environment. This includedVMs for infrastructure tasks, such as Active Directory, SQL Server, Dell Compellent Enterprise Manager,VMware vCenter, VMware View 5, and VMware View Planner 2.1.6
Dell Compellent Storage Center SAN & VMware View 1,000 Desktop Reference ArchitectureTest infrastructure Dell M1000e Blade Chassiso(2) - Dell PowerConnect M6348 - Fabric Ao(2) - Dell PowerConnect M8024-k - Fabric B(16) Dell M710HD blade servers as virtual hosts for VDI desktopsoDual Six Core Intel Xeon X5650 2.7GHz processoro96GB 1333MHz DDR3 SDRAMoQuad-Port Broadcom 1-GbE Mezzanine Card (LAN) - Fabric AoIntel Ethernet X520 10 GbE x/k Mezzanine Card (ISCSI) - Fabric BoVMware ESXi 5 software iSCSI initiator(2) Dell PowerEdge R610 virtual hosts for infrastructure serversoDual Quad Core Intel Xeon X5506 2.13GHz processoro72GB RAMoDual-port Intel 10GbE NIC, Model x520-DA2 for network and iSCSIoVirtualized infrastructure including: 2, AD Domain controllers1, VMware vCenter 5 server1, VMware View 5 server1, VMware View Planner 2.1 Virtual Appliance1, Dell Compellent Enterprise Manager Data Collector server1, Windows Server 2008 R2 file server1, SQL Server 2008R2 server(2) Dell Compellent Storage Center Series 40 controllerso48, 2.5-inch 146GB 15K SAS driveso6, 2.5-inch 200GB SSD SAS drivesoFirmware Version 5.5.3o10GB iSCSIoDell Compellent Fast Track-enabled7
Dell Compellent Storage Center SAN & VMware View 1,000 Desktop Reference ArchitectureFigure 1. Tested architectureDell Compellent Fast TrackThe desktop deployment utilized the Dell Compellent StorageCenter SAN feature Fast Track, which dynamically places themost frequently used data on the fastest, or outer, tracks ofeach drive. By continually optimizing data placement on eachdisk, Fast Track eliminates wasted space on the fastestportion of the drive. In this test, Fast Track was used onevery drive within the system.8
Dell Compellent Storage Center SAN & VMware View 1,000 Desktop Reference ArchitectureLoad generationTo accurately represent a real-world scenario, a load generation utility was used throughout the test.The load was generated using VMware View Planner 2.1 application. VMware View planner replicated aworkload of 1,000 virtual desktops logging in and used a variety of office applications such as MicrosoftOffice, Internet Explorer, Mozilla Firefox, archiving software, and video playback. VMware ViewPlanner 2.1 initialized a workload run that consisted of 8 total workload iterations. To pass this test,the 95th percentile of application latency must be below 1.5 seconds.Virtual machine propertiesFollowing VMware View Planner 2.1 guidelines ageneric "Base VM" was utilized to create all1,000 VMware View Composer Linked Clonedesktops. The template consisted of VMwareHardware v.8, 1 CPU, 1024mb of RAM, LSI LogicSAS Controller, 1 40GB Eager-Zeroed Hard Disk,1GB Eager-Zeroed Hard Disk, CD-ROM Device andNetwork adapter (VMXNET 3). Microsoft Windows7 32-bit was installed as the desktop OperatingSystem.VMware ESXi 5VMware ESXi 5 Enterprise edition was utilized asthe hypervisor for the guest virtual machines.ESXi storage connectivity was configuredutilizing the VMware ESXi software ISCSI initiatorand the dual port Intel 10Gb mezzanine cards ineach Dell M710 blade server. (Figure.1)vSwitch1 was assigned both Intel 10Gb ports. An“ISCSI-1” port group and “ISCSI-2” port group foreach Intel 10Gb port was a created. Each port grouphad a dedicated physical NIC, IP address andVMkernel port. ISCSI-1 and ISCSI-2 port groups werethen bound to the VMware ESXi software ISCSIadapter. All paths to the storage array wereconfigured to utilize the native VMware NMP ofRound Robin to distribute the load of the VDIdesktops over all paths for all volumes. A single “VMNetwork” port group was added for virtual machineconnectivity.VMware ESXi management and vMotion networksutilized vSwitch0 and the 4 port Broadcom onboardNICs. NIC0 was active for management and NIC1, 2,3 were set to standby in case of NIC0 failure. The vMotion network consisted of the remaining9
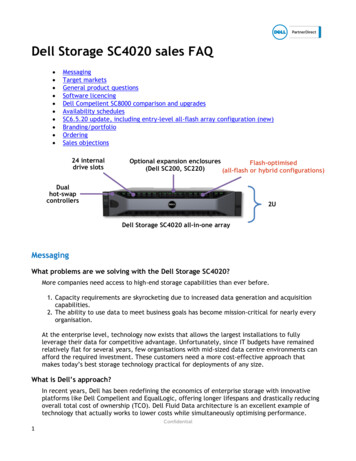
Dell Compellent Storage Center SAN & VMware View 1,000 Desktop Reference Architecture3 NICs. NIC1, 2 and 3 all had separate port groups and VMkernal ports setup and dedicated for Vmotion.By setting all 3 NICs, VMware ESXi 5 allows aggregation of the 1Gb NICs to provide maximum throughputfor vMotion activities.VMware View 5To prepare for the desktop deployment, a single virtual machine (VM) was created as the base imagefor VMware View 5. This image was optimized and configured in accordance with the VMware ViewPlanner 2.1 installation and user guide. Windows 7 SP1, Microsoft Office 2007 and other businessapplications required by VMware View Planner 2.1 were installed. The VMware View Desktop Agent wasinstalled for management within Virtual Machine. Lastly, the VMware View Planner 2.1 setup packagewas installed to prepare the image for the VMware View Planner 2.1 Load Generation tool.The base image then was shutdown and a VMware snapshot of the virtual machine was created. AVMware snapshot is a requirement of VMware View Composer 5 linked clones. A VMware View 5automated resource pool (Pool1) with 500 VMware View Composer linked clone virtual machines wascreated. An identical automated pool of 500 virtual machines was created for (Pool2). The snapshotimage was then automatically cloned to each specific replica disk for each pool. After the replica wascopied to its respective VMware Datastore, the VMware View Composer linked clone virtual machinecreation process began.Figure 2. Virtual disk relationship per volume10
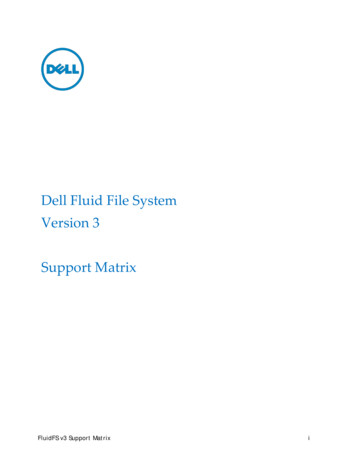
Dell Compellent Storage Center SAN & VMware View 1,000 Desktop Reference ArchitectureFigure 3. VMware ESXi 5 datastore layout per poolVMware View 5VMware View 5 Pool er-4P1-User-4P1-User-5P1-User-5VMware View 5 Pool er-4P2-User-4P2-User-5P2-User-5Windows 7The virtual desktops platform for all tests was Windows 7 Professional 32-bit with SP1. Each VM wasconfigured with one vCPU and 1024Mb of memory. Microsoft Office 2007 was installed, as well as theapplications required for VMware View Planner. The template desktop was optimized using the bestpractices from the View Planner installation guide and VMware View and Windows 7 optimization guide.AntivirusNo antivirus product was utilized within the VMs. Introducing traditional antivirus software maydramatically increase the I/O load of the VM. Special consideration should be taken when implementingantivirus programs in a virtual environment. Using virtualization-aware antivirus applications such asVMware vShield Endpoint or Trend Micro may reduce the I/O requirements within the virtualenvironment.Storage Center configurationThe Dell Compellent Storage Center SAN was designed to maximize performance in a VDI environment.A pool of disks was created with two tiers of storage within the SAN. The first tier consisted of six200GB SSDs, and the second tier consisted of forty-eight 146GB SAS drives. Making 1 SDD and 2 15k11
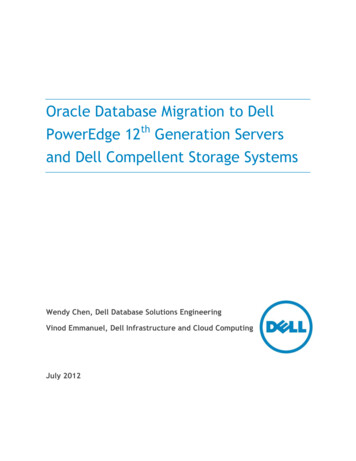
Dell Compellent Storage Center SAN & VMware View 1,000 Desktop Reference Architecturedrives hot spares left a total of 5 active 200Gb SSD drives and 46 active 15k 146Gb drives. StorageCenter was running firmware version 5.5.3 during the test.Figure 4. Storage tiers SSDTwo custom storage profiles were created to accommodate the performance characteristics of the twodrive types used in testing. The first custom storage profile created was the “VDI-Replica” profile(Figure 5). It was applied to all replica volumes to “lock in” the replica images on the Tier1 SSD. Thesecond custom storage profile that was created was “VDI-SteadyState” profile (Figure 5). This profilebypasses the SSD tier1 and directs all writes to the 15k tier of disks. (For details on creating customstorage profiles, see the Dell Compellent Administration Guide).Figure 5.“VDI-SteadyState” storage profile“VDI-Replica Storage” profile12
Dell Compellent Storage Center SAN & VMware View 1,000 Desktop Reference ArchitectureData Progression, replay technologyData Progression is the technology that allows the Dell Compellent Storage Center to dynamically move2Mb pages of storage between tiers of storage or between different RAID types among the same tierlevel. Data Instant Replays are the snapshot component of a Dell Compellent Storage Array. DataInstant Replays are unique because they utilize a technology of redirect at write instead of thetraditional copy on write technology. At a very high level when a Replay is taken of a volume, allactive 2Mb pages are marked as read-only. All pages that are marked as read-only will stay read-onlyuntil either a new write is directed at a specific page or the data in the specific page is deleted.Data Progression is dependent upon replays to maximize storage efficiency. Data Progression, which isa daily low priority scheduled activity, analyzes all volumes and determines which pages have theread/-only attributes. Data Progression dynamically moves the read-only pages to a more efficient RAIDlevel typically RAID 5-9 or RAID 6-10.Data Progression is a powerful tool for VDI efficiency. Because VDI is traditionally write-intensive, theDell Compellent Storage Array is a perfect fit. Dell Compellent is very efficient with writes because thedefault RAID type of all volumes is RAID 10. RAID 10 offers significant write performance because of aminimal write penalty. After a replay is taken of the volume, Data Progression will then move thenewly created pages to RAID 5 or RAID 6. Because reads from RAID 5 or RAID 6 not incur a read penaltyread performance from RAID 5 or RAID 6 are comparable to reading data from RAID 10.A replay profile named VDI was created in the Dell Compellent Storage Center GUI. The replay profileschedule was setup to take a replay daily at 6 p.m. (See Figure 6) The VDI replay profile also expiredafter only 25 hours. Setting an expiration of 25 hours allows for maximum performance from DataProgression and allows for minimal disk space to be consumed. The replay profile was then associatedto all VMware View Datastores. (See Figure 3)Figure 6. Replay creationFigure 7 shows one of the VMware View Delta volumes used for testing. Each Delta volume was utilizedby approximately 100 VDI desktops. The chart shows the volume consumption statistics after a ViewPlanner 2.1 workload test had finished. Within this volume, 54.07GB of data resided on the 15k Tier3drives configured as RAID 5-9. The remaining data resided on RAID 10 with Fast Track (the outer 20% ofthe disk) or RAID 10 standard. Because of Dell Compellent ability to ingest all writes at RAID10, 33GB of13
Dell Compellent Storage Center SAN & VMware View 1,000 Desktop Reference Architecturedata was written throughout the day during the workload test on this single volume with 100 VMsrunning on it. After the View Planner workload completed, another replay was to be taken of thisvolume. Data Progression will move those RAID 10 pages onto RAID 5 and old expired RAID 5 pages willexpire and be reallocated to the free page pool.Figure 7. Replay statistics post workload runTesting resultsTesting for this reference architecture involves measuring two performance indicators. The firstindicator is the amount of IOPS consumed during a boot storm. The second indicator measures theperformance of all 1,000 desktops during simulated user load.Boot testThe boot test represents a worst-case scenario where all 1,000 virtual desktops are powered onsimultaneously. This situation would not take place during normal VMware View operation due toVMware View’s power management functionality. However, it is plausible that many desktops will needto be started quickly in a production environment, possibly when recovering from an outage. A bootstorm also provides a good measurement of overall back-end storage performance.In our testing, the length of the boot storm was measured by examining the duration of sustained highIOPS during a simultaneous power on of all 1,000 virtual desktops. In the configuration outlined above,with the replica image residing on SSDs, and all other read-write operation coming from 15k SAS drives,the average length of the boot storm was six minutes. During the boot storm, total front end IOPSranged from 32,000 to 35,000. Seventy percent of all IOPS came from the read-only SSD tier, while theremaining 30% came from the 15K SAS tier. Read latency on the delta volumes spiked to 30ms. Writelatency averaged 35ms during the same time. This high latency is common because of the limited14
Dell Compellent Storage Center SAN & VMware View 1,000 Desktop Reference Architecturenumber of 15k drives required to meet the steady state requirements of the user workload. Becauseonly 30% of the total IOPS required for the boot storm came from these 15k drives, the latency duringthe boot storm was acceptable. There was no measurable read latency on the SSD tier of storage.The graphs below show an example of one of the boot tests performed with 1,000 virtual desktops. Asthe graphs show, the majority of reads came from SSD/replica disk during the boot storm. This is dueto the read-only replica data on the master image residing on SSD disks. There is also an initial readspike on the 15K disk tier with the number of writes increasing as the systems are booted. After theboot storm, the number of writes surpasses the number of reads.(Figure 8) shows the overall IOPS/sec during the 1,000 virtual desktop boot storm. The yellow line isoverall IOPS/sec, the purple line is read IOPS/sec and black line is write IOPS/sec. Notice thedependency on reads during the boot storm process.(Figure 9) shows the SSD disks IOPS/sec during the 1,000 virtual desktop boot storm. The yellow line isoverall IOPS/sec, the purple line is read IOPS/sec and black line is write IOPS/sec. Notice that the SSDdisks are providing approximately 70% of the IOPS/sec during the boot storm period. Also note that nowrites were occurring at the SSD tier of disks.(Figure 10) shows the 15k disks IOPS/sec during the 1,000 virtual desktop boot storm. The yellow line isoverall IOPS/sec, the purple line is read IOPS/sec and black line is write IOPS/sec. Notice that the 15kdisks are providing approximately 30% of the IOPS/sec during the boot storm period. Although 30% mayseem like a small dependency, under sizing the 15k disks may present a bottleneck during boot andlogin storms. In this scenario the 15k disks do provide adequate IOPS/sec, but latency on the 15k diskswas relatively high at 30-40ms during the boot storm.15
Dell Compellent Storage Center SAN & VMware View 1,000 Desktop Reference ArchitectureFigure 8. Total IOPS during boot stormFigure 9. SSD IOPS during boot storm16
Dell Compellent Storage Center SAN & VMware View 1,000 Desktop Reference ArchitectureFigure 10. 15K IOPS during boot storm17
Dell Compellent Storage Center SAN & VMware View 1,000 Desktop Reference ArchitectureLoad testThe goal of the load test is to identify the impact of the user workload on the Dell Compellent Storagearray. The load test was performed against the 1,000 desktops using VMware View Planner 2.1. VMwareView Planner 2.1 was run utilizing the local mode option. The local mode operation starts 64 virtualdesktops per minute until the required (1,000) virtual machines check-in with VMware View Planner.Once all 1,000 virtual desktops successfully check-in, the load test begins on the 1,000 virtualdesktops.View Planner scoring methodologyWhen the View Planner workload generator is run according to specific requirements, it produces aView Planner score. This score indicates how many users concurrently running a standardized set ofoperations a particular storage infrastructure can support.While this standardized set of operations is representative of many real‐world deployments, some usersmight have different needs. The custom applications feature allows these varying loads to be modeledand is designed to address this exact use case. However, because of the lack of standardization, runsusing the custom applications feature may not be used to generate a compliant View Planner score.View Planner workload run phasesDuring a workload run each desktop virtual machine goes through three phases: Ramp‐Up (one iteration)Steady‐State (at least three iterations)Ramp‐Down (one iteration)During an iteration of the user workload, View Planner reports the latencies for each operationperformed within each virtual machine.Requirements for compliant runIn order for a workload run to be considered compliant, it must meet the following requirements: It must run all of the standard View Planner applications and no other applications.The think time for View Planner must be set to 20 seconds.It must contain at least five iterations (including Ramp‐Up and Ramp‐Down).At least 95% of the response times during Steady‐State must be 1.5 seconds or less.View Planner Workload Configuration Users - 1,000Workload type – Local ModeIterations – 8Ramp-up Time - 1 secondThink Time – 20 secondsAll VMware View Applications – MS Outlook, MS Excel, MS Word, MS PowerPoint, MS InternetExplorer, Adobe Acrobat, 7zip, Mozilla Firefox, Windows Media Player18
Dell Compellent Storage Center SAN & VMware View 1,000 Desktop Reference ArchitectureVMware View Planner 2.1 workload resultsThe workload test was a local mode run with VMware View planner set to 8 iterations, a think time of20 seconds, and a ramp up time of 1 second. All required VMware View Planner applications weretested during this workload. The 8 iterations that made up the workload took approximately 10 hoursto complete.The average IOPS/sec for the entire test including boot and login was approximately 6,450 IOPS. Theread-write % during the workload was 10% read 90% w
The load was generated using VMware View Planner 2.1 application. VMware View planner replicated a workload of 1,000 virtual desktops logging in and used a variety of office applications such as Microsoft Office, Internet Explorer, Mozilla Firefox, archiving software, and video playback. VMware View Planner 2.1 initialized a workload run that .