Transcription
TutorialHealthc Inform Res. 2017 2017.23.4.349pISSN 2093-3681 eISSN 2093-369XInteractive Visualization of Healthcare Data UsingTableauInseok Ko, MS1, Hyejung Chang, PhD21Division of Biomedical Informatics, Seoul National University College of Medicine, Seoul, Korea; 2School of Management, Kyung Hee University, Seoul, KoreaObjectives: Big data analysis is receiving increasing attention in many industries, including healthcare. Visualization plays animportant role not only in intuitively showing the results of data analysis but also in the whole process of collecting, cleaning, analyzing, and sharing data. This paper presents a procedure for the interactive visualization and analysis of healthcaredata using Tableau as a business intelligence tool. Methods: Starting with installation of the Tableau Desktop Personal version 10.3, this paper describes the process of understanding and visualizing healthcare data using an example. The exampledata of colon cancer patients were obtained from health insurance claims in years 2012 and 2013, provided by the HealthInsurance Review and Assessment Service. Results: To explore the visualization of healthcare data using Tableau for beginners, this paper describes the creation of a simple view for the average length of stay of colon cancer patients. Since Tableauprovides various visualizations and customizations, the level of analysis can be increased with small multiples, view filtering,mark cards, and Tableau charts. Conclusions: Tableau is a software that can help users explore and understand their data bycreating interactive visualizations. The software has the advantages that it can be used in conjunction with almost any database, and it is easy to use by dragging and dropping to create an interactive visualization expressing the desired format.Keywords: Data Display, Statistics as Topic, Information Storage and Retrieval, Artificial IntelligenceI. IntroductionData visualization is an intuitive way for users to easily readand understand data, especially in big data analyses. It helpsto improve the quality of policies or services by presentSubmitted: September 27, 2017Revised: October 19, 2017Accepted: October 20, 2017Corresponding AuthorHyejung Chang, PhDSchool of Management, Kyung Hee University, 26 Kyungheedae-ro,Dongdaemun-gu, Seoul 02447, Korea. Tel: 82-2-961-9432, E-mail:hjchang@khu.ac.krThis is an Open Access article distributed under the terms of the Creative Commons Attribution Non-Commercial License (http://creativecommons.org/licenses/bync/4.0/) which permits unrestricted non-commercial use, distribution, and reproduction in any medium, provided the original work is properly cited. 2017 The Korean Society of Medical Informaticsing an integrated view and evidence for making healthcaredecisions [1,2]. Tableau connects users with a variety ofdata sources and enables them to create data visualizationsby making charts, maps, dashboards, and stories through asimple drag and drop interface. Although Tableau has received some attention in the healthcare field [3], Tableau isstill not widely used in the healthcare industry. Therefore,this paper introduces Tableau and presents the procedure ofusing Tableau for the interactive visualization and analysis ofhealthcare data to encourage its widespread use.II. Methods1. Installing TableauTableau provides three versions of Tableau Desktop [4]. ThePublic version is free but the Personal and Professional versions are available with a fee or free 14-day trial. However,Tableau provides a 1-year free product key with support for
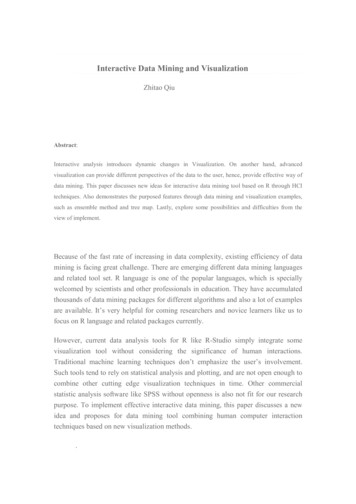
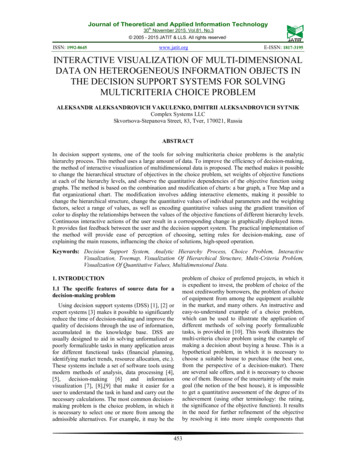
Inseok Ko and Hyejung Changstudents and instructors in academic programs. This tutorialreflects the Tableau Desktop Personal version 10.3 (64-bit).To install Tableau, an e-mail address is required for the userto set up an account [5]. Downloads can be accessed throughthe addresses shown in Figure 1. The user enters the e-mailaddress and clicks the ‘Download’ button. Then a downloadwill be begin automatically. The 32-bit and Mac versions canbe downloaded via the link “Need a different version?” If theuser uses 32-bit OS, it can be downloaded with 32-bit version automatically.When the user runs a downloaded file, user agreement tothe terms and conditions is required before installation. Theuser must confirm that agreement is checked and click theinstallation button. Installation will proceed and Tableau willbe run automatically. When a Tableau activation windowpops up, the user can click a trial or product key buttons.This procedure description is for a trial of Tableau Desktop.To download a free product, Tableau Public, the user canclick the ‘Download’ button of the Public version [4]. Thedownload and installation process is the same as that for theTableau Personal version.To obtain a 1-year free product key, the user can apply forthe Academic Programs supported by Tableau [6]. Procedures can be followed by accessing the pertinent points (i.e.,students, instructors, and administration). For example, auser who has access to students should click on the ‘GETTABLEAU FOR FREE’ button to enter his or her user information on the entry screen. One can receive a 1-year freeproduct key by sending roof papers by email according tothe procedure shown in Tableau.2. Connecting to Sample DataThe sample in this example procedure description includesthe height and weight data of colon cancer patients fromhealth insurance claims during the years 2012 and 2013,provided by the Health Insurance Review and AssessmentService (HIRA) [7]. Once the data is ready, various files (Excel, text, Access, and so on) and a server (MS SQL, MySQL,etc.) can be connected via the Connections section to the leftof the Tableau window.This sample is Excel formatted data, so Excel is selectedto import the data. The attached datasets appear in the upper left corner, and the sheets are listed at the bottom of thedatasets. These consist of 2012 and 2013 sheets. If the 2012sheet is selected and dragged to the ‘Drag sheets here’ section, the 2012 sheet will be added to the section, and the datawill be displayed below. To merge the 2012 and 2013 sheets,the 2013 sheet is dragged to ‘Union’ as shown on the 2012sheet. Then, the worksheet is clicked next to the bottom datasource to create a new worksheet. The Tableau workspaceconsists of the following items and functions (see Figure 2): Menus: files, data, worksheets, dashboards, stories, etc. Toolbar: undo, redo, swap rows and columns, show me,etc. Data Pane: Tableau assigns data fields of the connecteddataset in the left section. ‘Formatting’ and ‘Analytics’Figure 1. Downloading a trial of Tableau Desktop .23.4.349
Interactive Visualization Using TableauMenusToolbarShelves and cardsViewData paneSheet tabspanes are also available.- ‘Dimensions’ in the upper section include discrete categorical data such as type or date.- ‘Measures’ in the lower section contain continuous data. Shelves and Cards: page shelf, filter shelf, mark cards, andtop space with row and column shelves View: The right space to create a view (table, graph) byadding fields Sheet Tabs: Create or move to created worksheets, dashboards, and storiesIII. Results1. Basic ViewTo start with a basic view for comparing the lengths of stay(LOSs) of male and female colon cancer patients, ‘gender’ inthe Dimensions is dragged and dropped into the ‘columns’shelf. The gender field is displayed in blue. Then, “LOS” inthe Measures is dragged to the ‘rows’ shelf. The LOS fieldis displayed in green. The continuous field is automaticallycalculated as a total ‘sum’ and appears as a bar graph. Thisshows that the total LOS of male patients was larger thanthat of female patients. By selecting the LOS field that hasVol. 23 No. 4 October 2017Figure 2. Interface of workspace inTableau Desktop.changed to a total sum, it is possible to change it to differentformats, such as average. The total LOS of male patients waslarger than that of female patients, but there was no difference between the average LOSs of male and female patients(Figure 3).2. Increasing the Level of Details with Small MultiplesTo increase the level of detail, an additional field, such ascancer stage, can be added to the previous basic view. Then,the LOSs can be compared by gender and final stage. The ‘final stage’ field of the Dimensions is dragged to the rows shelfand placed in front of the LOS field. The same results can beobtained by dragging the final stage field to the left averageLOS axis of the view.3. Filtering the View and Using the Mark CardsAfter creating a basic view using rows and columns shelves,mark cards and filters can be used to create a higher level ofviews. Explicitly, the view can be filtered to focus exploration, and mark cards can be used to add depth to the analysis. To compare the LOSs by gender and final stage after filtering C180, C19, and C20 of the ‘main code’, the main codefield of the Dimensions is dragged to the ‘filter’ shelf. The filwww.e-hir.org351
Inseok Ko and Hyejung ChangFigure 3. Getting started with a basic view.Figure 4. Example of filtering views and using mark cards.ter [Main code] pop-up window appears. In the ‘general’ tab,C180, C19, and C20 are checked, and then the ‘OK’ button352www.e-hir.orgis pressed. The view is updated with filtered data. Next, themain code field is dragged into the ‘color’ of the mark cards.https://doi.org/10.4258/hir.2017.23.4.349
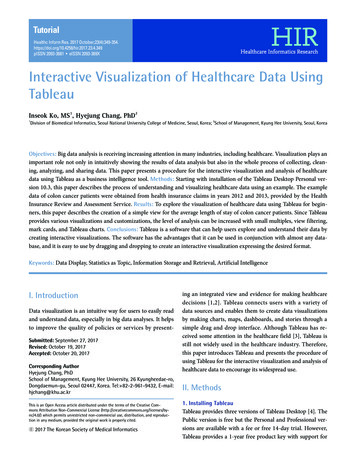
Interactive Visualization Using TableauThe filtered main code is updated to indicate the gender andthe average LOS according to the final stage combined withthe generation of the color legend (Figure 4).4. Building a Tableau Chart (Treemap)Although the stacked bar chart is created automatically,it is possible for Tableau to change various graphs in the‘Show Me’ section [8]. For example, to change the graph to‘Treemap’ on the toolbar, one should click Show Me in theupper-right corner, and then select Treemap. It appears asa changed tree map automatically. The size and color of therectangle in the Treemap is determined according to the average LOS. The longer the average LOS, the darker the colorand the larger the size of the rectangle. The main code fieldis dragged and dropped to the color of the mark cards. Depending on the values of the previously filtered main codefield, the color of the rectangle changes. The ‘weight’ field inthe Measures is dragged to the color of the mark cards, andthe sum is changed to the average of the weight field. Then,the color can be edited the color. ‘Red-Blue-White Diverging’ is selected, ‘Reversed’ is checked, and then the OK button is clicked. The average LOS determines the size of therectangle, and the average weight determines the color of therectangle (Figure 5).IV. DiscussionBy following the procedure described in this paper, it is possible to create a simple view to explore sample data usingTableau for beginners. Tableau provides various visualizations, such as tables, heatmaps, maps, bar charts, treemaps,line charts, bubble charts, and so on as well as customizations, such as radar charts with user intention. Users canalso create interactive visualizations that express the desiredFigure 5. Example of a Tableau chart, Treemap.Vol. 23 No. 4 October 2017www.e-hir.org353
Inseok Ko and Hyejung Changformat using filters, drop-down lists, the calculated field, andso on. This procedure is intended for beginner level, so indepth functions and detailed options for intermediate andadvanced users will be covered in the forthcoming paper.Conflict of InterestNo potential conflict of interest relevant to this article wasreported.AcknowledgmentsThis work was supported by the National Research Foundation of Korea (NRF) grant funded by the Korea government(No. 2015S1A5A2A01014390).References1. Wang L, Wang G, Alexander CA. Big data and visualization: methods, challenges and technology progress.Digit Technol 2015;1(1):33-8.2. Janvrin DJ, Raschke RL, Dilla WN. Making sense ofcomplex data using interactive data visualization. J Account Educ 2014;32(4):31-48.354www.e-hir.org3. Martinez R, Ordunez P, Soliz PN, Ballesteros MF. Datavisualisation in surveillance for injury prevention andcontrol: conceptual bases and case studies. Inj Prev2016;22(Suppl 1):i27-33.4. Tableau. Meet the Tableau Desktop family [Internet].Seattle (WA): Tableau; c2017 [cited at 2017 Sep 2].Available from: https://public.tableau.com/en-us/s/download.5. Tableau. Downloading a trial of Tableau Desktop [Internet]. Seattle (WA): Tableau; c2017 [cited at 2017 Sep 2].Available from: 6. Tableau. Academic programs [Internet]. Seattle (WA):Tableau; c2017 [cited at 2017 Sep 2]. Avaiable from: https://www.tableau.com/academic.7. Healthcare Bigdata Hub. Public data of colorectal cancer patients in 2012 and 2013 [Internet] Wonju, Korea:Health Insurance Review and Assessment Service; c2017[cited at 2017 Sep 2]. Available from: o?sno 1&publDataTpCd &searchCnd &searchWrd &pageIndex 4.8. Mackinlay J, Hanrahan P, Stolte C. Show me: automaticpresentation for visual analysis. IEEE Trans Vis ComputGraph 7.23.4.349
Although Tableau has re-ceived some attention in the healthcare field [3], Tableau is still not widely used in the healthcare industry. Therefore, this paper introduces Tableau and presents the procedure of using Tableau for the interactive visualization and analysis of healthcare data to encourage its widespread use. II. Methods 1. Installing Tableau