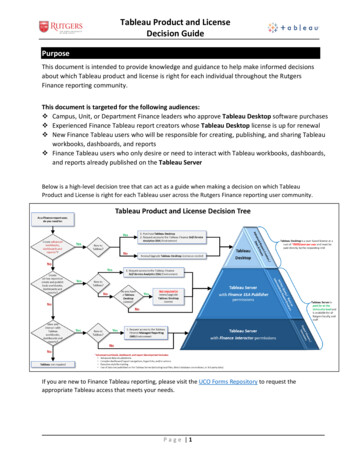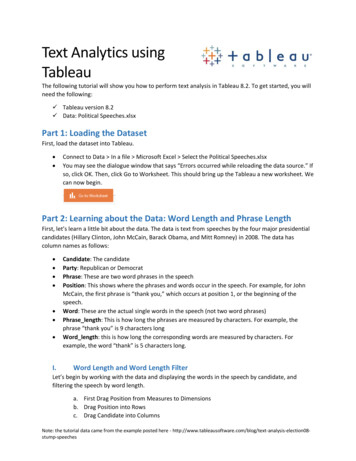
Transcription
Visual Analytics Utilizing TableauInteractive DashboardsMichael Le, Humboldt State UniversityDmitri Rogulkin, Fresno State University
OverviewAgenda Dashboards/FERPA/ IRB Dashboard Best Practice Using Tableau Public Using Tableau Server Demonstrate Visual Analytics Dashboards Question and Answer
Dashboards/FERPA/ IRBBuzz Words Dashboards Key Performance Indicator Visual Analytics
Dashboards/FERPA/ IRBBuzz Words Dashboards Presents information in a way that is easy to read and interpret Key Performance Indicator Success or steps leading to the success of a goal Visual Analytics Examine data visually for patterns, trends, or differences between groups
Dashboards/FERPA/ IRB
Dashboards/FERPA/ IRBSolutions Public Facing Dashboards Limit drill down capability Login Required Dashboards Limit access to the dashboard
Dashboard Best Practice
Dashboard Best PracticeSteps for creating Dashboards1. Choose metrics that matter2. Keep it visual3. Make it interactive4. Keep it current or don’t bother5. Make it simple to access and use
Dashboard Best PracticeInstitutional Dashboards: NavigationalTool for Colleges and UniversitiesNumber 123, Winter 2012
Dashboard Best PracticeIndicator Group Usage Ranking by CategoryCategoryIndicator GroupPercentFinancial IndicatorsEndowment & Expenses Data80%AdmissionsAdmissions Scores79%EnrollmentEnrollment Figures77%FacultyFaculty – General77%Student OutcomesGraduation Rates73%
Dashboard Best PracticeSteps for Creating Dashboards1. Select a metric2. Visual presentation3. Design4. Refine5. Publish
Using Tableau Public
Using Tableau PublicTableau Public Free to use 1 GB of storage Easy to embed in webpageTableau Public Premium Price based on page views
Using Tableau PublicHSU IR Webpage Navigation Video Tutorial Printing
Using Tableau Public
Using Tableau Public
Using Tableau Public
Using Tableau Server
Using Tableau Server(Fresno State)PeopleSoftERS DataOther DataSQL ServerTableauProfessionalTableauServer(WWW)
Using Tableau ServerKey Learn, Engage,Solve ProblemsSeniorManagementCommittees &Task ForcesAdvisors
Demonstrate Visual Analytic Dashboards
Question and Answer
Question and AnswerMichael LeDmitri RogulkinHumboldt State UniversityFresno State no.eduPresentation Posted at:www.humboldt.edu/irp/presentations.html
Video Tutorial Printing . Using Tableau Public . Using Tableau Public . Using Tableau Public . Using Tableau Public . Using Tableau Server . Other Data SQL Server . Tableau Professional . Tableau Server (WWW) Using Tableau Server Key Audience . Deans . Chairs . Program Coordinators Senior Management . Advisors . Committees & Task .
