Transcription
MSAR # 29762019 Report on theAvailability & Affordability of Health CareProfessional Liability InsuranceSubmitted to theLegislative Policy Committeeby theMaryland Insurance AdministrationAl Redmer, Jr.CommissionerSeptember 1, 2019
For further information concerning this document contact:Robert Baron, Associate CommissionerMaryland Insurance Administration200 St. Paul Place, Suite 2700Baltimore, Maryland 21202410.468.2353This document is available in alternative format upon requestfrom a qualified individual with a disability.TTY 1-800-735-2258The Administration’s website address is: www.insurance.maryland.gov
Table of ContentsExecutive Summary 1Introduction .1-2Maryland’s Medical Malpractice Insurance Market .2Medical Malpractice Insurance Premiums in Maryland .2-3Closed Claims 3-4Conclusion .4Exhibit List .5
EXECUTIVE SUMMARYHealthcare professional liability insurance (hereinafter “medical malpractice insurance”)covers doctors and other healthcare professionals for liability claims arising from the treatmentand care of patients. This annual report is based on data supplied by insurer groups to theMaryland Insurance Administration (“MIA”). The continuous availability and affordability ofmedical malpractice insurance to practitioners in Maryland is a vital and necessary component ofMaryland’s health care system.In 2002 and 2003, rapid and substantial increase in medical malpractice insurance premiumsthreatened to weaken access to high-quality health care in Maryland. The General Assemblyacted in 2004 and 2005 to stabilize the medical malpractice insurance market and to require theMIA to collect relevant data and report annually to the General Assembly on the state ofMaryland’s medical malpractice market. This data is summarized in Exhibits A through L.In Maryland, medical malpractice insurance is available to be purchased from admittedinsurers, non-admitted (surplus lines) insurers and risk retention groups. All writers of medicalmalpractice insurance are licensed or authorized by the MIA to conduct business in the state. In2018, 67 insurer groups wrote medical malpractice insurance policies in Maryland for all typesof health care providers. Total medical malpractice premium collected by these insurer groupswas 286,320,300, representing a decrease of 1.7 % from the prior year. Admitted insurersaccounted for 50% of the total written premium, while surplus lines insurers and risk retentiongroups accounted for 16% and 34% respectively.While the number of insurer groups engaged in the medical malpractice market in Marylandis substantial and has not fluctuated significantly over the past ten (10) years, the marketplaceremains highly concentrated with respect to premium volume. The leading admitted insurer andthe leading risk retention group account for 59% of the total premium volume collectively. Thatsaid, the market’s premiums remained stable over the past year as evidenced by the fact that onlyfive (5) insurers made a rate increase filing during fiscal year 2019 (July 1, 2018 through June30, 2019). These filings resulted in average increases of between 2.4% and 10.9 % to a total of3,147 policyholders. These increases were offset in the market by premium decreases averaging4.4% impacting over 5,800 policyholders insured by our largest market share insurer group. Oursecond largest insurer group did not make a rate impact filing in fiscal year 2019. Thus, medicalmalpractice insurance premiums have again remained affordable and stable in Maryland’smarket over the past year.INTRODUCTIONHealth care providers are not required by law to purchase and maintain medicalmalpractice insurance. Providers who elect to not purchase this coverage cannot participate inhealth care networks supporting preferred provider organizations, health maintenanceorganizations or managed care organizations.1
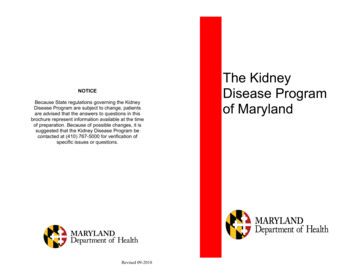
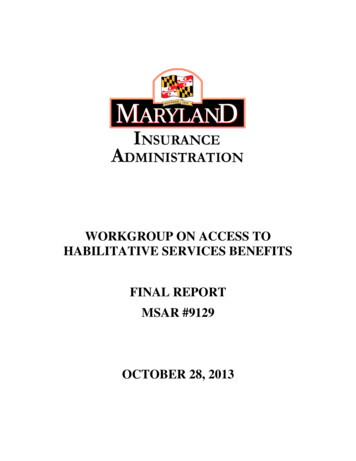
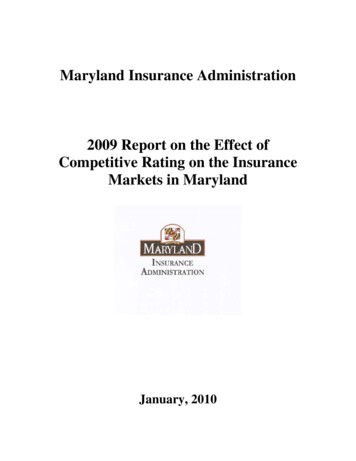
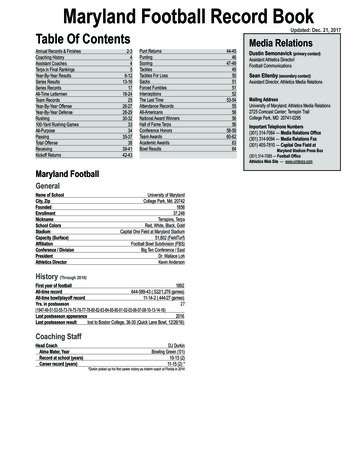
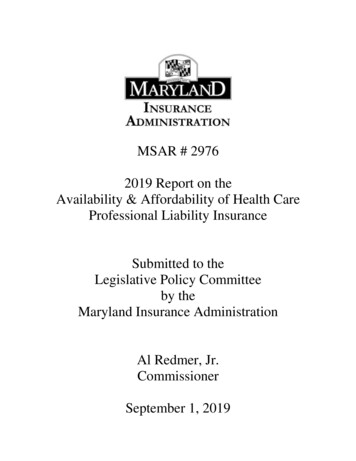
Medical malpractice insurance premiums began to escalate in 2002 and increasedsubstantially in 2003 and 2004. The General Assembly intervened in 2004 and 2005, includingdirecting the MIA to collect data and report back to the General Assembly on this criticalinsurance market segment annually. In response, the MIA provides this report each year,including among other metrics, information about the number of active insurers in the medicalmalpractice insurance market in Maryland, premium rates for selected medical specialties anddata for closed medical malpractice claims.MARYLAND’S MEDICAL MALPRACTICE INSURANCE MARKETAdmitted insurers, surplus lines insurers and risk retention groups all provide medicalmalpractice insurance policies to a wide variety of health care professionals in Maryland.1Exhibits A1 through A5 provide detailed information about these insurer groups. As in theprevious year, in 2018, the top two (2) insurer groups operating in Maryland were an admittedinsurer created by the General Assembly2, Medical Mutual Liability Insurance Society ofMaryland (MMLIS); and, MCIC Vermont (MCIC), a risk retention group organized underVermont law operating in Maryland as a non-admitted insurer. These two insurers captured 59%of the market by premium volume, which was a decrease of 3.25% from the prior fiscal year.Exhibit A1 illustrates the 2018 premium and market share data for each insurer group. ExhibitA2 lists the change in written premium for each insurer group by type of license from 2017 to2018. The small drop in written premium of these top two market share groups contributes to aslightly less concentrated market and confirms that competition exists in the market.Exhibit A3 is a pie chart showing the 2018 market share of the top nine (9) admittedinsurers and a pie chart of the top nine (9) insurers including surplus lines insurers and riskretention groups. Exhibit A4 shows the change in market share of the current top five (5)insurers over the period from 2005 – 2018. MMLIS’ share of the market was 30%, a decrease of4% from last year while MCIC’s share of the market increased to 29%. This activity is acontinuation of a trend over the past 6 years where it appears that MCIC continues to makeinroads into the market share of MMLIS. The total market share of the top two (2) insurergroups remains high at 59% of the market, and continues to be stable.MEDICAL MALPRACTICE INSURANCE PREMIUMS IN MARYLANDIn response to an increase in medical malpractice insurance premium rates between 2001and 2005, the General Assembly created the Maryland Health Care Provider Rate StabilizationFund (“Fund”). Insurance Article, Section 19-802 of the Annotated Code of Marylandestablished the Fund, effective April 1, 2005.3The Fund subsidized medical malpracticeinsurance premiums paid by eligible health care providers to admitted insurers that elected toparticipate in the program through calendar year 2008.1Refer to MIA’s Comparison Guide to Medical Professional Liability Insurance Rates (“Comparison Guide”) for adetailed listing of insurers and premiums across the State.2See Chapter 544, Section 1, Laws of Maryland, 1975.3The Fund consists primarily of revenues generated by annual premium tax imposed on health maintenanceorganizations and managed care organizations pursuant to § 6-102 of the Insurance Article.2
Exhibit A5 shows the history of MMLIS’ rate changes from 2003 through 2019. Of noteis that the sole rate increase since 2009 was 4% in 2012. MMLIS’ rates effective January 1,2018 dropped 2% and its most recent rate filing, effective January 1, 2019, reflects a decrease of4.4%. The rates of MMLIS, the State’s largest writer of medical malpractice insurance bypremium volume, have remained stable since 2006.Medical malpractice insurance premiums vary by specialty, policy limits and practicelocation. Exhibits B through G provide premium comparisons for twenty (20) differentspecialties utilizing a base premium for policy limits of 1MM per incident / 3MM annualaggregate for the years 2016 – 2019. Although the premium rates may differ among companieswithin a specialty, these Exhibits indicate stability in medical malpractice insurance premiumsduring this time period.Exhibits B through G also highlight the differences in premiums among insurers. Toassist providers in comparing medical malpractice insurance premiums, the MIA publishes theComparison Guide to Maryland Medical Professional Liability Insurance Rates (“ComparisonGuide”) on an annual basis. The Comparison Guide is available on the MIA’s website(www.insurance.maryland.gov) using the following The Comparison Guide compares general pricing among the major admitted insurers, surpluslines insurers and risk retention groups offering medical malpractice insurance in Maryland.By law, medical malpractice insurers are required to offer policies with high deductibleoptions of 25,000, 50,000 and 100,000.4 Exhibits H and I illustrate that high deductibleoptions are not popular among providers. Although policies having a deductible of less than 25,000 are sold, liability insurance policies, including medical malpractice insurance policies,are routinely issued with no deductible.CLOSED CLAIMSOne factor affecting medical malpractice insurance premium rates is the number ofclaims filed, also known as claim frequency. Admitted insurers are required to submit certainclosed claim information on a quarterly basis to the MIA. A claim is a demand for compensationarising from the alleged malpractice of a health care provider or facility. Exhibit J summarizesthe closed claim data provided to the MIA by insurer and Exhibit K summarizes the data byspecialty.4Insurance Article, § 19-114 of the Annotated Code of Maryland. This statute was amended in the 2019 legislativesession to limit this requirement to policies with annual premiums of 5,000 or more effective October 1, 2019.3
Between 20095 and 2013 closed claims generally increased among all insurer types(admitted, non-admitted and risk retention groups). The number of closed claims hit a peak foradmitted insurers 2013 at 957. The number of closed claims hit a peak for non-admitted insurersin 2012 at 425. The closed claim totals for 2018 were -47%and -20% off these peak totals foradmitted insurers and non-admitted insurers respectively.Exhibit L summarizes the number of lawsuits filed by jurisdiction and venue. Thenumber of lawsuits peaked in 2013 and decreased by 41% in 2014 and again by 7% in 2015. In2016, the number of lawsuits rose by 2% (22 lawsuits). For 2017, the number of lawsuitsincreased by 8 %, but was 30% below the peak year of 2014. For 2018, the number of lawsuitswas 869, which was a reduction of 6% from the previous year.CONCLUSIONThe MIA continues to monitor concentration, availability and affordability trends for thekey medical malpractice insurance market in Maryland. The market continues to be relativelystable but remains concentrated with 59% of the written premium acquired by two (2) insurers.Premium rates were stable or decreasing again this year across the market as a whole and withinthe two (2) largest market share insurers. The five (5) insurers that entered the market in 2016 –2017 acquired a collective market share of 1.45% and there are (2) insurers that entered themarket in 2017 - 2018.The stable rate environment and the continuing availability of coverage in the Marylandmarket are positive indicators for health care providers. Likewise, the closed claim and filedlawsuit numbers remain substantially below peak levels of 2012 – 2013. This should encouragepotential risk bearers that have previously declined to enter or expand their presence in theMaryland market during the previous times of less stability to take advantage of growthopportunities within the State.5In 2005, the MIA used one form of on-line reporting, but that tool became unworkable. Since 2009, the data hasbeen collected using a different tool that enables the MIA to access and query the data more easily. This change insystems may have resulted in a change in data collection.4
EXHIBIT LISTExhibit A12017 Medical Professional Liability Premiums by Insurance GroupExhibit A2Change in Written Premium by Insurance Group by Type of Licensefrom 2016 to 2017Exhibit A32017 Market Share of the Nine Largest Admitted Carriers2017 Market Share of the Top Nine Carriers (Including Surplus Linesand RRG's)Exhibit A4 - Page 1 Market Share of the Top Carriers from 2003 to 2017 (Based on 2017Market Share)Exhibit A4 - Page 2 Industry and MMLIS Written Premiums (in Millions) from 2003 to2017 Includes Surplus Lines and RRG's Change in Written Premiumfrom the Prior Year for the Industry and MMLISExhibit A4 - Page 3 Market Share by License Type from 2003 to 2017Exhibit A5Medical Mutual Rate Change History from 2003 to 2019Exhibit BRate Comparison Charts for Certain Physician Classes from 2015 to2018Exhibit CRate Comparison Charts for Certain Surgeon Classes from 2015 to2018Exhibit DRate Comparison Charts for Psychiatrist (Including Child) Classfrom 2015 to 2018Exhibit ERate Comparison Charts for Certain Nursing Classes from 2015 to2018Exhibit FRate Comparison Charts for Physical Therapists (Employed) from2015 to 2018Exhibit GRate Comparison Charts for Dentist Class from 2015 to 2018Exhibit HNumber of Admitted Policies with Deductible Amounts Mandatedunder Section 19-114 of the Insurance ArticleExhibit INumber of Policies with All Other Types of Deductibles, IncludingSurplus Lines PoliciesExhibit JClosed Claim Counts by Company from 2005 to 20175
Exhibit KNumber of Closed Claims by Specialty from 2005 to 2017Exhibit LNumber of Suits Filed by Jurisdiction and Venue from 2005 to 20176
EXHIBIT LISTExhibit A12018 Medical Professional Liability Premiums by Insurance GroupExhibit A2Change in Written Premium by Insurance Group by Type of Licensefrom 2017 to 2018Exhibit A32018 Market Share of the Nine Largest Admitted Carriers2018 Market Share of the Top Nine Carriers (Including Surplus Lines and RRG's)Exhibit A4 - Page 1Market Share of the Top Carriers from 2005 to 2018 (Based on 2018 Market Share)Exhibit A4 - Page 2Industry and MMLIS Written Premiums (in Millions) from 2005 to 2018Includes Surplus Lines and RRG'sChange in Written Premium from the Prior Year for the Industry and MMLISExhibit A4 - Page 3Market Share by License Type from 2005 to 2018Exhibit A5Medical Mutual Rate Change History from 2003 to 2019Exhibit BRate Comparison Charts for Certain Physician Classes from 2016 to 2019Exhibit CRate Comparison Charts for Certain Surgeon Classes from 2016 to 2019Exhibit DRate Comparison Charts for Psychiatrist (Including Child) Class from 2016 to 2019Exhibit ERate Comparison Charts for Nursing Practitioner Class from 2016 to 2019Exhibit E1Rate Comparison Charts for Nursing Anesthetist Class from 2016 to 2019Exhibit FRate Comparison Charts for Physical Therapists (Employed) from 2016 to 2019Exhibit GRate Comparison Charts for Dentist Class from 2016 to 2019Exhibit HNumber of Admitted Policies with Deductible Amounts Mandated underSection 19-114 of the Insurance ArticleExhibit INumber of Policies with All Other Types of Deductibles, IncludingSurplus Lines PoliciesExhibit JClosed Claim Counts by Company from 2005 to 2018Exhibit KNumber of Closed Claims by Specialty from 2005 to 2018Exhibit LNumber of Suits Filed by Jurisdiction and Venue from 2005 to 2018
Exhibit A1Page 12018 Medical Professional Liability Premium by Insurance 1584904347878500263802127830882018 Group NameMEDICAL INS OF MD GRPMCIC VT A RECIP RRGDOCTORS CO GRPBERKSHIRE HATHAWAY GRPPROASSURANCE CORP GRPCNA INS GRPNORCAL GRPLIBERTY MUT GRPASPEN INS HOLDING GRPCOVERYS GRPSWISS RE GRPALLEGHANY GRPCONNECTICUT MEDICAL GRPCHUBB LTD GRPENSTAR GRPTEXAS MEDICAL LIAB TRUST GRPMEDICAL INS GRPWR BERKLEY CORP GRPNATIONAL GRPAMERICAN INTL GRPFAIRFAX FIN GRPINTACT FINANCIAL GRPHALLMARK FIN SERV GRPMARKEL CORP GRPOPHTHALMIC MUT INS CO RRGTHE MUTUAL RRG INCNCMIC GRPCARING COMMUNITIES RECIP RRGZURICH INS GRPRLI INS GRPKINSALE INS COTHE HANOVER INS 4%0.30%0.26%0.19%0.16%0.16%0.15%2018 ,543,6412018 ,749,4622018 50,898738,3809,244556,991468,531456,018432,845
Exhibit A1Page 22018 Medical Professional Liability Premium by Insurance 94642440341600349479648510413007755100003611760000 *4570438100002018 Group NameARCH INS GRPPHYSICIANS INS A MUT GRPCINCINNATI FIN GRPALLIED PROFESSIONALS INS CO RRGAXIS CAPITAL GRPAMERICAN ASSOC OF OTHODONTISTS RRGAPPLIED MEDICO LEGAL SOLUTIONS RRGJAMES RIVER GRPQBE INS GRPCHURCH MUT GRPPEACE CHURCH RRG INCMAG MUT INS GRPCONTINUING CARE RRG INCPOSITIVE PHYSICIANS INS EXCHPHARMACISTS MUT GRPNAVIGATORS GRPSUNLAND RRG INCLANCET IND RRG INCHEALTH CARE INDUSTRY LIAB RECIP INSMUNICH RE GRPSTATE FARM GRPCARE RRG INCPHYSICIANS CAS RRG INCGREEN HILLS INS CO RRGGRAPH INS CO A RRG LLCARGONAUT GRPACADEMIC MEDICAL PROFESSIONALS INS EHOUSTON INTL INS GRPAFFILIATES INS RECIP A RRGVIRGINIA PHYSICIANS RRG INCFRANKLIN CAS INS CO RRGWELLSPAN 00%0.00%2018 AdmittedPremium2018 SurplusLinesPremiums414,140292,74210,4952018 007,000
Exhibit A1Page 32018 Medical Professional Liability Premium by Insurance Group2018PremiumRank656667682018GroupCode0 *0030982018InsuranceGroupPremium2,963950514-32018 Group NameBEAZLEY INS CO INCAMERICAN EXCESS INS EXCH RRGORTHOFORUM INS CO RRGTOKIO MARINE HOLDINGS INC GRPIndustry 0%2018 AdmittedPremium2,963The following companies had premium in 2017, but not in 2018:84AMERICAN FINANCIAL GRP1285XL AMER GRP**This group was purchased by AXA (Group Code 968), butapparently the MPL business was not carried over to AXA.The following companies are in either receivership or have been liquidated:0CAPSON PHYSICIANS INS CO2018 RRGPremium950514-3144,299,47249.61%* - Indicates company is new from 2017 to 2018OR there is a new company within the group.The following companies/groups merged with groups listed above:866WESTERN WORLD GRP2018 SurplusLinesPremiumsWith AIG - Rank 2046,037,17815.83%95,983,65033.00%
Change in Written Premium by Insurance Group by Type of License from 2017 to 584904347878500263802127830882018 Group NameMEDICAL INS OF MD GRPMCIC VT A RECIP RRGDOCTORS CO GRPBERKSHIRE HATHAWAY GRPPROASSURANCE CORP GRPCNA INS GRPNORCAL GRPLIBERTY MUT GRPASPEN INS HOLDING GRPCOVERYS GRPSWISS RE GRPALLEGHANY GRPCONNECTICUT MEDICAL GRPCHUBB LTD GRPENSTAR GRPTEXAS MEDICAL LIAB TRUST GRPMEDICAL INS GRPWR BERKLEY CORP GRPNATIONAL GRPAMERICAN INTL GRPFAIRFAX FIN GRPINTACT FINANCIAL GRPHALLMARK FIN SERV GRPMARKEL CORP GRPOPHTHALMIC MUT INS CO RRGTHE MUTUAL RRG INCNCMIC GRPCARING COMMUNITIES RECIP RRGZURICH INS GRPRLI INS GRPKINSALE INS COTHE HANOVER INS GRP2018 9%16.2%-39.0%-55.0%-0.1%23.3%Exhibit A2Page 26Admitted Surplus LinesPremiumPremium RRG 16.2%n/a0n/an/a-55.0%n/an/a0n/a33.4%23.1%n/a
Change in Written Premium by Insurance Group by Type of License from 2017 to 57043810000*2018 Group NameARCH INS GRPPHYSICIANS INS A MUT GRPCINCINNATI FIN GRPALLIED PROFESSIONALS INS CO RRGAXIS CAPITAL GRPAMERICAN ASSOC OF OTHODONTISTS RRGAPPLIED MEDICO LEGAL SOLUTIONS RRGJAMES RIVER GRPQBE INS GRPCHURCH MUT GRPPEACE CHURCH RRG INCMAG MUT INS GRPCONTINUING CARE RRG INCPOSITIVE PHYSICIANS INS EXCHPHARMACISTS MUT GRPNAVIGATORS GRPSUNLAND RRG INCLANCET IND RRG INCHEALTH CARE INDUSTRY LIAB RECIP INSMUNICH RE GRPSTATE FARM GRPCARE RRG INCPHYSICIANS CAS RRG INCGREEN HILLS INS CO RRGGRAPH INS CO A RRG LLCARGONAUT GRPACADEMIC MEDICAL PROFESSIONALS INS EHOUSTON INTL INS GRPAFFILIATES INS RECIP A RRGVIRGINIA PHYSICIANS RRG INCFRANKLIN CAS INS CO RRGWELLSPAN RRG2018 12.5%Exhibit A2Page 27Admitted Surplus LinesPremiumPremium RRG /a0.0%n/an/a0n/an/a-12.5%
Exhibit A2Page 28Change in Written Premium by Insurance Group by Type of License from 2017 to 18 Group NameBEAZLEY INS CO INCAMERICAN EXCESS INS EXCH RRGORTHOFORUM INS CO RRGTOKIO MARINE HOLDINGS INC GRP2018 .0%-99.8%-400.0%286,320,811-1.6%Industry Totals* - Indicates company is new from 2017 to 2018OR there is a new company within the group.The following companies/groups merged with groups listed above:866WESTERN WORLD GRPWith AIG - Rank 20The following companies had premium in 2017, but not in 2018:84AMERICAN FINANCIAL GRP1285XL AMER GRP**This group was purchased by AXA (Group Code 968), butapparently the MPL business was not carried over to AXA.The following companies are in either receivership or have been liquidated:0CAPSON PHYSICIANS INS COAdmitted Surplus LinesPremiumPremium RRG .4%32.0%3.4%
Exhibit A32018 Market Share of the Nine Largest Admitted Carriers1.3%1.4%MEDICAL INS OF MD GRP5.1%1.7%DOCTORS CO GRP2.7%PROASSURANCE CORP GRP3.5%BERKSHIRE HATHAWAY GRP4.9%CNA INS GRPMEDICAL INS GRP7.5%COVERYS GRPNORCAL GRP12.9%59.1%ALLEGHANY GRPREMAINING2018 Market Share of the Top Nine Carriers (Including Surplus Lines and RRG's)MEDICAL INS OF MD GRP14.6%1.4%MCIC VT A RECIP RRG1.9%29.8%2.0%DOCTORS CO GRPBERKSHIRE HATHAWAY GRP2.9%PROASSURANCE CORP GRP5.0%CNA INS GRP5.3%NORCAL GRPLIBERTY MUT GRP8.1%ASPEN INS HOLDING GRP28.9%REMAINING
Exhibit A4Page 1Market Share of the Top Carriers from 2005 to 2018 (Based on 2018 Market S 46.4% 44.1% 43.2% 42.3% 42.1% 43.6% 43.5% 44.6% 47.7% 41.2% 38.2% 36.3% 34.0% 29.8%MCIC17.8% 19.5% 18.4% 20.4% 21.1% 18.0% 16.6% 16.1% 11.6% 19.1% 22.8% 26.3% 28.2% 28.9%Doctors 7.5% 7.8% 8.5% 8.9% 7.8% 8.1% 8.1% 7.7% 8.9% 8.3% 7.8% 7.8% 8.3% 8.1%PRAIC 4.2% 4.1% 4.8% 4.2% 5.4% 4.2% 3.8% 4.0% 5.2% 6.3% 6.4% 4.2% 4.2% 5.0%MedPro 5.4% 5.8% 5.1% 6.1% 5.1% 4.3% 4.1% 4.2% 3.9% 3.2% 3.8% 3.4% 4.3% 5.3%The four carriers listed above are the four of the five largest carriers based on 2016 market share. This does not imply that they are thetop 4 of 5 carriers for the entire time period shown above.MMLIS - Medical Mutual GroupMCIC - MCIC RRG VermontDoctors - The Doctors CompanyMedPro - Medical Protective Insurance Company (member of the Berkshore/Hathaway Group)PRAIC - ProAssurance Group
Exhibit A4Page 2Industry and MMLIS Written Premiums (in Millions) from 2005 to 2018Includes Surplus Lines and 7%-14.0%Change in Written Premium from the Prior Year for the Industry and 15.0%-20.0%2005Industry 11.4%MMLIS .7%
Exhibit A4Page 3Market Share by License Type from .0%2005 2006 2007 2008 2009 2010 2011 2012 2013 2014 2015 2016 2017 2018Admitted 69.5% 68.7% 70.7% 68.7% 67.1% 67.3% 67.1% 67.9% 73.5% 66.5% 63.4% 59.6% 56.0% 49.6%Surplus 11.3% 10.2% 9.3% 9.3% 10.0% 12.3% 13.8% 13.4% 11.2% 11.4% 11.2% 10.3% 12.0% 15.8%RRG19.3% 21.0% 20.0% 22.0% 23.0% 20.4% 19.1% 18.7% 15.3% 22.1% 25.4% 30.1% 32.0% 33.0%Other0.0% 0.0% 0.0% 0.0% 0.0% 0.0% 0.0% 0.0% 0.0% 0.0% 0.0% 0.0% 0.0% 0.0%Other License type includes carriers that no longer write medical professional liability and license type cannot, asof the last year of writing business, be determined. This also includes carriers that were in runoffor with license suspended/revoked.
Exhibit A5Medical Mutual Rate Change History from 2003 to .0%-4.4%-5.0%-10.0%200320042005Rate Change 10.3% 28.0% 33.0%-8.0% 0.0%2018-2.0%The above reflects the effective rate change per year. All rate changes are effective on January 1st of each year.For ease of viewing, we have limited the exhibit to the period from 2003 to the present. Data for years 1996through 2002 can be found in the 2017 Annual Report.2019-4.4%
Notes for Rate Comparison Charts (Exhibits B through G)The company names have been abbreviated on the charts for readability purposes.Name onChartsMMLISFull Company NameMedical Mutual Liability Insurance Society of MarylandExhibitsB to FProAdProfessional Advocates Insurance Company (1)GMedProMedical Protective Insurance CompanyAllTDCThe Doctors CompanyB to E, GPRAICProAssurance Indemnity CompanyAllPPICPreferred Professional Insurance CompanyAllNORCALNORCAL Mutual Insurance CompanyB to FMagMutMAG Mutual Insurance CompanyB, C & DProselectProSelect Insurance CompanyB, C, D & EFAIRCOFair American Insurance and Reinsurance CompanyDAspenAspen Insurance CompanyB, C & DMMICNCMedical Mutual Insurance Company of North CarolinaB, C, D, E, FPPIEPositive Physicians Insurance ExchangeB, C, D, E, FMDANJMD Advantage Insurance Company of New JerseyB, C, E, F, GCampmedCampmed Casualty and Indemnity CompanyB, D, E, FAWACAllied World Specialty Insurance CompanyD&FAIGNational Union Fire Insurance Company of PittsburghD&G
Notes for Rate Comparison Charts (Exhibits B through G)The company names have been abbreviated on the charts for readability purposes.Name onChartsCNAFull Company NameAmerican Casualty Co of Reading, PAContinental Insurance CompanyExhibitsEGACEUSAACE American Insurance CompanyE&FBHSICBerkshire Hathaway Specialty Insurance CompanyE&FHudsonHudson Insurance CompanyELibertyIULiberty Insurance UnderwritersE, F & GFortressFortress Insurance CompanyGPSICProfessional Solutions Insurance CompanyGCinfinCincinnati Insurance CompanyG(1) - Member of the Medical Mutual Liability Insurance Society GroupNotes to Charts1) Percentage change only shown if company had rates for the entire period 2014 to 2017.
Exhibit BPage 1Fam/Gen Prac (No OB) - Minor SurgeryBaltimore City & Baltimore 9,22228,43931,61831,690%
medical malpractice insurance to practitioners in Maryland is a vital and necessary component of Maryland's health care system. In 2002 and 2003, rapid and substantial increase in medical malpractice insurance premiums threatened to weaken access to high-quality health care in Maryland. The General Assembly