Transcription
A Robert Wood Johnson Foundation program2016 County Health RankingsKey Findings ReportSupportprovided byA collaboration between the Robert Wood Johnson Foundation andthe University of Wisconsin Population Health Institute.
INTRODUCTIONThe County Health Rankings & Roadmaps program helpscommunities identify and implement solutions that make iteasier for people to be healthy in their neighborhoods, schools,and workplaces. Ranking the health of nearly every countyin the nation, the County Health Rankings illustrate what weknow when it comes to what is keeping people healthy ormaking people sick. The Roadmaps show what we can do tocreate healthier places to live, learn, work, and play. The RobertWood Johnson Foundation collaborates with the University ofWisconsin Population Health Institute to bring this program tocommunities across the nation.Now in its seventh year, the County Health Rankings continueto bring revealing data to US counties. This report offers keyfindings from this year’s Rankings release and includes answersto the following questions:A. How Does Health Vary Across Rural and Urban Counties?(page 2)B. How Do Health Gaps Among Counties Differ by State?(page 4)C. What Are the New Measures of Each County’s Health?(page 6)Supporting materials (such as detailed data tables) are availableat www.countyhealthrankings.org/reports.Summary of Key Findingso Rural counties have had the highest rates of premature deathfor many years, lagging far behind other counties. Whileurban counties continue to show improvement, prematuredeath rates are worsening in rural counties.o Looking solely at state averages for the factors that influencehealth masks the significant gaps in health that exist betweencounties within each state. Three new measures are highlighted:–– Residential segregation of blacks and whites is afundamental cause of health disparities in the US.Black/white residential segregation is highest in theNortheast and Great Lakes region and lowest along theSoutheastern seaboard.–– The rate of deaths due to drug overdoses has increased79 percent since 2002. Drug overdose deaths arehighest in Northern Appalachia and in parts of the West/Southwest, and lowest in the Northeast. Compared withother types of counties, rural counties have higher ratesof drug overdose deaths.–– Sleep is an important part of a healthy lifestyle.Insufficient sleep can have serious negative effects onhealth. On average, about one third of adults reportgetting insufficient sleep (less than 7 hours a night onaverage). In some counties, almost one in two residentsreport insufficient sleep.ABOUT THE COUNTY HEALTH RANKINGSWe compile the Rankings using county-level measures froma variety of national data sources, which can be found onpage 8. These measures are standardized and combinedusing scientifically-informed weights. We then rank countieswithin each state, providing two overall ranks that addresstwo key questions:County Health Rankings Model1. Health outcomes: how healthy are residents in a county now?2. Health factors: how healthy will residents be in the future?The Rankings are based on a model of population health(see right) that emphasizes the many factors that, if improved,can help make communities healthier. We report these ranksat countyhealthrankings.org, along with all the underlyingmeasures and additional data for this year and prior years. Wealso provide tools to help communities use their data to takeaction toward improving their health.DO THE 2016 COUNTY HEALTH RANKINGS INCLUDEDATA COLLECTED IN 2016?We use the most recent data available for each measure. Theyear(s) represented varies from measure to measure, dependingon the data available at the time of release. For example, whenwe released the 2010 Rankings, the most recent data availablefor premature death was for 2004-2006. For the 2016 Rankings,the most recent data available for this same measure was for2011-2013. The data sources and years for each measure arelisted on pages 8-9.1
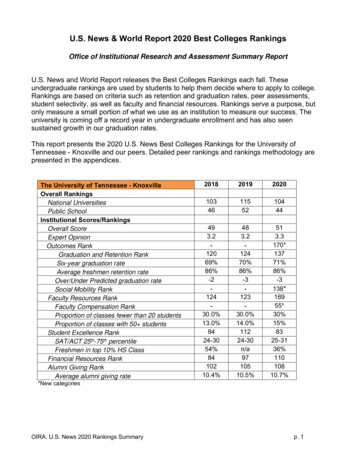
HOW DOES HEALTH VARY ACROSSRURAL AND URBAN COUNTIES?Ranking counties within states often leads to questions about how health outcomes and health factors vary across states.For a closer look at health by county type and size, we separated counties into the following of Counties68LargeUrbanMetroCentral urban corecounties within anMSA with more than1 million people96 mLargeSuburbanMetroNon-central fringecounties within anMSA with more than1 million people77 mSmallerMetroCounties within anMSA with between50,000 and 1 millionpeople94 mNon-metropolitanrural counties withless than 50,000people46 mRuralPremature Death Trends by Level of UrbanizationYears of potential life lost under age 75 per 100,000 001,9745,000Adapted from the National Center for Health Statistics’ urban-rural classification basedon Metropolitan Statistical Area (MSA) designations.1997– 1999– 2001– 2003– 2005– 2007– 2009– 2011–1999 2001 2003 2005 2007 2009 20112013Counties with Improving or Worsening PrematureDeath Rates, 1999-20131Percent of countiesCounties Categorized By Level of vingLarge UrbanMetroKey FindingsLarge UrbanLarge SuburbanSmaller MetroRuralAlthough we use the terms Large Urban, Large Suburban,Smaller Metro, and Rural to classify entire counties, there maybe urban, suburban, or rural areas within any county. LargeUrban counties can include suburbs as well as city centers.Large Suburban counties may also include rural areas. Thesecharacteristics should be taken into consideration whenlooking more closely at individual ral Rural counties have consistently had the highest prematuredeath rates and, following a few years of improvement,overall rates of premature death are increasing. Nearly one in five Rural counties has experiencedworsening premature death rates over the past decade. Large Urban counties have seen the greatest declines inpremature death rates since the late 1990s. Unlike other types of counties, nearly all Large Urbancounties have consistently shown improved prematuredeath rates. There is no single factor that explains the significantdifferences in health between Rural and other typesof counties.There were no Major Urban counties with worsening rates. Totals do not sum to 100%because death rates stayed the same in some counties.12
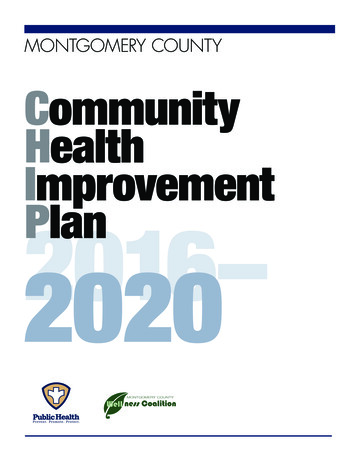
Key Health Factors by Levelof UrbanizationLarge UrbanLarge SuburbanSmaller MetroRuralAs the County Health Rankings model (see page 1) shows, there are many things that influence health outcomes including healthbehaviors, clinical care, social and economic factors, and the physical environment. Here we show differences across the fourtypes of counties for selected measures within each of these groups of health factors. Looking at Adult Smoking, for example, wefind that Large Urban counties have the best (lowest) rates of adult smoking while Rural counties have the worst (highest) rates.However, no single factor alone explains the significant differences in health between Rural and other types of counties.Health BehaviorsBESTWORSTAdult Smoking16%17%18%19%20%Adult Obesity25%26%27%28%29%30%31%32%Teen Births (per 1,000)25Clinical Care3035404550BESTWORSTUninsuredPreventable Hospital Stays(per 1,000 Medicare enrollees)14%15%16%17%18%19%455055606570Social & Economic Factors BESTWORSTSome College70%65%60%55%50%Children in Poverty16%18%20%22%24%26%175275375475575675Violent Crime (per 100,000)Injury Deaths (per 100,000)55Physical Environment606570758085BEST90WORSTLong Commute—Drive Alone25%30%35%40%45%3
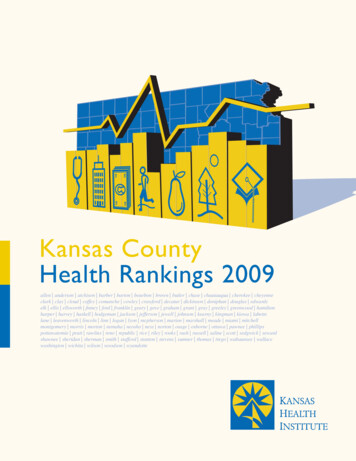
HOW DO HEALTH GAPS BETWEEN COUNTIESDIFFER BY STATE?Our country has achieved significant health improvements, driven by progress in automobilesafety, better workplace standards, reductions in smoking and infectious diseases, and a hostof other advances. But when we take a closer look at this progress, we see that it is uneven. It isclear that not everyone in the US has a fair opportunity to be healthy.In 2015, County Health Rankings released a set of 50 Health Gaps Reports showing thatopportunities for health differ considerably within states. These health gaps exist acrossneighboring county lines, or within a community among various groups, such as by race,ethnicity, age, income, education, or sexual orientation. To build a Culture of Health for everyone,it’s important to begin closing these gaps. Along with snapshots of the differences amongcounties within states, the reports offer strategies to help do so. To learn more about Health Gapsreports, visit countyhealthrankings.org/reports.Below we build on the Health Gaps Reports by taking a closer look at the size of the health gapswithin states for three selected measures: adult obesity, the uninsured, and children in poverty(gaps for other measures as well as the underlying data for all measures are available online). Each circle on the maps represents a state. The color shading of each circle shows how well each state is doing overall (state average).States with less shading are doing better overall. States with deeper shading are doing worse. The size of each circle shows how wide the gap is within the state (state gap). Smaller circlesrepresent a smaller gap between the counties with the best and worst values.2 Larger circlesrepresent larger gaps.So, small and lightly shaded circles represent the states with the best performance overall andthe smallest gap between counties. For example, the adult obesity map below shows that NewJersey has one of the best rates of obesity (lightly shaded circle) and has a relatively small gapin obesity rates between its counties (smaller circle). Alabama, by contrast, has one of the worstrates of obesity (deeply shaded red circle), and a very wide gap in obesity rates between itscounties (larger circle).STATEAVERAGESTATEGAPBest 20%(lowest avgs)Best(smallest gap)Worst 20%(highest avgs)Worst(largest gap)Adult Obesity: State Average and AFLLARGEST GAPS1. Florida2. Arizona3. Alabama4. New Mexico5. South CarolinaIn calculating the size of the gaps for each state, we calculated the difference between the best and worst county values for each measure. The best and worst values were representedby the top and bottom 10% of county-level values for a given measure.24
Uninsured: State Average and GEST GAPSLA1. Alaska2. Montana3. Texas4. Florida5. ColoradoFLAKChild Poverty: State Average and ARGEST GAPSLAFL1. South Dakota2. Alabama3. Mississippi4. Georgia5. VirginiaTo learn more about how states and local communities can take action to reduce these gaps, visit What Works for Health -health, which includes a wide variety of evidence-informed policies,programs, and system changes to improve health for all.5
WHAT ARE THE NEW MEASURES OF EACHCOUNTY’S HEALTH?The Rankings are calculated using 35 measures (5 health outcomes and 30 health factors). There are additional measures thatare not included in county ranks because some measures, like demographics, provide good contextual information but do notlend themselves to ranking. Other measures are not available for a majority of counties, but also provide helpful context forunderstanding a county’s opportunities for improving health. We highlight three of the new additional measures for 2016 below.Residential SegregationResidential segregation refers to the degree to which two ormore groups live separately from one another in a geographicarea. Residential segregation of blacks and whites is consideredto be a fundamental cause of health disparities in the US andhas been linked to poor health outcomes including greaterinfant and adult mortality, and a wide variety of reproductive,infectious, and chronic diseases. Although most overtlydiscriminatory policies and practices promoting segregation,such as separate schools or seating on public transportationor in restaurants based on race have been illegal fordecades, segregation caused by structural, institutional, andinterpersonal racism still exists in many parts of the country.Segregation continues to have lasting implications for bothpersonal and community well-being.No single strategy can lessen the potential negative healthimpacts of residential segregation. Rather, a range of policies,programs, and systems changes, such as affordable housingdevelopment incentives, better enforcement of fair housingpolicies, and public transit system expansion to connectneighborhoods and resources are good examples of ways toaddress the differences in housing and environmental quality,as well as economic and educational opportunities that exist inmany segregated neighborhoods.Key Findings Black/white residential segregation values are highest inthe Northeast and Great Lakes region and lowest along theSoutheastern seaboard. Among counties in the US, the average black/whiteresidential segregation value is 46. The best performing counties have black/white residentialsegregation index values of less than 23. The worst performing counties have black/white residentialsegregation values of at least 67 or higher, meaning thatat least 67 percent of either blacks or whites would haveto move into other census tracts to create an evenlydistributed residential population.Residential segregation-black/white;0 complete integration, 100 complete segregation01530456070UNDERSTANDING THE MEASUREThe makeup of local populations varies across the US and so we provideboth black/white and non-white/white residential segregation data atcountyhealthrankings.org. For example, in Nevada or Idaho (which both haverelatively smaller black populations compared to other states), it might bemore helpful to look at non-white/white segregation, rather than black/whitesegregation. It is also important to consider that for some population groups,such as new immigrants, living among others who share their cultural beliefsand practices can help build social connections that can lessen the health risksof hardship and neighborhood disadvantage.To measure residential segregation, we use data that show the evenness with which two groups (i.e. blacksand whites) are distributed within census tracts across counties. The index score is the percentage of oneof the two groups that would have to move to different census tracts in order to produce a distribution thatmatches that of the county.36The black/white residential segregationindex3 can range from zero (completeintegration) to 100 (completesegregation). Anything above 60represents extremely high segregation.The black/white residential segregationmeasure is only available for countieswith a black population of at least 100.Thirty-five percent of US counties(shaded in gray) have a black populationof less than 100 people and are thereforenot provided with black/white residentialsegregation data. 90
Drug Overdose DeathsThe US is experiencing an epidemic of drug overdose deaths.Since 2002, the rate of drug overdose deaths has increased by79 percent nationwide, with a 200 percent increase in deathsinvolving opioids (opioid pain relievers and heroin) since2000. Drug overdose deaths are the number of deaths dueto drug overdose or poisoning per 100,000 population. Thesedeaths include unintentional, intentional, and undeterminedpoisoning by and exposure to either prescription, over-thecounter, or illegal drugs.Key Findings Among counties in the US, the average rate of drug overdosedeaths is 13 per 100,000 people. Nine percent of counties have drug overdose rates of 6 per100,000 or lower. Sixteen percent of counties have drug overdose death ratesabove 20 per 100,000 with some counties having rates ashigh as 85 per 100,000. Drug overdose deaths appear highest in Northern Appalachiaand in parts of the West/Southwest, lowest in the Northeast,and higher in rural counties than in other types of counties.Drug overdose deaths /100,000 population cient SleepSleep is an important part of a healthy lifestyle. Sleep plays akey role in maintaining proper growth and repair of the body,learning, memory, emotional resilience, problem solving, decisionmaking, and emotional control. A lack of sleep can have seriousnegative effects on health. Ongoing sleep deficiency has beenlinked to chronic health conditions including heart disease, kidneydisease, high blood pressure, and stroke, and psychiatric disorderssuch as depression and anxiety, risky behavior, and even suicide.And a lack of sleep cannot only affect people’s own health, butalso the health of others. Sleepiness, especiallywhile driving, can lead to motor vehicle crashesand put the lives of others in jeopardy. Ourmeasure of insufficient sleep is the percentage ofadults who report getting fewer than 7 hours ofsleep per night on average.Key Findings Among counties in the US, on average, 33% of adults do notget enough sleep. The rate of insufficient sleep in US counties ranges from 23percent to 47 percent. Rates of insufficient sleep appear highest in Southeastern USand lowest in the Plains states. There are no significant differences among rates ofinsufficient sleep by urban/rural county type.Percent of adults reporting insufficient sleep20%30%40% 50%7
2016 County Health Rankings: Ranked Measure Sources and Years of DataMeasureSourceYears of DataLength of LifePremature deathNational Center for Health Statistics – Mortality files2011-2013Quality of LifePoor or fair healthBehavioral Risk Factor Surveillance System2014Poor physical health daysBehavioral Risk Factor Surveillance System2014Poor mental health daysBehavioral Risk Factor Surveillance System2014Low birthweightNational Center for Health Statistics – Natality files2007-2013Tobacco UseAdult smokingBehavioral Risk Factor Surveillance System2014Diet and ExerciseAdult obesityCDC Diabetes Interactive Atlas2012Food environment indexUSDA Food Environment Atlas, Map the Meal Gap2013Physical inactivityCDC Diabetes Interactive Atlas2012Access to exercise opportunitiesBusiness Analyst, Delorme map data, ESRI, & US CensusTigerline Files2010 & 2014Behavioral Risk Factor Surveillance System2014Alcohol-impaired driving deathsFatality Analysis Reporting System2010-2014Sexually transmitted infectionsNational Center for HIV/AIDS, Viral Hepatitis, STD,and TB Prevention2013Teen birthsNational Center for Health Statistics – Natality files2007-2013UninsuredSmall Area Health Insurance Estimates2013Primary care physiciansArea Health Resource File/American Medical Association2013DentistsArea Health Resource File/National Provider Identification file2014Mental health providersCMS, National Provider Identification file2015Preventable hospital staysDartmouth Atlas of Health Care2013Diabetic monitoringDartmouth Atlas of Health Care2013Mammography screeningDartmouth Atlas of Health Care2013High school graduationEDFacts2012-2013Some collegeAmerican Community Survey2010-2014EmploymentUnemploymentBureau of Labor Statistics2014IncomeChildren in povertySmall Area Income and Poverty Estimates2014Income inequalityAmerican Community Survey2010-2014Children in single-parenthouseholdsAmerican Community Survey2010-2014Social associationsCounty Business Patterns2013Violent crimeUniform Crime Reporting – FBI2010-2012Injury deathsCDC WONDER mortality data2009-2013HEALTH OUTCOMESHEALTH FACTORSHEALTH BEHAVIORSAlcohol and Drug Use Excessive drinkingSexual ActivityCLINICAL CAREAccess to CareQuality of CareSOCIAL AND ECONOMIC FACTORSEducationFamily and SocialSupportCommunity SafetyPHYSICAL ENVIRONMENTAir and Water Quality Air pollution – particulate matter 1 CDC WONDER environmental dataHousing and Transit1Not available for AK and HI.82011Drinking water violationsSafe Drinking Water Information SystemFY2013-14Severe housing problemsComprehensive Housing Affordability Strategy (CHAS) data2008-2012Driving alone to workAmerican Community Survey2010-2014Long commute – driving aloneAmerican Community Survey2010-2014
Additional Measures (Not Included in Calculation of Ranks)—Sources and Years of DataNote: New measures for 2016 are in bold.MeasureSourceYears of DataPremature age-adjusted mortalityCDC WONDER mortality data2011-2013Infant mortalityHealth Indicators Warehouse2006-2012Child mortalityCDC WONDER mortality data2010-2013Frequent physical distressBehavioral Risk Factor Surveillance System2014Frequent mental distressBehavioral Risk Factor Surveillance System2014Diabetes prevalenceCDC Diabetes Interactive Atlas2012HIV prevalenceNational HIV Surveillance System2012Food insecurityMap the Meal Gap2013Limited access to healthy foodsUSDA Food Environment Atlas2010Motor vehicle crash deathsCDC WONDER mortality data2007-2013Drug overdose deathsCDC WONDER mortality data2012-2014Drug overdose deaths – modeledNational Center for Health Statistics – cdc.data.gov2014Insufficient sleepBehavioral Risk Factor Surveillance System2014Uninsured adultsSmall Area Health Insurance Estimates2013Uninsured childrenSmall Area Health Insurance Estimates2013Health care costsDartmouth Atlas of Health Care2013Other primary care providersCMS, National Provider Identification file2015Median household incomeSmall Area Income and Poverty Estimates2014Children eligible for free lunchNational Center for Education Statistics2012-2013HomicidesCDC WONDER mortality data2007-2013Residential segregation – black/whiteAmerican Community Survey2010-2014Residential segregation – non-white/whiteAmerican Community Survey2010-2014PopulationCensus Population Estimates2014% below 18 years of ageCensus Population Estimates2014% 65 and olderCensus Population Estimates2014% Non-Hispanic African AmericanCensus Population Estimates2014% American Indian and Alaskan NativeCensus Population Estimates2014% AsianCensus Population Estimates2014% Native Hawaiian/Other Pacific IslanderCensus Population Estimates2014% HispanicCensus Population Estimates2014% Non-Hispanic whiteCensus Population Estimates2014% not proficient in EnglishAmerican Community Survey2010-2014% FemalesCensus Population Estimates2014% RuralCensus Population Estimates2010HEALTH OUTCOMESHEALTH FACTORSHealth BehaviorsClinical CareSocial and Economic FactorsDEMOGRAPHICS9
A Robert Wood Johnson Foundation programUniversity of Wisconsin Population Health Institute610 Walnut St, #524, Madison, WI 53726(608) 265-8240 / info@countyhealthrankings.orgCreditsLead authors: Bridget Catlin, PhD, MHSA; Amanda Jovaag, MS; Marjory Givens, PhD, MSPH; and Julie Willems Van Dijk, PhD, RNRecommended citation: University of Wisconsin Population Health Institute. County Health Rankings Key Findings 2016.This publication would not have been possible without the following contributions:Research AssistancePaige AndrewsKeith Gennuso, PhDKathryn HatchellHyojun Park, MAElizabeth PollockMatthew Rodock, MPHOutreach AssistanceMary Bennett, MFAMatthew CallMegan GarskeKitty Jerome, MAKate Konkle, MPHJan O’Neill, MPACommunications and Website DevelopmentBurnessForum OneData:Centers for Disease Control and Prevention: National Center for Health StatisticsDartmouth Institute for Health Policy & Clinical PracticeRobert Wood Johnson Foundation:Andrea Ducas, MPHMichelle Larkin, JD, MS, RNJames Marks, MD, MPHJoe MarxDwayne Proctor, PhDDonald Schwarz, MD, MPHAmy Slonim, PhDKathryn Wehr, MPHScientific Advisory Group:Patrick Remington, MD, MPH, ChairMaureen Bisognano, MSRenée Canady, PhD, MPABridget Catlin, MHSA, PhDMaggie Super Church, MSc, MCPAna Diez Roux, MD, PhDTom Eckstein, MBA Wayne Giles, MD, MSElizabeth Mitchell Ali Mokdad, PhDC. Tracy Orleans, PhD Steven Teutsch, MD, MPH10www.countyhealthrankings.org
Metro Central urban core counties within an MSA with more than 1 million people 96 m 68 Large Suburban Metro Non-central fringe counties within an MSA with more than 1 million people 77 m 368 Smaller Metro Counties within an MSA with between 50,000 and 1 million people 94 m 731 Rural Non-metropolitan rural counties with less than 50,000 people .