Transcription
Wisconsin2020 County Health Rankings Report
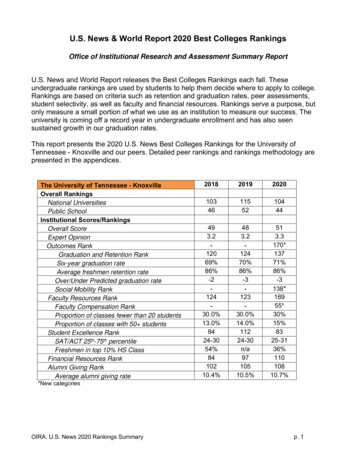
County Health Rankings 20202020 County Health Rankings for the 72 Ranked Counties in 955FlorenceFond du 40392125566264252241767625ForestGrantGreenGreen t. La shaWaupacaWaushara673541344348473743522954DunnEau 32654563WinnebagoWood42532318For more information on how these ranks are calculated, view the tables at the end of this report and visitwww.countyhealthrankings.orgStay Up-To-Date with CountyHealth Rankings & RoadmapsFor the latest updates on Rankings,What Works for Health, communitysupport, RWJF Culture of HealthPrize communities, Action LearningGuides, and more visitwww.countyhealthrankings.org. Youcan see what we’re featuring on ourwebinar series, what communitiesare doing to improve health, andhow you can get involved!Page 2 www.countyhealthrankings.org
County Health Rankings 2020The County Health Rankings & Roadmaps (CHR&R) lifts up actionable data, evidence, guidance, and stories for communities to makeit easier for people to be healthy in their neighborhoods, schools, and workplaces. Ranking the health of nearly every county in thenation (based on the model below), CHR&R illustrates what we currently know when it comes to what is keeping peoplehealthy or making them sick and shows what we can do to create healthier places to live, learn, work, and play.What are the County Health Rankings?Moving with Data to ActionPublished online at www.countyhealthrankings.org, theRankings help us understand what influences our healthand how long and well we live. The Rankings are unique intheir ability to provide measures of the current overallhealth of each county in all 50 states. They also look at avariety of measures that affect the future health ofcommunities, such as high school graduation rates, accessto healthy foods, rates of smoking, children in poverty,and teen births.The Take Action to Improve Health section of our websitehelps communities join together to look at the manyfactors influencing health, select strategies that work, andmake changes that can have a lasting impact. Take Actionto Improve Health is a hub for information to help anycommunity member or leader who wants to improvetheir community’s health and foster health equity. Youwill find:For the past 10 years, communities have used theRankings to garner support for local health improvementinitiatives by engaging government agencies, health careproviders, community organizations, business leaders,policymakers, and the public. What Works for Health, a searchable menu ofevidence-informed strategies that can make adifference locally;The Action Center, your home for step-by-stepguidance and tools to help you move with data toaction;Action Learning Guides, self-directed learningmodules combining guidance, tools, and hands-onpractice and reflection activities on specific topics;The Partner Center, information to help youidentify the right partners and explore tips toengage them.Ensuring Healthy Places for AllCommunities thrive when all people can be healthy intheir neighborhoods, schools, and workplaces. CHR&Rbrings actionable data and strategies to communitiesworking to ensure that healthy places are available to all.Pages 4 and 5 of this report highlights how healthoutcomes and health factors differ by place within yourstate. On pages 6 and 7, we illustrate how health differsamong racial/ethnic groups within places.The Robert Wood Johnson Foundation (RWJF) collaborates with the University of Wisconsin Population Health Institute (UWPHI) tobring this program to cities, counties, and states across the nation.Page 3 www.countyhealthrankings.org
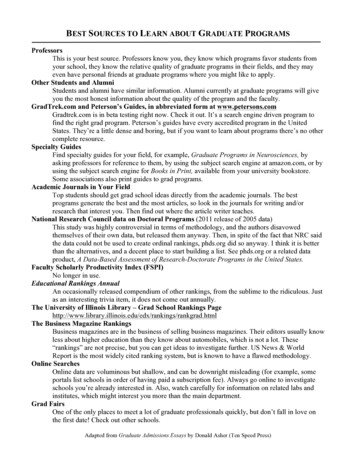
County Health Rankings 2020What are Health Outcomes?Everyone wants to experience long and healthy lives, yet places have different resources and opportunities. To understandthe health outcomes in a community, we measure both length and quality of life by county within Wisconsin.Length of LifeQuality of LifePremature deathSelf-reported health status(years of potential life lostbefore age 75)Percent of low birthweight newbornsHow Do Counties Rank for Health Outcomes?What Do Differences Between Ranks Mean?The green map shows the distribution of Wisconsin’shealth outcome ranks across counties. The map is dividedinto four quartiles with less color intensity indicating betterhealth outcomes in the respective summary rankings.Specific county ranks can be found in the table on page 2.Counties are ordered by the health outcome rank, with atop-ranked county (rank 1) having the best healthoutcome score. Ranks are easy to communicate, but theymask differences in health within counties and from oneranked county to the next. The chart next to the mapshows the spread of health outcome scores (ranks) foreach county (green circles) in Wisconsin. This graphicshows the size of the gap between ranked counties. Thedifferent background colors correspond to the fourquartiles used in the map.Detailed information on the measures and their associatedweights is available on page 9. You can also learn abouthow we calculate health outcome ranks atwww.countyhealthrankings.org.Figure 1. Health outcome ranks displayed using quartiles (map) and underlying health outcome scores (chart)Page 4 www.countyhealthrankings.org
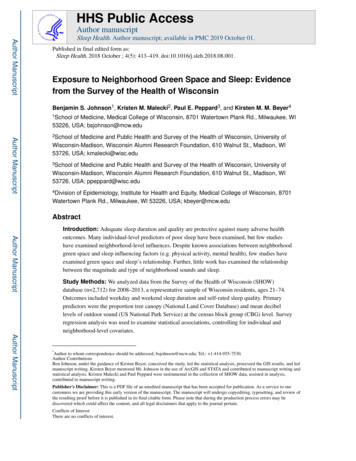
County Health Rankings 2020What are Health Factors?Many factors shape our opportunities to be healthy and influence how well and how long we live. Health factors representthe things we can change to improve health for all, like opportunities for quality education, good paying jobs, access toquality clinical care, healthy foods, green spaces, and secure and affordable housing. We measure four health factor areas.Health BehaviorsTobacco useDiet & exerciseAlcohol & drug useSexual activityClinical CareAccess to careQuality of careSocial and EconomicFactorsEducationEmployment & incomeFamily & social supportCommunity safetyPhysical EnvironmentAir & water qualityHousing & transitHow Do Counties Rank for Health Factors?What Do Differences Between Ranks Mean?The blue map shows the distribution of Wisconsin’shealth factor ranks across counties. The map is dividedinto four quartiles with less color intensity indicatingbetter health factors in the respective summary rankings.Specific county ranks can be found in the table on page 2.Counties are ordered by the health factor rank, with atop-ranked county (rank 1) having the best health factorscore. As previously noted, ranks mask differences in theopportunity for health within counties and from onecounty to the next. The chart next to the map shows thespread of health factor scores (ranks) for each rankedcounty (blue circles) in Wisconsin. This graphic shows thesize of the gap between ranked counties. The differentbackground colors correspond to the four quartiles usedin the map.Detailed information on the measures and theirassociated weights is available on page 9. You can alsolearn about how we calculate health factor ranks, atwww.countyhealthrankings.org.Figure 2. Health factor ranks displayed using quartiles (map) and underlying health factor scores (chart)Page 5 www.countyhealthrankings.org
County Health Rankings 2020Growing Healthy Places Means Ensuring Opportunities for AllHealth is influenced by every aspect of how andwhere we live. Access to secure and affordablehousing, safe neighborhoods, good paying jobsand quality early childhood education areexamples of important factors that can put peopleon a path to a healthier life. But access to theseopportunities often looks different based onwhere you live, the color of your skin, or thecircumstances you were born into. Data show apersistent pattern in barriers to opportunity forpeople with lower incomes and for communities ofcolor across the United States. Patterneddifferences in a range of health factors emergefrom unfair policies and practices at many levelsCopyright 2019 Brian Adams. Photo courtesy of the Robert Wood Johnson Foundation.and over many decades.Using Data for ActionAchieving health equity means reducing and ultimatelyeliminating unjust and avoidable differences in opportunityand health. Our progress toward health equity will bemeasured by how health disparities change over time. Visitwww.countyhealthrankings.org to learn more about:1. Health outcome and factor measures for your state andcounty;2. Measures that have data available for racial and ethnicgroups to illuminate differences in opportunities forhealth in your state and county;3. Additional data resources for Wisconsin that provideinformation about health and opportunity among othersubgroups, such as gender, age, or zip code.What Has Been Done Can Be UndoneMany communities are mobilizing state and local efforts toharness the collective power of community members,partners, and policymakers – working together to dismantleunfair patterns and ensure the growth of healthy places forall. To learn from others who are igniting possibilities andinspiring action, visit our Learn from Others page atwww.countyhealthrankings.org.Page 6 www.countyhealthrankings.org
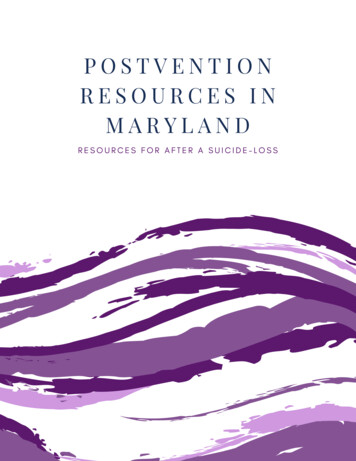
County Health Rankings 2020Opportunities for Health Within Wisconsin CountiesA healthy beginning is essential to a healthy future for our children and our communities. Children in poverty is ameasure of both current and future opportunities for the health of the community. Patterns of unfair and avoidabledifferences at the local, state, and national level exist among racial and ethnic groups for children living in poverty.The graphic below shows the patterns of children living in poverty for individual counties in Wisconsin and among racialand ethnic groups within counties of Wisconsin. It also shows the data for all counties across the nation in the gray circlesbeneath the Wisconsin data.Key Takeaways for Children Living in Poverty in WisconsinOverall 14% of Wisconsin children are living in poverty, lower than the national average of 18%. Rates for children living in poverty range from 4% to 43% across Wisconsin counties.AmongRacial &EthnicGroups Rates for children living in poverty differ among racial and ethnic groups in Wisconsin andthe nation. In Wisconsin, state values (orange triangles) range from 10% for White children to 43% forBlack children. Within Wisconsin counties (orange circles) and US counties (gray circles), rates of childrenliving in poverty also vary among racial and ethnic groups.Want to learn more? Visit our State Reports page at www.countyhealthrankings.org to interact with thedata and explore patterns in other measures by place and among racial and ethnic groups.Page 7 www.countyhealthrankings.org
County Health Rankings 20202020 County Health Rankings for Wisconsin: Measures and National/State ResultsMeasureHEALTH OUTCOMESPremature death*Poor or fair healthPoor physical health daysPoor mental health daysLow birthweight*HEALTH FACTORSHEALTH BEHAVIORSAdult smokingAdult obesityFood environment indexPhysical inactivityAccess to exerciseopportunitiesExcessive drinkingAlcohol-impaired drivingdeathsSexually transmittedinfectionsTeen births*CLINICAL CAREUninsuredPrimary care physiciansDentistsMental health providersPreventable hospitalstays*Mammographyscreening*Flu vaccinations*DescriptionWIWIMinimum MaximumUSWIYears of potential life lost before age 75 per 100,000 population (age-adjusted).Percentage of adults reporting fair or poor health (age-adjusted).Average number of physically unhealthy days reported in past 30 days (ageadjusted).Average number of mentally unhealthy days reported in past 30 days (age-adjusted).Percentage of live births with low birthweight ( 2,500 .84.08%4.07%3.14%5.610%Percentage of adults who are current smokers.Percentage of the adult population (age 20 and older) that reports a body massindex (BMI) greater than or equal to 30 kg/m2.Index of factors that contribute to a healthy food environment, from 0 (worst) to 10(best).Percentage of adults age 20 and over reporting no leisure-time physical activity.Percentage of population with adequate access to locations for physical %21%85%14%7%30%98%Percentage of adults reporting binge or heavy drinking.Percentage of driving deaths with alcohol involvement.19%28%24%36%21%7%29%80%Number of newly diagnosed chlamydia cases per 100,000 population.524.6478.697.71,147.82317362Number of births per 1,000 female population ages 15-19.Percentage of population under age 65 without health insurance.10%6%4%Ratio of population to primary care physicians.1,330:1 1,270:1 15,310:1Ratio of population to dentists.1,450:1 1,460:1 10,170:1Ratio of population to mental health providers.400:1 490:17,290:1Rate of hospital stays for ambulatory-care sensitive conditions per 100,000 Medicare 4,535 3,9401,196enrollees.Percentage of female Medicare enrollees ages 65-74 that received an annual42%50%33%mammography screening.Percentage of fee-for-service (FFS) Medicare enrollees that had an annual flu46%52%22%vaccination.SOCIAL & ECONOMIC FACTORSHigh school graduationPercentage of ninth-grade cohort that graduates in four years.85%89%77%Some collegePercentage of adults ages 25-44 with some post-secondary education.66%69%44%UnemploymentPercentage of population ages 16 and older unemployed but seeking work.3.9%3.0%2.2%Children in poverty*Percentage of people under age 18 in poverty.18%14%4%Income inequalityRatio of household income at the 80th percentile to income at the 20th percentile.4.94.33.4Children in single-parent Percentage of children that live in a household headed by single parent.33%32%18%householdsSocial associationsNumber of membership associations per 10,000 population.9.311.65.3Violent crimeNumber of reported violent crime offenses per 100,000 population.3862980Injury deaths*Number of deaths due to injury per 100,000 population.708047PHYSICAL ENVIRONMENTAir pollution - particulate Average daily density of fine particulate matter in micrograms per cubic meter8.68.66.2matter(PM2.5).Drinking water violations Indicator of the presence of health-related drinking water violations. 'Yes' indicatesN/AN/ANothe presence of a violation, 'No' indicates no violation.Severe housing problems Percentage of households with at least 1 of 4 housing problems: overcrowding, high18%14%9%housing costs, lack of kitchen facilities, or lack of plumbing facilities.Driving alone to work*Percentage of the workforce that drives alone to work.76%81%72%Long commute - drivingAmong workers who commute in their car alone, the percentage that commute36%27%12%alonemore than 30 minutes.* Indicates subgroup data by race and ethnicity is availablePage 8 %44%
County Health Rankings 20202020 County Health Rankings: Ranked Measure Sources and Years of DataMeasureHEALTH OUTCOMESLength of LifeQuality of LifeHEALTH FACTORSHEALTH BEHAVIORSTobacco UseDiet and ExerciseAlcohol and Drug UseSexual ActivityCLINICAL CAREAccess to CareWeight SourceYears of DataPremature death*Poor or fair healthPoor physical health daysPoor mental health daysLow birthweight*50%10%10%10%20%National Center for Health Statistics - Mortality FilesBehavioral Risk Factor Surveillance SystemBehavioral Risk Factor Surveillance SystemBehavioral Risk Factor Surveillance SystemNational Center for Health Statistics - Natality filesAdult smokingAdult obesityFood environment index10%5%2%201720162015 & 2017Physical inactivityAccess to exercise opportunities2%1%Excessive drinkingAlcohol-impaired driving deathsSexually transmitted infections2.5%2.5%2.5%Teen births*2.5%Behavioral Risk Factor Surveillance SystemUnited States Diabetes Surveillance SystemUSDA Food Environment Atlas, Map the Meal Gap fromFeeding AmericaUnited States Diabetes Surveillance SystemBusiness Analyst, Delorme map data, ESRI, & US CensusTigerline FilesBehavioral Risk Factor Surveillance SystemFatality Analysis Reporting SystemNational Center for HIV/AIDS, Viral Hepatitis, STD, and TBPreventionNational Center for Health Statistics - Natality files2017201720181%5%2.5%2.5%Small Area Health Insurance EstimatesArea Health Resource File/American Medical AssociationArea Health Resource File/National Provider IdentificationfileCMS, National Provider IdentificationMapping Medicare Disparities ToolMapping Medicare Disparities ToolMapping Medicare Disparities Tool5%5%10%7.5%2.5%2.5%Wisconsin Department of Public InstructionAmerican Community Survey, 5-year estimatesBureau of Labor StatisticsSmall Area Income and Poverty EstimatesAmerican Community Survey, 5-year estimatesAmerican Community Survey, 5-year estimates2.5%2.5%2.5%County Business PatternsUniform Crime Reporting - FBINational Center for Health Statistics - Mortality Files2.5%Environmental Public Health Tracking Network2.5%2%2%1%Safe Drinking Water Information SystemComprehensive Housing Affordability Strategy (CHAS) dataAmerican Community Survey, 5-year estimatesAmerican Community Survey, 5-year estimatesUninsuredPrimary care physiciansDentists5%3%1%Mental health providersQuality of CarePreventable hospital stays*Mammography screening*Flu vaccinations*SOCIAL & ECONOMIC FACTORSEducationHigh school graduationSome collegeEmploymentUnemploymentIncomeChildren in poverty*Income inequalityFamily and SocialChildren in single-parentSupporthouseholdsSocial associationsCommunity SafetyViolent crimeInjury deaths*PHYSICAL ENVIRONMENTAir and Water Quality Air pollution - particulatematter Drinking water violationsHousing and TransitSevere housing problemsDriving alone to work*Long commute - driving alone* Indicates subgroup data by race and ethnicity is available Not available for AK and HIPage 9 012-201820162010 & 0162014-2018201420182012-20162014-20182014-2018
County Health Rankings 20202020 County Health Rankings: Additional Measure Sources and Years of DataHEALTH OUTCOMESLength of LifeQuality of LifeMeasureSourceLife expectancy*Premature age-adjusted mortality*Child mortality*Infant mortality*Frequent physical distressFrequent mental distressDiabetes prevalenceHIV prevalenceNational Center for Health Statistics - Mortality FilesNational Center for Health Statistics - Mortality FilesNational Center for Health Statistics - Mortality FilesNational Center for Health Statistics - Mortality FilesBehavioral Risk Factor Surveillance SystemBehavioral Risk Factor Surveillance SystemUnited States Diabetes Surveillance SystemNational Center for HIV/AIDS, Viral Hepatitis, STD, and 17201720162016Map the Meal GapUSDA Food Environment AtlasNational Center for Health Statistics - Mortality FilesNational Center for Health Statistics - Mortality FilesBehavioral Risk Factor Surveillance System201720152016-20182012-20182016HEALTH FACTORSHEALTH BEHAVIORSDiet and ExerciseFood insecurityLimited access to healthy foodsAlcohol and Drug UseDrug overdose deaths*Motor vehicle crash deaths*Other Health Behaviors Insufficient sleepCLINICAL CAREAccess to CareUninsured adultsUninsured childrenOther primary care providersSOCIAL & ECONOMIC FACTORSEducationDisconnected youthReading scores* Math scores* IncomeMedian household income*Children eligible for free or reduced pricelunchFamily and SocialResidential segregation - Black/WhiteSupportResidential segregation - non-White/WhiteCommunity SafetyHomicides*Suicides*Firearm fatalities*Juvenile arrests PHYSICAL ENVIRONMENTHousing and TransitTraffic volumeHomeownershipSevere housing cost burden*Indicates subgroup data by race and ethnicity is available. Not available in all statesSmall Area Health Insurance EstimatesSmall Area Health Insurance EstimatesCMS, National Provider IdentificationYears of Data201720172019American Community Survey, 5-year estimatesStanford Education Data ArchiveStanford Education Data ArchiveSmall Area Income and Poverty EstimatesNational Center for Education Statistics2014-20182016201620182017-2018American Community Survey, 5-year estimates2014-2018American Community Survey, 5-year estimatesNational Center for Health Statistics - Mortality FilesNational Center for Health Statistics - Mortality FilesNational Center for Health Statistics - Mortality FilesEasy Access to State and County Juvenile Court EJSCREEN: Environmental Justice Screening and MappingToolAmerican Community Survey, 5-year estimatesAmerican Community Survey, 5-year estimatesSee additional contextual demographic information and measures online at www.countyhealthrankings.orgPage 10 www.countyhealthrankings.org20182014-20182014-2018
County Health Rankings 2020Technical Notes and Glossary of TermsWhat is health equity? What are health disparities? And how do they relate?Health equity means that everyone has a fair and just opportunity to be as healthy as possible. This requires removingobstacles to health such as poverty and discrimination, and their consequences, including powerlessness and lack of access togood jobs with fair pay, quality education and housing, safe environments, and health care.Health disparities are differences in health or in the key determinants of health such as education, safe housing, anddiscrimination, which adversely affect marginalized or excluded groups.Health equity and health disparities are closely related to each other. Health equity is the ethical and human rights principle orvalue that motivates us to eliminate health disparities. Reducing and ultimately eliminating disparities in health and itsdeterminants of health is how we measure progress toward health equity.Braveman P, Arkin E, Orleans T, Proctor D, and Plough A. What is Health Equity? And WhatDifference Does a Definition Make? Robert Wood Johnson Foundation. May 2017How do we define racial and ethnic groups?In our analyses by race and ethnicity we define each category as follows: Hispanic includes those who identify themselves as Mexican, Puerto Rican, Cuban, Central or South American, otherHispanic, or Hispanic of unknown origin and can be of any racial background.American Indian & Alaska Native (AIAN) includes people who identify themselves as American Indian or AlaskaNative.Asian/Pacific Islander (Asian/PI) includes people who identify themselves as Asian or Pacific Islander.Black includes people who identify themselves as Black or African American.White includes people who identify themselves as White and do not identify as Hispanic.Our analyses do not include people reporting more than one race, as this category was not measured uniformly across thedata sources used in the County Health Rankings. These racial and ethnic categories can mask variation within groups and canhide historical context that underlies health differences.We recognize that “race” is a social category, meaning the way society may identify individuals based on their culturalancestry, not a way of characterizing individuals based on biology or genetics. A strong and growing body of empiricalresearch provides support for the fact that genetic factors are not responsible for racial differences in health factors and veryrarely for health outcomes.How do we rank counties?To calculate the ranks, we first standardize each of the measures using z-scores. Z-scores allow us to combine multiplemeasures because the measures are now on the same scale. The ranks are then calculated based on weighted sums of themeasure z-scores within each state to create an aggregate z-score. The county with the best aggregate z-score (healthiest)gets a rank of #1 for that state. The aggregate z-scores are graphed next to the maps for health outcomes and health factorson pages 4 and 5 to show the distribution of the values that contribute to the rank. To see more detailed information on rankcalculation please visit our methods in Explore Health Rankings on our website: www.countyhealthrankings.org.Technical Notes: In this report, we use the terms disparities, differences, and gaps interchangeably. We follow basic design principles for cartography in displaying color spectrums with less intensity for lower valuesand increasing color intensity for higher values. We do not intend to elicit implicit biases that “darker is bad”. Overall county level values of children in poverty are obtained from one-year modeled estimates from the Small AreaIncome and Poverty Estimates (SAIPE) Program. Because SAIPE does not provide estimates by racial and ethnicgroups, data from the 5-year American Community Survey (ACS) was used to quantify children living in poverty byracial and ethnic groups. County-level data for children in poverty among racial and ethnic groups are not shown if the estimate wasconsidered to be unreliable (confidence interval width was greater than 40% or value was 0% or 100%). Unreliableestimates are often due to a very small sample size. Given the suppression of data for small sample sizes particularly for county data by race, there may be a gap betweenthe state value and the data for the county data that are available. In many of the images using one circle to depict a county the values are very close causing overlapping circles. Inthese cases, greater color intensity indicates overlapping of multiple counties.Page 11 www.countyhealthrankings.org
County Health Rankings 2020Report AuthorsCourtney Blomme, MS, RDAnne Roubal, PhD, MSMarjory Givens, PhD, MSPHSheri Johnson, PhDLawrence Brown, PhDSuggested citation: University of Wisconsin Population Health Institute. County Health Rankings State Report 2020.Research Assistance:Molly BurdineAmanda Gatewood, PhDKeith Gennuso, PhDJoe Hinton, MAHannah Olson-WilliamsEunice Park, MISElizabeth Pollock, PhDJennifer RobinsonMatthew Rodock, MPHWith contributions from our CHR&R team including:What Works for HealthCommunity TransformationOperationsRWJF Culture of Health PrizeThis work could not be done without our partnerships with:The Centers for Disease Control and Prevention for providing us with key health indicatorsBurness for supporting our communication effortsForum One for website design and supportThis work is possible thanks to a collaboration between the Robert Wood Johnson Foundation and the University ofWisconsin Population Health Institute.University of Wisconsin Population Health Institute610 Walnut St, #524, Madison, WI 53726 (608) 265-8240 info@countyhealthrankings.orgPage 12 www.countyhealthrankings.org
County Health Rankings 2020 Page 2 www.countyhealthrankings.org 2020 County Health Rankings for the 72 Ranked Counties in Wisconsin County County County County Adams 68 69 Florence 61 35 Marathon 14 11 Rusk 24 58 Ashland 66 55 Fond du Lac 29 20 Marinette 60 51 Sauk 31 31