Transcription
Kansas CountyHealth Rankings 2009allen anderson atchison barber barton bourbon brown butler chase chautauqua cherokee cheyenneclark clay cloud coffey comanche cowley crawford decatur dickinson doniphan douglas edwardselk ellis ellsworth finney ford franklin geary gove graham grant gray greeley greenwood hamiltonharper harvey haskell hodgeman jackson jefferson jewell johnson kearny kingman kiowa labettelane leavenworth lincoln linn logan lyon mcpherson marion marshall meade miami mitchellmontgomery morris morton nemaha neosho ness norton osage osborne ottawa pawnee phillipspottawatomie pratt rawlins reno republic rice riley rooks rush russell saline scott sedgwick sewardshawnee sheridan sherman smith stafford stanton stevens sumner thomas trego wabaunsee wallacewashington wichita wilson woodson wyandotte
KANSAS HEALTH INSTITUTEBoard of DirectorsCharles A. Wells Jr. (Chair)John R. Zutavern (Vice Chair)Jim Tangeman (Secretary/Treasurer)Robert F. St. Peter, M.D. (President and CEO)Tim CruzSharon G. HixsonKANSAS HEALTH INSTITUTE212 SW Eighth Avenue, Suite 300Topeka, Kansas 66603-3936Telephone (785) 233-5443Fax (785) 233-1168www.khi.orgThe Kansas Health Institute isan independent, nonprofit healthpolicy and research organizationbased in Topeka, Kansas. Establishedin 1995 with a multiyear grant fromthe Kansas Health Foundation, theKansas Health Institute conductsresearch and policy analysis on issuesthat affect the health of Kansans.Copyright Kansas Health Institute 2009.Materials may be reprinted with written permission.KHI/09-07R May 2009
Table of ContentsAbout the Report . iiAuthors . iiAcknowledgments . iiIntroduction . 1Measuring Health . 2Figure 1. Logic Model for the “Kansas County HealthRankings 2009” . 2Health and its Determinants . 3How to Measure Health . 3The Rankings . 5Table 1. Summary Health Index Ranking . 5Why the Health Rankings . 6Interpreting the Rankings . 6Results . 7Figure 2. Summary Health Index by Quartile . 7Table 2. Health Outcomes and Health DeterminantsRankings . 8Table 3. Summary of Ranking Positions Sorted by County.10Looking for Trends .13Table 4. Intrepretation of Distance Between Rankings .13Figure 3. Average Distance of Rankings for Outcomesand Determinants by County Type .14About the Data .15Table 5. List of Data Elements and Sources .15Data Limitations .17Endnotes .18Suggested Citation .18Kansas Health Institute Kansas County Health Rankings 2009i
About the ReportAuthors“Kansas County Health Rankings 2009” was written byGianfranco Pezzino, M.D., M.P.H. Primary data analysis wasprovided by Cheng-Chung Huang, M.P.H.AcknowledgmentsSharon M. Homan, Ph.D., vice president for public health,Jim McLean, vice president for public affairs, Cathy McNorton,communications specialist, and Robert. F. St. Peter, M.D.,president and CEO, also contributed to the report.We also thank Paula Clayton, Greg Crawford, Lou Saadi andGhazala Perveen from the Kansas Department of Health andEnvironment for providing many of the data used for this project.This project is based on a model first used at the state level by theUniversity of Wisconsin Population Health Institute. Dr. PatrickRemington, the institute’s director, and his staff have provided veryvaluable advice and assistance over the life of this project. Withouttheir mentorship this project could not have been completed.Funding for the project was provided by the Kansas HealthFoundation of Wichita, Kansas, a philanthropic organization whosemission is to improve the health of all Kansans.On the WebAn electronic version of this report and supportingmaterials is available at www.khi.org.The online report features aninteractive Web applicationthat allows users to explore the dataused in compiling the health rankings.iiKansas Health Institute Kansas County Health Rankings 2009
IntroductionWe love rankings and we usethem in our everyday lives.They tell us where our favoritesports teams stand compared tothe competition. They give usguidance on the best places tolive and eat as well as the mostreliable cars and appliances tobuy. They can also tell us a lotabout our health and well-being.The Kansas Health Institutehopes to stimulate an ongoingdiscussion about the health ofKansans and the powerfulfactors that influence it with thisreport, “Kansas County HealthRankings 2009.”In it, we rank all 105 countiesbased on a summary measureof the health of their residents.These rankings are displayedon page 5 in Table 1. Thishealth index is calculated byanalyzing two sets of indicators— health determinants andhealth outcomes.Health outcomes are thosethings that describe howhealthy we are as a populationat a given moment. Specificindicators include mortality ratesand low birth weights. Healthdeterminants are those things thatinfluence health outcomes. Theyinclude socioeconomic status,education, genetics, access tohealth care and the physicalenvironment in which we live.Many people do not realize thatthe factors that most powerfullyinfluence our health have little todo with health care provided indoctors’ offices and hospitals.A full description of themethods used to generatethe county health rankings iscontained in a separate onlinetechnical document.1each state on several healthdeterminants and outcomesmeasures. At the state level,the University of WisconsinPopulation Health Institute haspublished six annual reportsthat rank that state’s countiesin ways similar to those inthis report. A handful of otherstates have produced similarreports. In addition, the RobertWood Johnson Foundation issupporting a project to developcounty-level indicators of healthacross the entire country.The goal of this report andothers like it is to stimulatediscussion and action byindividuals, communities,policymakers, health careThis broad approach tomeasuring the health of Kansans providers and public healthofficials to improve the healthis meant to generate discussionof their communities. Theat the community, county anddevelopment of policies andstate levels about ways tointerventions that affect healthimprove our health. A similardeterminants is critical. Thatmethodology has been usedmeans policies capable offor years by the United HealthFoundation to publish “America’s changing those systemic factorsthat influence our health.Health Rankings,” which ranksKansas Health Institute Kansas County Health Rankings 20091
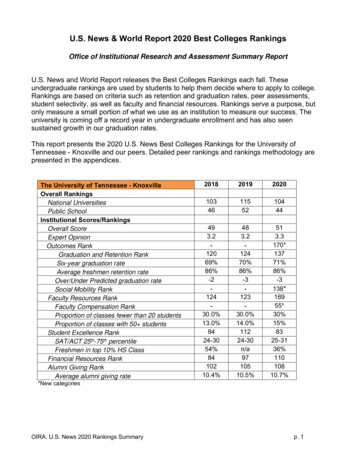
Measuring HealthFigure 1. Logic Model for the “Kansas County Health Rankings 2009” 2HealthOutcomesMortality — YPLL (33%)General Health Status (33%)Low Birth Weight (33%)Access to Care (3 Measures)Health Care (10%)Quality of Preventive andOutpatient Care (3 Measures)Tobacco (2 Measures)Diet and Exercise (3 Measures)Health Behaviors (40%)Alcohol Use (1 Measure)High Risk Behaviors (4 Measures)HealthDeterminantsEducation (2 Measures)Socioeconomic Factors (40%)Income (2 Measures)Social Support (2 Measures)Air Quality (2 Measures)Physical Environment (10%)Water Quality (1 Measure)Built Environment (3 Measures)Policies andInterventions2Kansas Health Institute Kansas County Health Rankings 2009
Measuring HealthHealth and its determinantsHealth (both in its outcomesand in its determinants) canThe question of what constibe profoundly affected bytutes “good health” has beenpublic policies enacted by local,debated for a long time. Differentstate and federal governments.definitions have been formulatedFor example, restrictions onthat emphasize one aspect orsmoking in public placesanother of the health domain, butaffect behavior (how much onetwo concepts appear to be wellsmokes) and the environmentestablished:(how much exposure one has to First, health is more than thesecondhand smoke).absence of disease. It is theoverall physical, mental andThe health of a communitysocial well-being of a personor community of persons.is represented by the overall Second, health is the resulthealth of its members,of the interaction of avariety of factors. We are alldetermined by their personalborn with our own geneticpredispositions to certainbehaviors, their level of accessdiseases. But the extent toto health care, the quality ofwhich we remain healthyis the result of our personaltheir physical environment,behaviors, the environmentand communities inand the socioeconomic factorswhich we live, the socialspecific to their community.structure that we share andthe clinical care that wereceive. These four domainsHealth is often thought of(health behaviors, physicalas an individual status, butenvironment, socioeconomic the concept of physical wellfactors and health care) arebeing can be expanded fromreferred to in this report asindividuals to communities.health determinants. HealthIf we use the broad definitiondeterminants are agents thatof health and its determinantsinteract with each other indescribed above, the health of acomplex ways to influencecommunity is represented by theboth our health as individuals overall health of its members,and that of our communities. determined by their personalbehaviors, their level of accessto health care, the quality of theirphysical environment, and thesocioeconomic factors specific totheir community.How to measure healthMeasuring health outcomesand health determinants at thelocal level is challenging. Eachcommunity is different andhas unique factors that affectpositively or negatively thehealth of its residents.Comprehensive communityhealth assessment tools existto create in-depth profiles ofa community’s strengths andchallenges in the health arena.These tools and the assessmentsthey generate can be valuable forpolicy and planning purposes,but often require significantresources. In addition, the resultsof individual assessments aredifficult to compare to those ofother communities.This report uses an alternativeapproach of selecting a numberof measures to describehealth outcomes and healthdeterminants in each county.While the scope is narrowerthan that of a comprehensivecommunity health assessment,the use of a limited number ofmeasures across all the countiesmakes the comparison amongcounties easier.Kansas Health Institute Kansas County Health Rankings 20093
Measuring HealthThe selection of these measures was based upon the publichealth priorities of the state,their scientific validity, theirimportance to overall health,and availability of data at thecounty level. The relative lack ofcounty-level data proved to be aparticularly important challengeand shaped considerably the waythat the report was prepared.Those limitations are discussedin more detail on page 17.Health outcomes measuresincluded in this report aremortality (expressed as yearsof potential life lost, or YPLL),low birth weight (LBW) rate,and self-reported general healthstatus. For health determinants,the four broad components ofhealth behaviors, health care,socioeconomic factors andphysical environment werefurther divided into severalsubcategories, each of whichwas assigned one or moremeasures. For example, thehealth care category includestwo subcategories: access tocare, and quality of preventiveand outpatient care. The accessto care subcategory has threemeasures and the quality ofpreventive and outpatient caresubcategory also has three. Thevalues of all the measures werecombined to create a specificindex for each component, aswell as an overall index. Thesummary health index, featuredon page 5, includes measuresfrom all the determinants andthe outcomes, and representsa comprehensive view of thehealth of individual counties.Finally, counties received arank for health outcomes andfor each component of thehealth determinants, as well asfor the summary health index.Counties with a high rank(e.g., 1 or 2) are considered tobe the healthiest. A full list ofthe measures, categories andcomponents used to preparethe “Kansas County HeathRankings 2009” is included inTable 5 on page 15.The logic model that servedas the foundation for this reportis illustrated in Figure 1 onpage 2.HEALTH DETERMINANTSFollowing a model used by other organizations in similar projects, this report looks at four groupsof health determinants that can affect the health of individuals and communities:1. Health behaviors include the activities that we engage in that affect our personal health. Itincludes habits and practices such as what we routinely eat, how much we exercise, whether wesmoke and how much alcohol we drink. While these behaviors can be modified with individualeffort, various community support systems and clinical interventions also play important roles.2. Physical environment determines the daily conditions in which we live. These conditions —the quality of the air we breathe and the water we drink among them — significantly affectour health.3. Socioeconomic factors have been known for a long time to have a significant impact on health.In addition to income, these factors include the safety of our neighborhoods, the healthfulness ofour food choices and perhaps most importantly having access to a quality education.4. Health care reflects the quality, appropriateness and cost of the clinical care that we receive atdoctors’ offices, clinics and hospitals when we are sick.4Kansas Health Institute Kansas County Health Rankings 2009
The RankingsTable 1. Summary Health Index earyLabetteMontgomeryWyandotteKansas Health Institute Kansas County Health Rankings 20095
The RankingsWhy the health rankings?population, meaning that theyeventually produce healthCreating rankings is aoutcomes. Generally speaking,controversial process. Eachtherefore, a county’s healthcounty in the state candeterminants ranking indicatesclaim diverse populations,the direction in which healthenvironments and resources,in that county can be expectedand has particular strengths,to move in the near future.weaknesses and public healthA county’s health outcomeschallenges. Despite thismeasure, on the other hand,variability, we think that rankingsreflects the more current healthcan serve a constructive purpose.status of its population.They are easy to understandfor nontechnical audiences andpolicymakers and they help toA county’s health determinantsidentify high and low performersranking indicates thein each area. Successful countiescan serve as role models fordirection in which health intheir lower-ranked peers. Inaddition, comparisons alwaysthat county can be expectedstimulate discussion. We hopeto move in the near future.that our efforts to summarize andcommunicate this informationSince there is a delay (upto a broad audience will addvalue to the state’s public health to several years) between thecollection of information on eachand health policy discussionsmeasure and its availability forand stimulate communities toanalysis, in reality the outcomehonestly assess their strengthsranking represents the healthand challenges and developoutcomes that were present someeffective strategies for dealingtime in the recent past.with those challenges.Interpreting the rankingsThe measures that comprisethe Kansas county healthrankings are of two types —health determinants and healthoutcomes. Health determinantsrepresent factors that canaffect the future health of the6domains studied in this project.In some cases, particularly forthe indicators related to thephysical environment, theseindicators may not fully representthe complexity of the interactionbetween health determinantsand outcomes. In the absenceof better measures, we decidedto use the best data availabletoday, with the hope that as newinformation is generated, ourability to measure the effectsof health determinants alsowill improve.One important limitation ofthe rankings is that for someindicators the sample sizeavailable in each county is toosmall to produce stable andreliable measurements, evenwhen information from multipleyears is pooled together. Inaddition, some indicators aresubject, by their own nature, toconsiderable fluctuations fromyear to year. For these reasons,the ranking positions should beinterpreted as broad indicators,and not exact measures of healthin each county. Attention shouldFor a county to improvebe paid more to general trendsthe health of its population, itin the rankings, rather than themust focus on changing theindividual value of one measuredeterminants of health.or small differences in rankingThe indicators that we selected position. For example, a countyare based on similar projectsthat consistently appears in thedone elsewhere and represent the bottom part of the rankings forbest information available in the most health determinants is moreKansas Health Institute Kansas County Health Rankings 2009
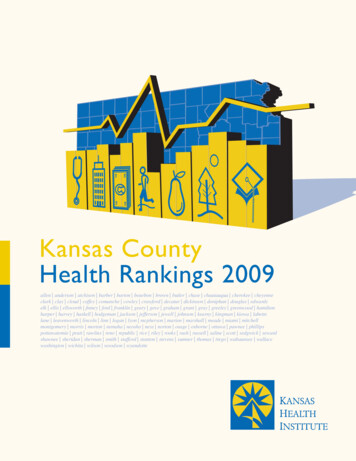
The Rankingslikely to experience problemswith its health outcomes in thefuture than a county that has onehealth determinant that rankstowards the bottom but mostothers in the middle or upperportions.to identify practices and potential of determinants is statisticallychanges likely to improve health linked to an increase (on average)across the state.of 0.47 positions in the rankingof outcomes. In statistical terms,Resultsthe strength of this correlationAs expected, we observedis moderate, meaning that thewide variability among counties model we used to calculate thewhen measuring the healthrankings is only broadly accurate.Another limitation of thedeterminants and outcomesAfter listing the counties basedrankings is that while they showincluded in this report. Based onon their rank, we organized thema comparison among countiesthe model we used, one couldin Kansas, they do not providein four groups of equal sizeexpect a correlation betweeninformation about how the health(quartiles), based on their rankingthe position of a county in thein Kansas counties compares topositions (Figure 2). Counties inhealth determinants ranking andnational and state goals, nor dothe top quartile exhibited the bestits health outcomes ranking.ranking positions, while those inthey assess the extent to whichWe found that statistically, theeach county has achieved itsthe bottom quartile had the leastcorrelation coefficient betweenfavorable positions, with those infull health potential. Despite thethe two rankings was 0.47.limitations, these comparisonsquartiles number two and threeThat means that an increasecan be used as a learning processoccupying intermediate positions.of one position in the rankingFigure 2. Summary Health Index by on53Stevens44Seward90Top Quartile (1–26)Best Ranking ber45Upper Middle Quartile 6LeavenworthJefferson 50Wyandotte48105ShawneeWabaunsee78Douglas Johnson17327Harvey21Sedgwick85Brown87 Doniphan66Pottawatomie wards29Republic61Jewell10Chautauqua92Lower Middle Quartile 3Linn62Woodson101Allen94Bourbon100Wilson99Neosho Crawford8297LabetteMontgomery 103 Cherokee98104Bottom Quartile (80–105)Least Favorable PositionsKansas Health Institute Kansas County Health Rankings 20097
The RankingsTable 2. Health Outcomes and Health Determinants RankingsTOP QUARTILEUPPER MIDDLE RepublicTregoEllisBarberLeavenworth8Kansas Health Institute Kansas County Health Rankings 2009
The RankingsLOWER MIDDLE BOTTOM nWyandotteKansas Health Institute Kansas County Health Rankings 20099
The RankingsTable 3. Summary of Ranking Positions Sorted by 7196957510026514379030814858942787438Kansas Health Institute Kansas County Health Rankings 96101613920123184
The Kansas Health Institute Kansas County Health Rankings 200911
The RankingsTable 3 (continued). Summary of Ranking Positions Sorted by 594Kansas Health Institute Kansas County Health Rankings 2009
Looking for TrendsWe analyzed the rankings tosee if there was any importantpattern of performance indifferent parts of the state, basedon the characteristics of thecounties. In general, we foundno consistent differences thatcould be related to populationdensity, with one exception. Theexception is represented by thedegree of difference between therankings for health outcomesand health determinants. If thedifference is represented by apositive number, it indicates thatthe ranking for determinants isbetter than that for outcomes.A negative number means theopposite. Generally speaking,if the determinants ranking isbetter than the outcomes rankingit means that the health of acounty’s population is likely toimprove over time. When thedeterminants ranking is lowerthan the outcomes ranking, itgenerally means that the healthof a county’s population is likelyto decline. Table 4 presents anexample of how the distancebetween rankings can beinterpreted.Generally speaking, if thedeterminants ranking is betterthan the outcomes rankingit means that the health of acounty’s population is likely toimprove over time.Table 4. Intrepretation of Distance Between RankingsExampleExample 1Example 2Ranking forOutcomes1560Ranking forDeterminants1075Distance:Outcomes MinusDeterminantsInterpretation5Ranking for healthdeterminants is slightlymore favorable thanfor health outcomes.Health outcomes can beexpected to improve inthe future.-15Ranking for healthdeterminants is considerably worse than forhealth outcomes. Healthoutcomes are likely toworsen in the future.Kansas Health Institute Kansas County Health Rankings 200913
Looking for TrendsWhen we looked at the averagedistance between the two rankingpositions for counties withdifferent population densities,we found that frontier countiesperformed better on healthdeterminants than on outcomes(Figure 3). Counties withincreasing population densityexhibit a progressive worseningof their ranking for healthdeterminants compared to theirranking for health outcomes. Inurban counties, the ranking fordeterminants was on average 15positions worse than the rankingfor outcomes. This means thaturban settings may experiencea worsening of their healthoutcomes in the near future ifpolicies are not implementedto improve the determinantsthat affect health. Amongthe five counties classified asurban,3 Johnson is the onlycounty in which the ranking fordeterminants is better than thatfor outcomes, meaning that itshealth outcomes in the futuremay improve. It should be notedthat Johnson County ranks veryhigh on all the scales that wemeasured (#1 for determinants,#7 for outcomes and #3 for thesummary health index).Aside from this trend, theoutcomes and determinantsranking positions in each countyappeared to be related more tothe unique characteristics of thatcounty than to its populationdensity. A clear example isprovided by a comparison ofWyandotte and Johnson counties,which occupy the two extremepositions in the rank (Wyandottebeing towards the bottom andJohnson towards the top). Thistells us that the socioeconomiccharacteristics and local policiesof each county/community aremore important than populationdensit
Kansas Health Institute Kansas County Health Rankings 2009 9 LOWER MIDDLE QUARTILE RankHealth Outcomes Health Determinants 53 McPherson Rush 54 Hodgeman Lincoln 55 Franklin Wichita 56 Shawnee Doniphan 57 Linn Sherman 58 Haskell Kingman 59 Kingman Norton 60 Russell Sumner 61 Washington Osborne 62 Neosho Linn 63 Marshall Harper 64 Stevens Osage