Transcription
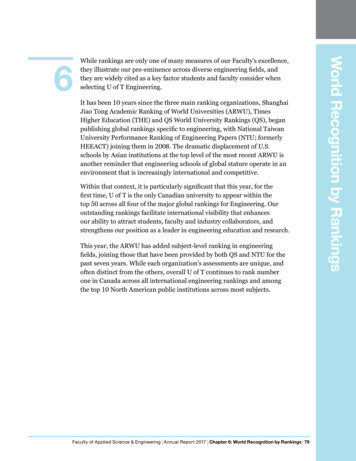
It has been 10 years since the three main ranking organizations, ShanghaiJiao Tong Academic Ranking of World Universities (ARWU), TimesHigher Education (THE) and QS World University Rankings (QS), beganpublishing global rankings specific to engineering, with National TaiwanUniversity Performance Ranking of Engineering Papers (NTU; formerlyHEEACT) joining them in 2008. The dramatic displacement of U.S.schools by Asian institutions at the top level of the most recent ARWU isanother reminder that engineering schools of global stature operate in anenvironment that is increasingly international and competitive.Within that context, it is particularly significant that this year, for thefirst time, U of T is the only Canadian university to appear within thetop 50 across all four of the major global rankings for Engineering. Ouroutstanding rankings facilitate international visibility that enhancesour ability to attract students, faculty and industry collaborators, andstrengthens our position as a leader in engineering education and research.This year, the ARWU has added subject-level ranking in engineeringfields, joining those that have been provided by both QS and NTU for thepast seven years. While each organization’s assessments are unique, andoften distinct from the others, overall U of T continues to rank numberone in Canada across all international engineering rankings and amongthe top 10 North American public institutions across most subjects.Faculty of Applied Science & Engineering Annual Report 2017 Chapter 6: World Recognition by Rankings 79World Recognition by Rankings6While rankings are only one of many measures of our Faculty’s excellence,they illustrate our pre-eminence across diverse engineering fields, andthey are widely cited as a key factor students and faculty consider whenselecting U of T Engineering.
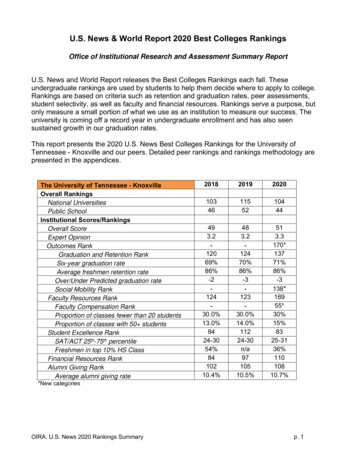
Comprehensive University RankingsShanghai Jiao Tong Academic Ranking of World Universities (ARWU)for Engineering/Technology and Computer SciencesFigure 6.1a ARWU Top 50 World Universities, 2016Massachusetts Inst of TechNanyang Tech UStanford UTsinghua UKing Abdulaziz UNational U SingaporeImperial Coll of Sci, Tech and MedU California, BerkeleyHarbin Inst of TechU Texas, AustinSwiss Fed Inst of Tech, LausanneGeorgia Inst of TechU Illinois, Urbana-ChampaignZhejiang UU Michigan, Ann ArborShanghai Jiao Tong UTexas A&M UPurdue U, West LafayetteU CambridgeSoutheast UXian Jiao Tong USouth China U of TechU California, San DiegoCity U Hong KongPierre and Marie Curie U, Paris 6Carnegie Mellon USwiss Fed Inst of Tech, ZurichU of Sci and Tech of ChinaU California, Los AngelesKing Abdullah U of Sci and TechHong Kong U of Sci and TechPrinceton UU California, Santa BarbaraTechnical U DenmarkU ManchesterNorthwestern UHarvard UU Minnesota, Twin CitiesAalborg UHuazhong U of Sci and TechFudan UCalifornia Inst of TechU New South WalesU WashingtonU GranadaNational Taiwan UOhio State U, ColumbusU TehranKorea UTorontoUUTorontoU of T continues to rank among the premieruniversities worldwide in the 2016 ShanghaiJiao Tong Academic Ranking of WorldUniversities (ARWU) for Engineering/Technology and Computer Science. Afterdramatic changes at the top of the rankings,U of T is now the only Canadian schoolremaining in the top 50.Among North American public universities,our closest peer institutions, U of T ranked14th. We lead all Canadian schools in highlycited research and articles in top journals,two of the three indicators that constitute theARWU’s evaluation methodology.The ARWU is the longest running of the globalrankings. It has provided overall rankingssince 2003 and engineering field rankingssince 2007. For much of the past decade, U.S.schools dominated the top 10 engineeringschool rankings. In 2016, five of those schoolswere displaced by four Asian and one MiddleEastern university that had each climbed, onaverage, 16 places to get there.50The number of North American schools in theARWU top 50 fell from 27 to 21. Two of themheld their positions, including MIT in the topspot. In contrast, the number of Asian schoolsin the top 50 increased from 12 to 16, and allbut one of them rose by an average of 18 places.Middle Eastern schools in the top 50 increasedfrom one to three, collectively climbing byan average of 63 places. Though U of T wasclearly impacted by this overall trend, our rankvariation was close to the average for otherCanadian schools in the top 200 of the ARWU.Figure 6.1aShanghai Jiao Tong Academic Ranking of World Universities (ARWU),Top 50 Universities for Engineering/Technology and Computer Sciences, 2016Data in this chapter include rankings published between August 2016 and July 2017.80 Chapter 6: World Recognition by Rankings Annual Report 2017 Faculty of Applied Science & EngineeringChapter: Ch.6 - RankingsExcel Filename: 6.1a-d - Acad Ranking of World Univ - 2016 - Engineering (AR17 6.1a-d) - v3.xlsxSheet: 6.1a
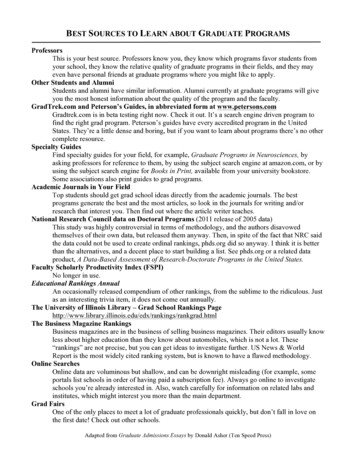
Figure 6.1b ARWU Top North American Public Universities, 2016U California, BerkeleyU Texas, AustinGeorgia Inst of TechU Illinois, Urbana-ChampaignU Michigan, Ann ArborTexas A&M UPurdue U, West LafayetteU California, San DiegoU California, Los AngelesU California, Santa BarbaraU Minnesota, Twin CitiesU WashingtonOhio State U, ColumbusU TorontoTorontoUPennsylvania State U, University ParkNorth Carolina State U, RaleighU Maryland, College ParkU WaterlooWaterlooUBritish ColumbiaColumbiaUUBritishU Colorado, BoulderU AkronArizona State UU AlbertaAlbertaUU California, DavisU MontréalMontréalU1418192325Figure 6.1c Canadian U15 Universities in ARWU Top 200, 2016UU TorontoToronto50U Waterloo75U British Columbia84FigureU Alberta6.1b113ShanghaiJiao Tong Academic Ranking of 119World Universities (ARWU),U MontréalTopfor Engineering/Technology andMcGillU North American Public Universities160Computer Sciences, 2016Figure 6.1d Scoring Analysis of Canadian U15 Universities in ARWU Top 200, 2016Ch.6 -Research:Rankings (HiCi) IndicatorScoring onChapter:Highly CitedExcelFilename:U TorontoTorontoUSheet:U WaterlooU British ColumbiaDate:U AlbertaPreparedby:U Montréal6.1a-d - Acad Ranking of World Univ - 2016- Engineering (AR17 6.1a-d) - v3.xlsxScore: 346.1bScore: 24Score: 24June 20, 2017FigureWichert6.1cScore: 24GeoffScore: 24in ARWU Top 200Canadian U15 UniversitiesScoring on Published Articles: (PUB) IndicatorU WaterlooChapter:U TorontoTorontoUAlbertaExcelUFilename:U British ColumbiaMcGillSheet:UU MontréalDate:Score: 51Ch.6 - RankingsScore: 50Score:496.1a-d - Acad Ranking of World Univ - 2016 - Engineering(AR176.1a-d) - v3.xlsxScore: 476.1cScore: 45Score: 40June 20, 2017Prepared by: Geoff WichertScoring on Articles in Top Journals: (TOP) IndicatorU TorontoTorontoUU British ColumbiaU WaterlooMcGill UU AlbertaU MontréalScore: 87Score: 85Score: 84Score: 84Score: 81Score: 79Note 6.1d: In addition to HiCi, Pub and TOP, the ARWU uses a fourth indicator called Research Expenditures (FUND), which is used only forU.S. schools. Research funding mechanisms differ so significantly from country to country that all other international universities, includingCanadian universities, are ranked using only the first three indicators.Faculty of Applied Science & Engineering Annual Report 2017 Chapter 6: World Recognition by Rankings 81Figure 6.1d
Canadian Universities in ARWU by Subject, 2016The Shanghai Ranking Consultancy, which produces theARWU, published Global Subject Rankings for engineeringdisciplines for the first time in 2016. These replaced the morelimited range of mainly science-focused subjects that havebeen featured since 2009.The new subject rankings continue the ARWU’s emphasison publications and citations, much like the NTU ranking,and in contrast to the British rankings (THE and QS), whichrely heavily on reputational indicators. Scoring is based onvarious measures, including 50% on citations, 30% on newlyintroduced measures of the extent of co-authorship withinternational and corporate or industrial partners, and 20%on the number of papers authored and international awardswon by each institution.The new rankings, by contrast, use up to seven indicators toevaluate an institution in each subject: PUB – the number of papers indexed in ScopusTOP25 – the number of world top 25% most cited papersTOP1 – the number of world top 1% most cited papersFWCI (Field Weighted Citation Index) – the number ofcitations received by an institution’s publications comparedwith the average number of citations received by all othersimilar publicationsIC – the extent of international co-authorshipCC – the percentage of publications with academic andcorporate or industrial co-authorsMCR – Most Cited ResearchersAWARD – several subjects also assess the number of staffwinning a significant awardU of T dominated the new engineering subject rankingsacross all Canadian institutions, taking the top spot inthree of the subjects. The new subject rankings are basedon a wider range of measures. Figure 6.1d shows a scoringanalysis of the three indicators that have historicallydetermined our standing in the ARWU Engineering ranking:Highly Cited Research (HiCi), Published Articles (PUB)and Articles in Top Journals (TOP). The Research Funding(Fund) indicator is only used for U.S. schools.82 Chapter 6: World Recognition by Rankings Annual Report 2017 Faculty of Applied Science & Engineering
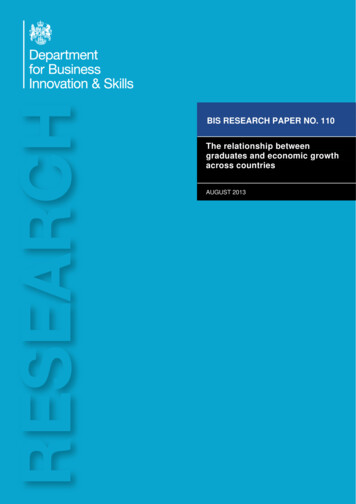
Figure 6.1e Canadian Universities in ARWU Subject RankingCivil EngineeringChemical EngineeringTorontoUUToronto39U Waterloo116U Ottawa121U AlbertaLaval UConcordia UU WaterlooUUTorontoToronto205781151U British Columbia88158U Alberta90U British Columbia164Western U98U Calgary170Materials EngineeringElectrical EngineeringU TorontoTorontoU27U Waterloo34U British Columbia61U Alberta88U Quebec123UUTorontoTorontoU Quebec42103McGill U123U Waterloo127Laval U135U Victoria156U British Columbia175McMaster U180McMaster U184Mechanical EngineeringU Quebec37U British Columbia62U Waterloo65TorontoUUToronto74U Alberta84McMaster U93McGill U156U Victoria167U Saskatchewan188New for 2017Figure 6.1eCanadian Universities in ARWU Subject Ranking, 2016Chapter:Excel Filename:Sheet:Date:Prepared by:Ch.6 - Rankings6.1e - Acad Ranking of World Univ - 2016 - Engineering - by Subject (AR17 6.1e) - v3.xlsx6.1eJune 20, 2017Geoff WichertFaculty of Applied Science & Engineering Annual Report 2017 Chapter 6: World Recognition by Rankings 83
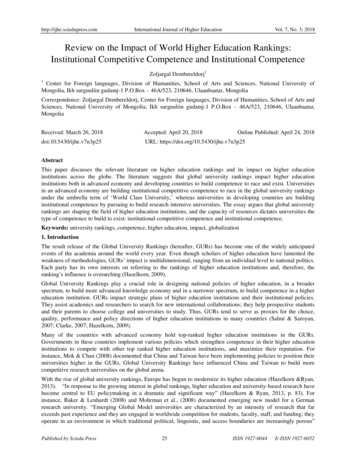
Times Higher Education (THE)–Elsevier World University Rankingfor Engineering and Information TechnologyFigure 6.2a THE Top 50 World Universities, 2016California Inst of TechStanford UU OxfordMassachusetts Inst of TechU CambridgePrinceton UImperial College LondonNational U SingaporeSwiss Federal Inst of Tech (ETH), ZürichU California, BerkeleyÉcole Polytech Fédérale de LausannePeking UGeorgia Inst of TechU California, Los AngelesCarnegie Mellon UU Illinois at Urbana-ChampaignU MichiganNanyang Tech UHong Kong U of Sci and TechDelft U of TechNorthwestern UCornell UTsinghua UU California, Santa BarbaraU Texas, AustinColumbia UPurdue UTech U MunichRWTH Aachen UKorea Adv Inst of Sci and Tech (KAIST)TorontoUUTorontoSeoul National UU Hong KongKU LeuvenU TokyoKTH Royal Inst of TechU ManchesterU College LondonU of Sci and Tech of ChinaPohang U of Sci and TechTech U BerlinJohns Hopkins UU WashingtonU California, San DiegoMonash UU Wisconsin, MadisonKyoto UPennsylvania State URice UU Southern CaliforniaIn 2016, the Times Higher Education(THE) marked its 10th year of publishing anEngineering and Information Technologyfield ranking with a succession of partners:first QS, then Thomson-Reuters, and mostrecently Elsevier. Throughout that time,U of T has remained both the top Canadianuniversity for engineering and among the top10 North American public universities, thisyear placing ninth.31THE is the second-longest-running surveyof its kind after the ARWU. What sets itapart as an influential assessment of global,research-intensive universities is the breadthof its evaluation, which aims to measureinstitutions across all their core missions:teaching, research, knowledge transfer andinternational outlook. The THE ranking uses13 performance indicators in five weightedcategories: Teaching: the learning environment (30%) Research: volume, income and reputation(30%) Citations: research influence (30%) International outlook: staff, students andresearch (7.5%) Industry income and innovation (2.5%)Figure 6.2aTimes Higher Education - Elsevier World University Ranking,Top 50 Universities for Engineering and Information Technology, 2016–201784 Chapter 6: World Recognition by Rankings Annual Report 2017 Faculty of Applied Science & EngineeringChapter: Ch.6 - RankingsExcel Filename: 6.2a-c - THE-Elsevier - 2016-17 Engineering Ranking (AR17 6.2a-c) - v3.xlsx
Figure 6.2b THE Top North American Public Universities, 2016U California, BerkeleyGeorgia Inst of TechU California, Los AngelesU Illinois at Urbana-ChampaignU MichiganU California, Santa BarbaraU Texas, AustinPurdue UUU TorontoTorontoU WashingtonU California, San DiegoU Wisconsin, MadisonPennsylvania State UMcGill UMcGillUOhio State UBritish ColumbiaColumbiaUUBritishU MinnesotaTexas A&M UU Maryland, College ParkU California, DavisUU WaterlooWaterlooVirginia Polytech Inst and State UAlbertaU AlbertaU Colorado, BoulderU DelawareNorth Carolina State UU Massachusetts914162123Figure 6.2c Canadian U15 Universities in THE Top 100, 2016UU TorontoTorontoMcGill UU British ColumbiaU WaterlooFigure6.2bU Alberta3152637884Times Higher Education - Elsevier World University Ranking,Top North American Public Universities for Engineering and Information Technology,2016–2017Chapter: Ch.6 - RankingsExcel Filename: 6.2a-c - THE-Elsevier - 2016-17 Engineering Ranking (AR17 6.2a-c) - v2.xlsxFigureSheet:6.2c 6.2bDate: June20, 2017 - Elsevier World University Ranking,Times HigherEducationPrepared by: Geoff WichertCanadian U15 in Top 100 Universities for Engineering and Information Technology,2016–2017U TorontoU British ColumbiaChapter:Excel Filename:Sheet:Date:Prepared by:McGill UCh.6 - RankingsU Waterloo6.2a-c - THE-Elsevier - 2016-17 Engineering Ranking (AR17 6.2a-c) - v2.xlsx6.2cJune 20, 2017Geoff WichertFaculty of Applied Science & Engineering Annual Report 2017 Chapter 6: World Recognition by Rankings 85
QS World University Rankings for Engineering and TechnologyFigure 6.3a QS Top 50 World Universities, 2017Figure 6.3b QS Top North American PublicUniversities, 2017U California, BerkeleyMassachusetts Inst of TechStanford UU CambridgeNanyang Tech USwiss Fed Inst of Tech (ETH), ZürichImperial College LondonNational U SingaporeU California, BerkeleyU OxfordTsinghua UU TokyoÉcole Polytech Féd, LausanneHarvard UKorea Adv Inst Sci & Tech (KAIST)Hong Kong U of Sci & TechGeorgia Inst of TechCalifornia Inst of TechTokyo Inst of TechPeking UDelft U TechSeoul National UKyoto UNational Taiwan UTech U MünchenShanghai Jiao Tong UPolitecnico di MilanoU Hong KongU MelbourneRoyal Inst of Tech (KTH)U California, Los AngelesU New South WalesCarnegie Mellon URhein-Westfäl Tech Hoch, AachenTorontoU TorontoUniversiti MalayaTech U BerlinPrinceton UU Illinois, Urbana-ChampaignNational Tsing Hua UKarlsruher Inst für TechU SydneyZhejiang UTech U DenmarkU Texas, AustinMonash UAustralian National UFudan UCornell UU MichiganChinese U Hong KongGeorgia Inst of TechU California, Los AngelesUU TorontoToronto4U Illinois, Urbana-ChampaignU Texas, AustinU MichiganUUBritishBritish ColumbiaColumbia8Purdue UUU WaterlooWaterloo10McGillUMcGill U11U WashingtonPennsylvania State UU Wisconsin, MadisonU California, San DiegoTexas A&M UVirginia Polytechnic InstU California, Santa BarbaraU California, DavisU MinnesotaUU AlbertaAlberta21North Carolina State UMontréalU Montréal23Ohio State UMichigan State U34Figure 6.3bQS World University Rankings, Top North AmeriEngineering and Information Technology, 2016U of T Engineering rose 15 places in the most recentChapter: Ch.6 - RankingsQS World UniversityRankings for Engineering andExcel Filename: 6.3a-c - QS World Ranking 2016Information Technology, bringingus back into theSheet: 6.3brange of our typical rankingDate:sinceJune2010.20, 2017Prepared by: Geoff WichertOur standing among North American publicuniversities also rose to fourth place, the highest wehave been among these peer institutions.Figure 6.3c Canadian U15 Universities inNationally, it was encouraging to see all our U15QS Top 200, 2017peers improve their rankings significantly over theFigure 6.3aprevious rankings period. Even so, U of T was theTorontoU TorontoQS World University Rankings,34Top 50 Universitiesforonly Canadianuniversity to make the QS top 50 forU British Columbia53 Technology, 2016Engineering and Informationthe third year in a row.U Waterloo60McGill U63Chapter:U AlbertaExcel Filename:U MontréalSheet:Date:Prepared by:Ch.6 - Rankings1446.3a-c - QS World Ranking 2016 - Engineering (AR17 6.3a-c) - v2.xlsx1586.3aJune 20, 2017Geoff Wichert86 Chapter 6: World Recognition by Rankings Annual Report 2017 Faculty of Applied Science & Engineering
Figure 6.3d Canadian Universities in QS by Subject, 2017Civil & Structural EngineeringChemical EngineeringU British Columbia3047TorontoUUToronto3148U WaterlooTorontoUUToronto34McGill UU British ColumbiaU Waterloo53McGill U81U Alberta89U AlbertaMcMaster U104U Calgary71114140U Calgary128U Montréal148Queen's U137McMaster U162U Montréal149Queen's U167U Ottawa153Western U171Concordia UElectrical & Electronic EngineeringComputer Science & Information Systems23TorontoUUTorontoU British Columbia31U WaterlooTorontoUUTorontoU British Columbia10U WaterlooMcGill UU Alberta109U AlbertaU Montréal115U MontréalU Calgary123Queen's U304558McGill U54Simon Fraser U196167Materials Sciences84116162164Queen's U188Concordia U190Mechanical, Aeronautical & ManufacturingEngineeringMcGill U45UUTorontoTorontoUU TorontoToronto49McGill U3239U British Columbia73U British Columbia82McMaster U82U Waterloo106U WaterlooU AlbertaU Montréal98McMaster U123112U Montréal133133Queen's UU Alberta170Queen's UMineral & Mining EngineeringMcGill U6Queen's U6U British Columbia6TorontoUUToronto17U Alberta18Laval U36154184With the inclusion of the Mineral & Mining Engineering fieldfor the first time, we are now recognized as the top Canadianengineering school in four out of seven engineering andinformation technology subjects (Chemical Engineering,Computer Science & Information Systems, Electrical& Electronic Engineering, Mechanical, Aeronautical &Manufacturing Engineering) and second in two othersubjects (Civil & Structural Engineering, Materials Science),demonstrating our strength across a range of disciplines.Faculty of Applied Science & Engineering Annual Report 2017 Chapter 6: World Recognition by Rankings 87
National Taiwan University (NTU) Performance Ranking of Engineering PapersU of T Engineering ranked 43rd globally and first in Canadain the National Taiwan University Performance Ranking ofEngineering Papers. We also placed ninth among the toptier of North American public universities. NTU uses thepublication of engineering papers to identify and comparethe top 200 universities in the world by subject.NTU’s ranking is based on eight weighted criteria groupedinto three broad categories:Research Productivity Total number of articles published in the past 11 years(2005–2015) [10%] Total number of articles published in the most recent yearreported (2015) [15%]Research Impact Total number of citations in the past 11 years (2005–2015)[15%] Total number of citations in the past two years (2014–2015)[10%] Average annual number of citations over the past 11 years(2005–2015) [10%]Research Excellence H-index (measures productivity and impact of publishedwork) of the past two years (2014–2015) [10%] Number of highly cited papers in the past 11 years(2005–2015) [15%] Number of papers published in high-impact journals in thecurrent year (2015) [15%]Figure 6.4a N TU Top 50 World Universities, 2016Tsinghua UNanyang Tech UNational U, SingaporeHarbin Inst of TechMassachusetts Inst of TechShanghai Jiao Tong UU California, BerkeleyZhejiang UGeorgia Inst of TechStanford UHuazhong U Sci & TechCity U Hong KongU Chinese Acad of SciencesU Sci &Tech of ChinaSwiss Fed Inst of Tech, LausanneU Texas, AustinXian Jiaotong UImperial College LondonHarvard UPeking USeoul National UU Illinois, Urbana-ChampaignTianjin UU CambridgeU Michigan, Ann ArborSwiss Fed Inst of Tech, ZurichKorea Adv Inst of Sci and TechSoutheast UHong Kong Polytechnic UPennsylvania State U, Univ ParkSouth China U of TechDalian U of TechU California, Los AngelesNorthwestern UDelft U of TechTech U DenmarkBeihang UFudan UNational Taiwan UPurdue U, West LafayetteU ChicagoU TokyoTongji UUU TorontoTorontoTohoku UU New South WalesCentral South UTexas A&M U, College StationU California, San DiegoU OxfordFigure 6.4b NTU Top North American PublicUniversities, 201643U California, BerkeleyGeorgia Inst of TechU Texas, AustinU Illinois, Urbana-ChampaignU Michigan, Ann ArborPennsylvania State U, Univ ParkU California, Los AngelesPurdue U, West LafayetteUU TorontoTorontoTexas A&M U, College StationU California, San DiegoU Washington, SeattleU Maryland, College ParkU California, Santa BarbaraUU WaterlooWaterlooNorth Carolina State UOhio State U, ColumbusBritish ColumbiaColumbiaUUBritishU Minnesota, Twin CitiesU AlbertaAlbertaUU Wisconsin, MadisonU FloridaU California, DavisArizona State UU Tennessee, KnoxvilleMcGill UMcGillUMichigan State UU MontréalMontréalUU Pittsburgh, PittsburghU California, Riverside88 Chapter 6: World Recognition by Rankings Annual Report 2017 Faculty of Applied Science & Engineering91518202628
Figure 6.4c Canadian U15 Universities in NTUTop 200, 2016In NTU’s rankings of engineering and informationtechnology subject areas (Figure 6.4d), U of TEngineering placed first among Canadianinstitutions in four out of six subject rankings. Weare among the top 50 globally in Computer Scienceand in Civil, Electrical and Mechanical Engineering.UU TorontoToronto4365U WaterlooU British Columbia88U Alberta90McGill U139U Montréal167Western U190Figure 6.4d Canadian Universities in NTU by Subject, 2016Chemical EngineeringU WaterlooU AlbertaU British ColumbiaTorontoUUTorontoWestern UU CalgaryMcGill UU OttawaCivil Engineering567882110160163190196Computer ScienceElectrical EngineeringU WaterlooUU TorontoToronto3641U British Columbia43U Alberta60U Montréal97McGill U126Simon Fraser U137Western U146U OttawaConcordia U170181Materials ScienceU TorontoTorontoUU WaterlooMcGill UU AlbertaFigure 6.4cUU TorontoToronto Canadian Universities in NTU Top35 200, 20U British Columbia40U Waterloo70U Alberta82U Montréal90Chapter: Ch.6 - RankingsMcGill U119Excel Filename: 6.4a-d - NTU Acad Papers - 2016 EngineerinConcordia U1486.4cLavalSheet:U149Western UDate: June 20, 2017172Prepared by: Geoff WichertU Saskatchewan184188Ryerson UU TorontoTorontoUU WaterlooU AlbertaU British ColumbiaMcGill UU MontréalConcordia URyerson UMcMaster UU OttawaWestern UU Victoria29323451109120148153160160162198Mechanical Engineering62131132167U TorontoTorontoUU British ColumbiaMcGill UU WaterlooU AlbertaU MontréalMcMaster UWestern URyerson U47777893142150165180189Faculty of Applied Science & Engineering Annual Report 2017 Chapter 6: World Recognition by Rankings 89
Rankings Based on Publications and CitationsFigure 6.5a Number of Engineering Publications Indexed by Thomson Reuters for Association ofAmerican Universities (AAU) Public and Canadian Peer Institutions, 2011 to sper FacultyRank on Pubper FacultyFigure 6.5b Summary of U15 Bibliometricsfor 214197PublicationsGeorgia Inst of TechU MichiganU California, BerkeleyU Illinois, Urbana-ChampaignPurdue UTexas A&M U, College StationPenn State UU Texas, AustinU WaterlooWaterlooUU TorontoTorontoUU AlbertaAlbertaUU Maryland, College ParkU California, San DiegoU FloridaMcGill UMcGillOhio State UBritish ColumbiaColumbiaUUBritishU Wisconsin, MadisonU California, Los AngelesU Minnesota, Twin CitiesMontréalUU MontréalU California, DavisU WashingtonIowa State UU Colorado, BoulderMichigan State UMcMaster UMcMasterU CalgaryCalgaryUU California, Santa BarbaraWestern UWesternRutgers State UU PittsburghU ArizonaU California, IrvineQueens UQueen'sU OttawaOttawaULavalUULavalU ManitobaU VirginiaSUNY, BuffaloSaskatchewanUUSaskatchewanU ManitobaManitobaUU Missouri, ColumbiaDalhousie UDalhousieSUNY, Stony BrookU IowaU North Carolina, Chapel HillU KansasIndiana U, BloomingtonU California, San FranciscoU OregonU Waterloo2,8552889.96U Toronto2,65724610.85U Alberta2,57119513.23McGill U2,24614315.71U British Columbia2,21518611.94U Montréal1,7512556.913McMaster U1,3991509.47U Calgary1,3901578.98Western U1,3089613.62Queen’s U9781297.612U Ottawa9641247.811Laval U9341625.815U Saskatchewan758888.79838.410976.514U Manitoba700Figure 6.5aU630Number of Engineering Publications IndexedDalhousieby ThomsonReutersAssociation of American Universities (AAU) Public and Canadian PeerInstitutions, 2011 to 2015Note 6.5 and 6.6: Faculty counts are based on data from the Engineers Canada Resources Report (2015) Publication and citation data fromThomson Reuters InCitesTM, updated March 11, 2017.Chapter: Ch.6 - RankingsFigure 6.5bExcel Filename: 6.5 6.6 - Engineering Bibliometrics 2011 to 2015 (AR176.5 6.6)v2.xlsxSummaryof -U15Bibliometrics for PSheet: 6.5a90 Chapter 6: World Recognition by Rankings Annual Report 2017 Faculty of Applied Science & Engineering
The Association of American Universities (AAU) index measures research output, productivity and intensity based onpublication counts. Once again, U of T Engineering ranked 10th in North America and second in Canada, based on a totalpublication count of 2,657 papers between 2011 and 2015.The AAU index citation counts are based on the total number of papers cited over a five-year period, as well as the frequencyof citations per faculty member and articles. U of T Engineering placed first in Canada and 10th among North Americanpublic institutions in the total number of citations. As in the past two years we ranked third in Canada for citations perfaculty after McGill University and Western University and retained the lead among Canadian universities in the number ofcitations per publication, which is the metric representing the relevance of our publications as cited by other researchers.Figure 6.6a Number of Engineering Citations Indexed by Thomson Reuters for Association ofAmerican Universities (AAU) Public and Canadian Peer Institutions, 2011 to 2015Rank on Citationsper FacultyCitations perPublicationRank on Citationsper PublicationBibliometricsCitationsper FacultyFacultyCountCitationsGeorgia Inst of Tech60,235U California, Berkeley54,668U Illinois, Urbana-Champaign43,045U Michigan42,946U Texas, Austin34,867U California, Los Angeles32,176Purdue U31,391Penn State U30,682U California, Santa Barbara28,703U TorontoTorontoU27,710Texas A&M U, College Station27,055U California, San Diego27,016U WaterlooWaterloo26,970UU Washington24,546U Maryland, College Park23,114Figure 6.6b Summary of U15U Florida22,216for CitationsU Wisconsin, Madison20,856U AlbertaAlbertaU20,768Ohio State U20,098U Minnesota, Twin Cities19,958McGill U17,703McGillBritish ColumbiaColumbia17,182UUBritishU Colorado, Boulder16,618U California, Davis15,872U MontréalMontréal14,390UU Toronto27,710246Rutgers State U13,561Iowa State U12,639U Waterloo26,970288Western U12,619WesternMichigan State U12,526U Alberta20,768195U Pittsburgh12,323McGill U17,703143McMaster U10,755McMasterU California, Irvine10,521U British Columbia17,182186U CalgaryCalgary10,079UU Arizona9,439U Montréal14,390255U OttawaOttawa8,056UWestern U12,61996Queens U7,996Queen'sU Virginia7,957McMaster U10,755150SUNY, Buffalo7,848LavalU7,691ULavalU Calgary10,079157Saskatchewan6,939UUSaskatchewanU Ottawa8,056124U North Carolina, Chapel Hill6,898SUNY, Stony Brook5,915Queen’s U7,996129U ManitobaManitoba 5,075UDalhousie U 4,573DalhousieLaval U7,691162U Missouri, Columbia 4,503U Saskatchewan6,93988U Iowa 4,452U Kansas3,186U Manitoba5,07583U California, San Francisco1,934Indiana U, Bloomington1,648Dalhousie U4,57397U 1547.1157.313Faculty of Applied Science & Engineering Annual Report 2017 Chapter 6: World Recognition by Rankings 91Figure 6.6a6.6bNumber of Engineering Citations Indexed by Thomson FigureReuters
Summary of Ranking ResultsIn 2016, U of T Engineering remained the top Canadian university, and the only Canadian institution within the global top50, across all the rankings. Among North American public universities, we ranked in the top 10 in three of the four rankingsystems. Although no ranking can decisively illustrate a school’s performance, our high rankings enhance our ability toattract top faculty, researchers and students from around the world.Figure 6.7 S ummary of University of Toronto Engineering Performance in World RankingsRelease DateCanadaNorthAmericanPublicWorldAcademic Ranking of World Universities for Engineering (ARWU) forEngineering / Technology and Computer SciencesAugust 201611450ARWU Scoring Detail by CategoryAugust 2016 Highly Cited (HiCi)11546 Publications (PUB)2967 Publications in Top Journals (TOP)1175711039Ranking OrganizationARWU Subject Ranking [New for 2016]June 2016 Chemical Engineering Civil Engineering31681 Electrical & Electronic Engineering11027 Energy Science & Engineering933162 Environmental Science & Engineering21025 Materials Science & Engineering11042 Mechanical Engineering42274September 20161931QS World University Rankings for Engineering and TechnologyMarch 2
rankings. It has provided overall rankings since 2003 and engineering field rankings since 2007. For much of the past decade, U.S. schools dominated the top 10 engineering school rankings. In 2016, five of those schools were displaced by four Asian and one Middle Eastern university that had each climbed, on average, 16 places to get there.