Transcription
St. Cloud State UniversityThe Repository at St. Cloud State UniversitySt. Cloud Area Quarterly Business ReportJournals and Newsletters7-1-2005St. Cloud Area Quarterly Business Report, Vol. 7,No. 2King BanaianSt. Cloud State University, kbanaian@stcloudstate.eduRichard A. MacDonaldSt. Cloud State University, macdonald@stcloudstate.eduFollow this and additional works at: http://repository.stcloudstate.edu/scqbrPart of the Business Commons, and the Economics CommonsRecommended CitationBanaian, King and MacDonald, Richard A., "St. Cloud Area Quarterly Business Report, Vol. 7, No. 2" (2005). St. Cloud Area QuarterlyBusiness Report. Paper 6.http://repository.stcloudstate.edu/scqbr/6This Newsletter is brought to you for free and open access by the Journals and Newsletters at The Repository at St. Cloud State University. It has beenaccepted for inclusion in St. Cloud Area Quarterly Business Report by an authorized administrator of The Repository at St. Cloud State University. Formore information, please contact kewing@stcloudstate.edu.
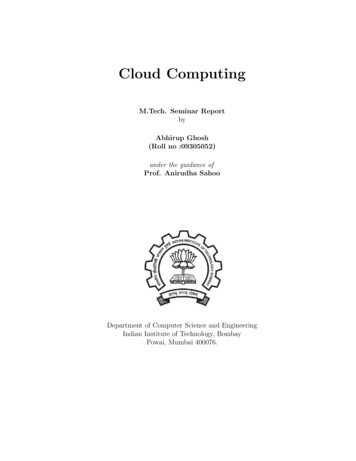
qst. cloud areauarterlybusiness reportVOL. 7, ISSUE 2 JULY 2005AREA’S SLOW GROWTH CONTINUESIncrease in employment is slight compared with past expansionsexecutive summaryThe St. Cloud-area economy continuesto expand despite signs of slowing employment growth.Employment increased at a rate of 0.9percent in the year ending in April asthe area economy created 879 jobs in 12months. Mixed signals point to a continuation of the slow and steady growth of thepast 20 months. Three of four componentsof the St. Cloud Area Index of LeadingEconomic Indicators fell in the Februaryto-April 2005 period. While help-wantedadvertising continues to surge, local housing starts are slowing from their frenetic2004 pace. The overall direction of thelocal index of leading economic indicatorscontinues to be upward, but we expect aslowing trend through summer.Fifty-eight percent of surveyed companies experienced improved economic con-index of leadingeconomic indicatorsSix-month moving average102December 2000 100100989694J S D M J S D M J S D M J S D M2004 ’05200120022003key results of surveyMay 200560Feb. 2005April 2004Diffusion index (% increase-% decrease)COLLABORATINGPUBLISHERS40200Center for Economic Education. Departmentof Economics. Social Science Research Institute.Current business Current national Current difficultyactivity for youractivityattracting qualifiedcompanyworkersditions in the recent quarter. Perceptionsof national business activity have expanded in the past three months, although thenet gain in national activity is the weakestreported by area companies since the September 2003 survey (the month in whicharea recovery is believed to have begun).Twenty-six percent of firms report moredifficulty hiring qualified workers. This isthe highest number for this measure of labor-market tightness since the June 2000survey. As the labor market tightens, firmsmay find it more difficult to find qualifiedworkers because of the lack of technicalskills in the work force. Fifty-two percentof firms report more than 80 percent oftheir employees use a computer at work.Special questions measure high-technology activity and the economic impact ofSt. Cloud State University.St. Cloud Area Economic Development Partnership.President: Tom Moore, (320) 656-3815.THE AUTHORSKING BANAIANChairmanRICH MACDONALDDirectorEconomics Department, Center forSt. Cloud State University Economic EducationSt. Cloud State University(320) 308-4797(320) 308-4781Also contributing:Brigid Tuck, program manager, Minnesota EconomicDevelopment Center, St. Cloud State University.INSIDEOUTLOOK SURVEYSPECIAL QUESTIONSDATA ANALYSISCAPITAL SPENDING,HIRING COULD RISE 34HOW MANY PEOPLE USECOMPUTERS AT WORK 36GROWTH SLOWSIN MOST SECTORS 38july 2005roi33
THE ST. CLOUD AREA BUSINESS OUTLOOK SURVEYcurrent conditionsTables 1 and 2 report the most recentresults of the business outlook survey. Responses are from 92 area businesses thatreturned the mailing in time to be included in the report. Participating firmsare representative of the diverse collectionof businesses in the St. Cloud area. Surveyresponses are strictly confidential.In the past three months, area businessesexperienced an interesting pattern of economic activity. While the diffusion indexon current business activity is about whatnormally occurs in our spring survey, otherresponses are irregular. The diffusion indexis the percentage of respondents indicatingan increase minus the percentage indicating a decrease.A diffusion index of 42.4 on the firstitem in Table 1 compares favorably to 19.3reported in the February 2005 survey, butthis is part of a normal seasonal pattern. Abetter comparison is with previous springsurveys. The value of this index was 53.7in spring 2004 (the highest recorded in thespring), -9.3 in spring 2003, 14.3 in spring2002 and -1.9 in spring 2001.An index of 22.8 on the current number of employees is somewhat larger thantable 1-currentbusiness conditionsthe normal response in the spring survey,as is the value of 18.5 on length of workweek. Capital expenditures continued tobe strong, although this index probablyreached its peak one year ago.The current prices-received index, at35.9, is the highest recorded on this item.Rising energy costs, increases in providingemployee health insurance, heightenedlabor-market tightness and a depreciationof the dollar are among causes of cost-induced price increases. Firms also may beexperiencing more pricing power.The pricing environment is markedly different from two years ago. In the June 2003business outlook survey, more than onethird of surveyed businesses indicated theywere moderately or extremely concernedwith the prospect of potential deflation!The largest movement of survey items in12 months has been in national businessactivity and difficulty of attracting qualifiedworkers. The diffusion index on current national business activity shows the weakestvalue since September 2003, and the indexon difficulty attracting qualified workers isthe highest recorded in almost five years.While national conditions appear to beslowing (most likely because of monetarytightening by the Federal Reserve), theslack in the local labor market has beenlargely absorbed for qualified workers. Itremains to be seen whether Fed efforts todampen inflationary pressures and a slowing of the national economy will moderatesome of the labor-market tightness that haspicked up in recent months.future conditionsArea business leaders are predictably optimistic about their firms’ prospects going forward six months. Sixty-four percent of survey respondents expect increased businessactivity six months from now. The diffusionindex on the level of future business activityis 56.5 — significantly lower than observedin February (a normal seasonal effect) andslightly lower than the 59.2 value reportedin the April 2004 survey. When comparedwith results of other spring surveys, the figures reported in Table 2 are mixed.Thirty-eight percent of respondingfirms plan to increase hiring in the next sixmonths, and a similar percentage expect toincrease capital spending. It should be notedthat the diffusion index on number of future employees and length of workweek areslightly lower than one year ago. On theMay 2005 vs. Three months agoDecrease (%)No Change (%)Increase (%)Diffusion Index3February 2005Diffusion Index3What is your evaluation of:Level of business activityfor your company15.227.257.642.419.3Number of employeeson your company’s payroll9.857.632.622.818.3Length of the workweekfor your employeesCapital expenditures (equipment,machinery, structures, etc.)by your companyEmployee compensation (wagesand benefits) by your 21.171.716.125.010.0Prices received foryour company’s productsNational business activityYour company’s difficultyattracting qualified workersNotes: (1) reported numbers are percentages of businesses surveyed. (2) rows may not sum to 100 because of “not applicable” and omitted responses. (3) diffusion indexes represent thepercentage of respondents indicating an increase minus the percentage indicating a decrease. A positive diffusion index is generally consistent with economic expansion.Source: SCSU Center for Economic Education, Social Science Research Institute and Department of Economics34roijuly 2005
What is affectingyour company?other hand, the capital expenditures andprices-received indexes are somewhat higherthan last spring. (To compare, the capital exSurvey respondents were asked topenditures index in spring 2002 — during acommenton special factors influencinglocal recession — was only 12.2).their business. Comments include:In April 2004 we reported a future-con “(Our) business requires one-yearditions index on national business condiminimum training for (basic positions)tions of 25.9. The value of 20.7 for thisplus additional (training) for (moreitem in Table 2 is further evidence of weakadvanced positions).”ness in national activity. “Customized training is going ‘gangbusters’ for us. There is a significantBy far, the largest difference between thisshift in employee training since 9-11.”quarter’s survey and one conducted a year “Retail business, in general, isago is in the index on expected difficultyslow. Factors are higher energy and gasattracting qualified workers. Last spring,costs.”the diffusion index on this item was 13 “There is an overabundance of job(with 17 percent of respondents expectapplicants with four-year degrees anding increased difficulty attracting qualifieda shortage of applicants with technicalskills and common sense.”workers). The index for this quarter is 25, “Decrease in housing purchases;with no area businesses expecting decreasedlackof industry development in St. Clouddifficulty attracting qualified workers in sixwithhigher-paying jobs to a ord houses;months’ time.high Minnesota taxes deter industry.”The anticipated worker shortage is broad “The issue of increasing health-carebased. None of the 92 firms responding toand prescription costs is still a concern.the survey expects a moderation of thisWhile it has slowed, it is still too high.”perceived shortage of qualified workers. “Increasing local competition;ROI CHECKLISTmedical cuts to physicians.”Compare this with the conditions observed “We are a cyclical business; morein the September 2001 survey (about theSue Halenathan50 percent of our sales volumetime the area economy entered recession).is in the first three and a half months.At that time, only 6 percent of firms exTemporary employees and long workpected increased difficulty attracting qualihours end at 4/15 each year.”fied workers while 20 percent expected lesstable 2-futurebusiness conditionsdifficulty attracting qualified workers. Thisquestion has proved a strong indicator ofarea labor-market conditions during theseven years of the survey.special questionsWe have noted in recent quarters thatarea businesses have reported plans to expand capital investment. The 1990s saw apersistent boom in investment that had notbeen seen the previous two decades. Mostobservers would attribute the 1990s investment boom, particularly in the latter halfof the decade, to the spread of informationtechnology. There was a surge in investmentbefore 2000 as firms prepared for the Y2Kproblems everyone expected. When Y2Kfears failed to materialize, investment in ITsagged in 2000-01, contributing to the national recession. More than half of the 8.8percent decline in investing in equipmentand software in 2001 was attributable to adecrease in investment in IT.According to a U.S. Census survey inSeptember 2001, 54 percent of Americans use a computer at work. Financialreturn on computer use is substantial.Initial surveys indicated that a workerwith a computer earned 15 percent to20 percent more than a similarly situated worker without one. But the returnSix months from now vs. May 2005Decrease (%)No Change (%)Increase (%)Diffusion Index3February 2005Diffusion Index3What is your evaluation of:Level of business activityfor your company7.625.064.156.566.0Number of employeeson your company’s payroll7.652.238.030.436.7Length of the workweekfor your employeesCapital expenditures (equipment,machinery, structures, etc.)by your companyEmployee compensation (wagesand benefits) by your 0071.725.025.023.9Prices received foryour company's productsNational business activityYour company’s difficultyattracting qualified workersNotes: (1) reported numbers are percentages of businesses surveyed. (2) rows may not sum to 100 because of “not applicable” and omitted responses. (3) diffusion indexes represent thepercentage of respondents indicating an increase minus the percentage indicating a decrease. A positive diffusion index is generally consistent with economic expansion.Source: SCSU Center for Economic Education, Social Science Research Institute and Department of Economicsjuly 2005roi35
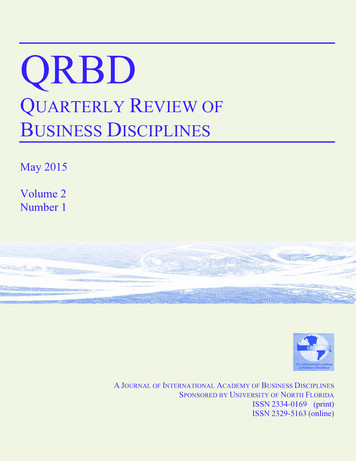
SPECIAL QUESTIONSto business from adding computers forworkers depends on the worker’s skills.QUESTION 1:Data from the U.S. Department of LaHOW MANY USE COMPUTERS?bor indicate that in 2001, 82.3 percentArea business leaders were asked toof workers that had a bachelor’s degreeindicate the percentage of their employeesor higher used a computer, but only 42.3who use a computerpercent of those without a four-year deat work. The share of a16.3%gree used one. Almost 80 percent of thosefirm’s work force that52.2%in managerial and professional occupauses a computer prob10.1%ably serves as a proxytions use a computer, but fewer than one7.6%for technical skills ofin four in nontechnical service occupa13.0%the work force.tions do so.Slightly more thanEven in precision manufacturing, the52 percent of respon0-20% of employeesrate of computer use is less than 30 percent.dents indicate thatmore than 80 percent 21-40% of employees Much use of computing in manufactur41-60% of employeesof their employeesing comes from managers and profession61-80% of employeesuse a computer atals, not from production workers. (In the81-100% of employeeswork. Only 16.3 permanufacturing sector, use of computers iscent report fewer than 20 percent of theirabout half of its work force.)employees use a computer at work.The return to a worker’s wages from havAlmost 78 percent of St. Cloud-areainga computer, keeping education, agejobs are in service-providing industries. Agrowing share of area jobs are rotating toand other factors constant, was 31.4 percomputer-intensive sectors such as infor- cent of his or her wage if that worker hasmation, financial activities, professionala bachelor’s degree or more, about doubleand business services, and educationthe premium for those with a computerand health care. In April 2005, these fourbut without a bachelor’s degree.1sectors had a 27.8 percent share of areaU.S. Census data show education levelsemployment compared with 23.3 percentin the St. Cloud-area work force have im15 years ago. The results of this specialquestion are a reminder to area workers of proved since 1990 but remain lower thanthe need to constantly upgrade technicalthe nation as a whole, based on high schoolskills to avert the structural unemployand college graduation rates. More than 24ment that can befall those who lose jobs inpercent of the nation’s work force had atdeclining industries.least a bachelor’s degree in 2000, comparedQUESTION 2:with 21 percent locally. Educational limitaHIGH-TECH SPENDINGtions could prevent St. Cloud-area workersThe response to the second specialquestion suggests somewhere between 21 from benefiting as much as other parts ofpercent and 40 percent of the typical area the nation from the introduction of computers.firm’s capital budget is spent on “hightech equipment.”Nationwide, 32 percent of firms’ capital4.3%Indeed, 36 percentbudgetis spent on high-tech equipment12.0%of responding firmsand software ( 571.9 billion invested inindicate less than35.9%nonresidential information processing and17.4%20 percent of theirequipment out of total real private fixedcapital expendituresinvestment of 1.79 trillion in 2004).is on computers and29.3%software. We cannotIn comparison, only 100.7 billion wasbe sure if this type of0-20% of cap ex.spent on high-tech in 1990. Despite diffiinvestment is capital21-40% of cap ex.culties in making comparisons, the resultsbroadening — adding41-60% of cap ex.of the local survey seem quite consistenthigh-tech equipment61-80% of cap ex.with what is observed for the nation as ato additional workers81-100% of cap ex.whole.— or capital deepening — adding more high-tech equipment toAt least one academic study has suggestedthe workers who have computers. In addi- that, holding everything else constant withtion, if computer equipment turns over inin any given occupation, the percentage ofless than five years, we may already havereached an equilibrium amount of hightech purchases in the St. Cloud economy.36roijuly 2005wage differentialsSt. Cloud vs. MinnesotaIn 2003Health CareAg, Forestry, FishingPublic AdministrationUtilitiesEducationRetail TradeConstructionOther services (ex. pub adm)Transportation/WarehousingALL INDUSTRIESAdmin/Support Waste MgmtMiningAccom. & Food ServicesManagementFinance & InsuranceManufacturingProfessional/Tech ServicesReal EstateInformation Tech.Wholesale TradeArts, Entertain., .58%0.54%workers using a computer may account forwage differentials across geographic areasfor similar occupations. Commentatorshave often remarked on the wage differential in various occupations between theTwin Cities and St. Cloud. This differential can be rather large in some industries,while it is nonexistent in others.Overall wage differential between St.Cloud and the state as a whole was 21 percent in 2003 (through the third quarter).For each dollar of labor income earnedstatewide, the St. Cloud worker earned 79cents. For new hires, a St. Cloud worker received 67 cents to the Minnesota worker’sdollar.The figure above suggests the types ofworkers who frequently use computers suffered larger wage differentials than thosewho might use them less. Finance and insurance workers get 74 cents on the dollar;professional and technical services workersearn 69 cents.The notable exception is health care,where worker shortages may induce moreintense bidding for skilled workers. Business leaders in the area have embarked onan effort to bring the bioscience industryinto the area (particularly in manufacturing). The absence of the wage differentialwill help there, as will the presence of advanced technologies. But St. Cloud has along way to go in closing the wage gap.1See Rob Valetta and Geoffrey MacDonald, The Computer Evolution. Federal Reserve Bank of San Francisco Weekly Letter, July23, 2004. l2004-19.pdf.
economic impact of scsuA forthcoming study by researchersfrom St. Cloud State University will highlight the university’s impact on the St.Cloud-area economy.2 In addition to thequantitative predictions on area output,employment and spending, the impactstudy also looks at qualitative indicatorsof the impact.One set of indicators comes from themost recent business outlook survey. Weasked area business leaders to consider 20areas in which St. Cloud State might havean important influence on their company.Key results shown in the accompanying table indicate that area business leadersbelieve the university plays an importantrole in providing workers to the local labor pool. More than 40 percent of surveyrespondents indicate it is of moderate orlarge importance for their company to access St. Cloud State students for permanentand temporary employment positions. Inaddition, almost one-fourth of firms surveyed find access to university students forinternships to be of at least moderate importance.One-third of employers indicate theuniversity is important in recruiting employees. St. Cloud State contributes toarea businesses through cultural and athletic events. Undergraduate, graduate andemployee-training programs also are important to area firms. Finally, respondentsvalue partnerships with university departments, centers and colleges, as well as faculty consulting arrangements.The direct and indirect impact ofSt. Cloud State in Stearns and Bentoncounties is estimated at 315 million. Thisimpact comes from direct purchases of local products by the university as well asspending by students, faculty and visitors.Total employment related to St. CloudState is about 6,500 (1,470 university employees plus estimated indirect employment of 5,076). In total, St. Cloud State isresponsible for about 3 percent of all areaoutput and 5 percent of employment. Sectors of the area economy that receive themost economic benefit include retail, accommodations and food, real estate/rental,entertainment, finance and insurance andprofessional/management services.23the impact of scsuRespondents indicating “moderate” or “large” importanceSpending bySCSU employeesEmployee trainingAccess to SCSUcultural activitiesConsulting relationshipswith facultyStudent internshipsAccess to grad programsfor employeesPartnerships with SCSUEmployee access toundergrad programsSCSU helpfulto .7%Access to SCSU athletics33.7%Students asnonpermanent workersStudents aspermanent workers43.5%impact of electrolux45.7%There have been several pauses in production recently at the Electrolux HomeProducts plant in St. Cloud, including April11-15 and May 9-13. During the secondpause, the plant announced there would be130 employees laid off as of May 23.There is a significant risk that these areportents of a permanent shutdown. Withhelp of Brigid Tuck, program manager of theMinnesota Economic Development Center(MEDC) at St. Cloud State University, welooked at the impact of a possible closure.Electrolux’s financial performance in itsNorth American appliance group deteriorated in the first quarter of 2005. According to its first-quarter financial statementreleased April 20, this deterioration wasbecause of “substantially higher prices formaterials which were only partly offset byprice increases and an improved productmix. Income also was negatively impactedby costs referring to the ongoing transfer of(refrigerator) production to Mexico.”The company also is suffering from a decline in the U.S. dollar versus its Swedishhome currency. Appliance sales were down6.5 percent in North America, and overallinventories grew 45 percent faster in the firstquarter of 2005 as in 2004. It is evaluatingclosures in Sweden and Italy — productionof one Swedish plant has moved to Hungary — and Electrolux continues to spendmoney on moving refrigerator productionin North America to a plant in Mexico. 3When a significant manufacturer slowsproduction, it also begins to reduce its demands on providers of inputs or other business services. Many of the inputs receivedby Electrolux come from outside the localarea, but based on an input-output modelmaintained by MEDC, we believe about31 percent of the value in Electrolux’s output would be accounted for by local production. Some of these are provided orinduced from the rest of the area economy,including everything from warehousingand transportation to the caterer who parksa truck in front of the plant for employees’ breaks. Those groups also are adverselyaffected by the slowdown in production.The layoff of 130 employees from theplant likely generates 80 job losses elsewhere in the economy. Here is a breakdown of losses by sector: Wholesale trade: 20. Manufacturing (minus Electrolux): 15. Transportation and warehousing: 10. Professional and technical services: 6. Retail trade: 5. Administrative and waste service: 5. All others: 19.In all, 210 jobs lost results in a decreasein area employment (or a rise in local areaunemployment) of more than 0.2 percent.In April, new claims for unemploymentinsurance rose 75 percent in the four-countyarea, largely fueled by a rise in claims frommanufacturing workers. Claims more thandoubled in Benton and Stearns counties.In the worst-case scenario of a closure,the remaining 1,350 employees at Electrolux would become unemployed. The totalloss to the St. Cloud economy of this hypothetical scenario is estimated by MEDC tobe 2,178 jobs, including 200 in wholesaletrade, 100 in the transportation sector andanother 100 in the retail and restaurant sectors (combined). To put this in context, itwould wipe out the gains made in employment since the bottom of the St. Cloudarea recession in late summer 2003.The impact on the area economy wouldbe substantial. An Electrolux closure wouldreduce area output by more than 90 million. Besides jobs, this would likely slowgrowth of the retail corridor on the westend of St. Cloud and into Waite Park. ItSee Brigid Tuck and Rich MacDonald, Economic Impact of St. Cloud State University on the St. Cloud Area Economy, St. Cloud State University, 2005 (forthcoming).Data from Electrolux Interim Report January-March, Stockholm, April 20, 2005. Online at http://ir.electrolux.com/files/electrolux Q12005 en.pdf.july 2005roi37
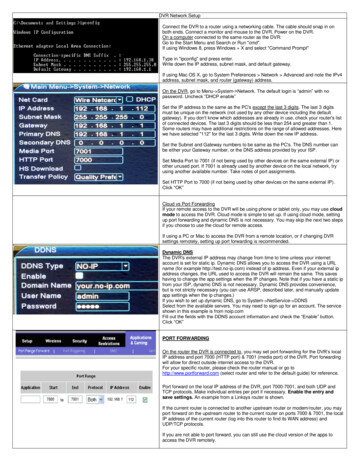
would reduce the level of local area government revenues, as tax receipts wouldbe slowed. Finally, home sales would likelyslow, perhaps decreasing residential construction and property values.This scenario is, of course, speculation onour part. And it should be noted that theimpact of a shutdown would not be felt allat once. The Fingerhut closure took aboutCHECKLIST18 months to be felt fully, and certain partse Halenaof the economy (such as the housing market) did not seem adversely affected. Nevertheless, as one of us (Banaian) noted inMarch at the SCSU Center for EconomicEducation’s Economic Outlook, Electroluxis a dark cloud on what would otherwiseseem a relatively bright forecast. May’s layoff announcements should be viewed asclouds intensifying.looking at the dataOutside of Electrolux, the local economycontinues to add workers at a steady (if unspectacular) pace, but there are other clouds.Table 3 shows continued slow expansionof private-sector employment to a yearover-year rate of 0.6 percent in April versus1.9 percent in January. Part of this is becauseof temporary layoffs at Electrolux. Servicesector employment softened as well, withslowing of employment growth occurringtable 3employmenttrendsyear-over-year privateemployment growthin all sectors of the St. Cloud economy except retail sales. Construction employment,a driving force in the local economy the pastfew years, has slowed in recent months.The accompanying figure supports the title of this issue of the St. Cloud Area Quarterly Business Report. Note that the currentexpansion has been marked by a weaknessof growth of private-sector employmentrelative to other local expansions. Lookingat the monthly year-over-year, private-sector employment growth numbers for theSt. Cloud MSA, there has not been a singlemonth in which employment has grownmore than 2 percent for almost five years!Contrast this to the expansion of thelate 1990s, in which monthly private-sector employment growth topped 2 percentfrom September 1997 through September2000 (a span of 37 consecutive months).To be sure, this type of growth tends tofeed on itself, but so far, the area economyhas not experienced the sustained spurt ofprivate-sector employment growth that isnecessary to return us to the more desirableeconomic climate of the late 1990s.The data in Table 4 indicate unemployment rose in April versus a year ago. Noteemployment growth reported here is fromthe Bureau of Labor Statistics’ householdsurvey rather than the payroll survey dataSt. Cloud Metropolitan Statistical Area (Stearns and Benton)7%2%-3%’91 ’92 ’93 ’94 ’95 ’96 ’97 ’98 ’99 ’00 ’01 ’02 ’03 ’04 ’05Source: Minnesota Department of Employment andEconomic Developmentshown in Table 3. There was a substantialincrease in the growth of the labor force inSt. Cloud, as workers may have been attracted by increasing wages to come backinto the labor force. Thus, while civilianemployment from the household surveysped up from 1.7 percent to 2.0 percent between January and April, it was not enoughto reduce the unemployment rate.For the first time in recent memory, newhousing starts are slowing in the area, whichcorroborates the Table 3 data showing declining employment in the local construction sector. This in part comes from a largenumber of starts in April 2004, with 181units started that month versus 125 in April2005 and 115 in April 2003. Given that theweather this April was near-normal for precipitation and temperature, we will followthis information closely to see whether theconstruction boom that accelerated withSt. Cloud (Stearns and Benton)13-county Twin Cities areaMinnesotaApril 0515-year trend April 04-April 05employmentgrowth rategrowth rateshareApril 0515-year trend April 04-April 05employmentgrowth rategrowth rateshareApril 0515-year trend April 04-April 05employmentgrowth rategrowth rateshareTotal nonagriculturalTotal %85.0%1.6%0.8%85.7%1.7%1.0%84.3%Goods producingConstruction/natural 0.9%17.4%-0.3%1.7%11.7%0.1%1.6%12.8%Service ade/transportation/utilitiesWholesale 5%4.8%1.3%1.5%4.9%1.4%0.7%4.8%Retail tradeTrans./ware/utilitiesInformationFinancial .3%1.2%6.6%Professional & business serviceEducational & healthLeisure & 2.0%1.7%8.9%1.9%1.8%8.7%Other services (
st. cloud area business report VOL. 7, ISSUE 2 JULY 2005 quarterly AREA'S SLOW GROWTH CONTINUES Increase in employment is slight compared with past expansions THE AUTHORS KING BANAIAN Chairman Economics Department, St. Cloud State University (320) 308-4797 RICH MACDONALD Director Center for Economic Education St. Cloud State University (320 .