Transcription
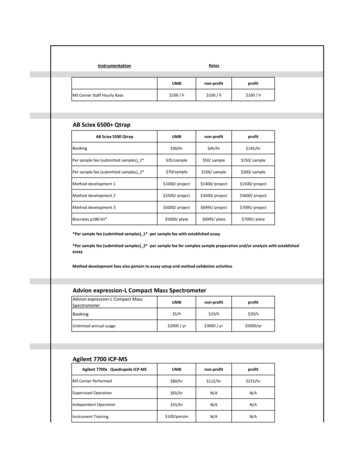
Determining Sample SizePage 2Using A Sample Size Of A Similar StudyFigure 1.Samples.Distribution of Means for RepeatedAnother approach is to use the same sample sizeas those of studies similar to the one you plan.Without reviewing the procedures employed in thesestudies you may run the risk of repeating errors thatwere made in determining the sample size for anotherstudy. However, a review of the literature in yourdiscipline can provide guidance about "typical" samplesizes which are used.Using Published TablesDegree Of VariabilityThe third criterion, the degree of variability in theattributes being measured refers to the distribution ofattributes in the population. The more heterogeneousa population, the larger the sample size required toobtain a given level of precision. The less variable(more homogeneous) a population, the smaller thesample size. Note that a proportion of 50% indicatesa greater level of variability than either 20% or 80%.This is because 20% and 80% indicate that a largemajority do not or do, respectively, have the attributeof interest. Because a proportion of .5 indicates themaximum variability in a population, it is often usedin determining a more conservative sample size, thatis, the sample size may be larger than if the truevariability of the population attribute were used.STRATEGIES FOR DETERMININGSAMPLE SIZEThere are several approaches to determining thesample size. These include using a census for smallpopulations, imitating a sample size of similar studies,using published tables, and applying formulas tocalculate a sample size. Each strategy is discussedbelow.Using A Census For Small PopulationsOne approach is to use the entire population asthe sample. Although cost considerations make thisimpossible for large populations, a census is attractivefor small populations (e.g., 200 or less). A censuseliminates sampling error and provides data on all theindividuals in the population. In addition, some costssuch as questionnaire design and developing thesampling frame are "fixed," that is, they will be thesame for samples of 50 or 200. Finally, virtually theentire population would have to be sampled in smallpopulations to achieve a desirable level of precision.A third way to determine sample size is to rely onpublished tables which provide the sample size for agiven set of criteria. Table 1 and Table 2 presentsample sizes that would be necessary for givencombinations of precision, confidence levels, andvariability. Please note two things. First, thesesample sizes reflect the number of obtained responses,and not necessarily the number of surveys mailed orinterviews planned (this number is often increased tocompensate for nonresponse). Second, the samplesizes in Table 2 presume that the attributes beingmeasured are distributed normally or nearly so. Ifthis assumption cannot be met, then the entirepopulation may need to be surveyed.Using Formulas To Calculate A Sample SizeAlthough tables can provide a useful guide fordetermining the sample size, you may need tocalculate the necessary sample size for a differentcombination of levels of precision, confidence, andvariability. The fourth approach to determiningsample size is the application of one of severalformulas (Equation 5 was used to calculate thesample sizes in Table 1 and Table 2).
Determining Sample SizePage 3Table 1. Sample size for 3%, 5%, 7% and 10%Precision Levels Where Confidence Level is 95% andP .5.Size ofPopulationSample Size (n) for Precision (e) of: 3% 5% 7%Table 2. Sample size for 5%, 7% and 10% PrecisionLevels Where Confidence Level is 95% and P .5.Size ofSample Size (n) for Precision (e) of:Population 10% 5% 7% 087397204100100,0001,099398204100 100,0001,111400204100a Assumption of normal population is poor (Yamane,1967). The entire population should be sampled.Formula ForProportionsCalculatingASampleTo illustrate, suppose we wish to evaluate a statewide Extension program in which farmers wereencouraged to adopt a new practice. Assume there isa large population but that we do not know thevariability in the proportion that will adopt thepractice; therefore, assume p .5 (maximumvariability). Furthermore, suppose we desire a 95%confidence level and 5% precision. The resultingsample size is demonstrated in Equation 2.ForFor populations that are large, Cochran (1963:75)developed the Equation 1 to yield a representativesample for proportions.Which is valid where n0 is the sample size, Z2 is theabscissa of the normal curve that cuts off an area α atthe tails (1 - α equals the desired confidence level,e.g., 95%)1, e is the desired level of precision, p is theestimated proportion of an attribute that is present inthe population, and q is 1-p. The value for Z isfound in statistical tables which contain the areaunder the normal curve.Finite Population Correction For ProportionsIf the population is small then the sample size canbe reduced slightly. This is because a given samplesize provides proportionately more information for asmall population than for a large population. Thesample size (n0) can be adjusted using Equation 3.Where n is the sample size and N is the populationsize.
Determining Sample SizeSuppose our evaluation of farmers’ adoption ofthe new practice only affected 2,000 farmers. Thesample size that would now be necessary is shown inEquation 4.As you can see, this adjustment (called the finitepopulation correction) can substantially reduce thenecessary sample size for small populations.Page 4measure as the variance), and σ2 is the variance of anattribute in the population.The disadvantage of the sample size based on themean is that a "good" estimate of the populationvariance is necessary. Often, an estimate is notavailable. Furthermore, the sample size can varywidely from one attribute to another because each islikely to have a different variance. Because of theseproblems, the sample size for the proportion isfrequently preferred2.OTHER CONSIDERATIONSA Simplified Formula For ProportionsYamane (1967:886) provides a simplified formulato calculate sample sizes. This formula was used tocalculate the sample sizes in Tables 2 and 3 and isshown below. A 95% confidence level and P .5 areassumed for Equation 5.Where n is the sample size, N is the population size,and e is the level of precision. When this formula isapplied to the above sample, we get Equation 6.Formula For Sample Size For The MeanThe use of tables and formulas to determinesample size in the above discussion employedproportions that assume a dichotomous response forthe attributes being measured. There are twomethods to determine sample size for variables thatare polytomous or continuous. One method is tocombine responses into two categories and then usea sample size based on proportion (Smith, 1983).The second method is to use the formula for thesample size for the mean. The formula of the samplesize for the mean is similar to that of the proportion,except for the measure of variability. The formula forthe mean employs σ2 instead of (p x q), as shown inEquation 7.Where n0 is the sample size, z is the abscissa of thenormal curve that cuts off an area α at the tails, e isthe desired level of precision (in the same unit ofIn completing this discussion of determiningsample size, there are three additional issues. First,the above approaches to determining sample size haveassumed that a simple random sample is the samplingdesign. More complex designs, e.g., stratified randomsamples, must take into account the variances ofsubpopulations, strata, or clusters before an estimateof the variability in the population as a whole can bemade.Another consideration with sample size is thenumber needed for the data analysis. If descriptivestatistics are to be used, e.g., mean, frequencies, thennearly any sample size will suffice. On the otherhand, a good size sample, e.g., 200-500, is needed formultiple regression, analysis of covariance, or loglinear analysis, which might be performed for morerigorous state impact evaluations. The sample sizeshould be appropriate for the analysis that is planned.In addition, an adjustment in the sample size maybe needed to accommodate a comparative analysis ofsubgroups (e.g., such as an evaluation of programparticipants with nonparticipants). Sudman (1976)suggests that a minimum of 100 elements is neededfor each major group or subgroup in the sample andfor each minor subgroup, a sample of 20 to 50elements is necessary. Similarly, Kish (1965) says that30 to 200 elements are sufficient when the attribute ispresent 20 to 80 percent of the time (i.e., thedistribution approaches normality). On the otherhand, skewed distributions can result in seriousdepartures from normality even for moderate sizesamples (Kish, 1965:17). Then a larger sample or acensus is required.Finally, the sample size formulas provide thenumber of responses that need to be obtained. Manyresearchers commonly add 10% to the sample size tocompensate for persons that the researcher is unable
Determining Sample Sizeto contact. The sample size also is often increased by30% to compensate for nonresponse. Thus, thenumber of mailed surveys or planned interviews canbe substantially larger than the number required fora desired level of confidence and precision.ENDNOTES1. The area α corresponds to the shaded areas inthe sampling distribution shown in Figure 1.2. The use of the level of maximum variability(P .5) in the calculation of the sample size forthe proportion generally will produce a moreconservative sample size (i.e., a larger one) thanwill be calculated by the sample size of the mean.Page 5Israel, Glenn D. 1992. Sampling The Evidence OfExtension Program Impact. Program Evaluationand Organizational Development, IFAS,University of Florida. PEOD-5. October.Kish, Leslie. 1965. Survey Sampling. New York:John Wiley and Sons, Inc.Miaoulis, George, and R. D. Michener. 1976. AnIntroduction to Sampling. Dubuque, Iowa:Kendall/Hunt Publishing Company.Smith, M. F. 1983. Sampling Considerations InEvaluating Cooperative Extension Programs.Florida Cooperative Extension Service BulletinPE-1. Institute of Food and Agricultural Sciences.University of Florida.REFERENCESCochran, W. G. 1963. Sampling Techniques, 2nd Ed.,New York: John Wiley and Sons, Inc.Sudman, Seymour. 1976. Applied Sampling. NewYork: Academic Press.Yamane, Taro. 1967. Statistics, An IntroductoryAnalysis, 2nd Ed., New York: Harper and Row.
encouraged to adopt a new practice. Assume there is a large population but that we do not know the variability in the proportion that will adopt the practice; therefore, assume p .5 (maximum variability). Furthermore, suppose we desire a 95% confidence level and 5% precision. The resulting sample size is demonstrated in Equation 2.