Transcription
UNIVERSITIES AUSTRALIAHIGHER EDUCATION:FACTS AND FIGURESJULY 2019UN IVER SITIES AUSTR AL IA H IGH E R E D U CATION FACTS AND F IGU RE S1
This work is licensed under a Creative Commons Attribution 4.0 International Licence.Further inquiries should be made to the Chief Executive:GPO Box 1142 Canberra ACT 2601P: 61 (0)2 6285 8100E: stralia.edu.auABN 53 008 502 9302U NIV E R S IT I ES AU ST RALI A HIG HER EDUCAT ION FACTS AND F IGU RE S
UN IVER SITIES AUSTR AL IA H IGH E R E D U CATION FACTS AND F IGU RE S3
4U NIV E R S IT I ES AU ST RALI A HIG HER EDUCAT ION FACTS AND F IGU RE S
FOREWORDAs part of their mission, universities seek to inform public discussion with facts and evidence.In that spirit, every two years the peak body for Australia’s universities produces an updatedsnapshot of facts and figures about the nation’s higher education system.The growth in government funding into universities from 2008 to 2017 occurred as a result of thedecision to expand access to university education for more Australians than ever before.Government funding rose over that decade to expand student places, including for tens ofthousands more students from disadvantaged backgrounds.In December 2017, government funding for domestic undergraduate places at each universitywas frozen at the level of 2017 nominal dollars for 2018 and 2019.Given that the latest available data are for 2017, the impact of the funding freeze is not reflectedin this edition of Facts and Figures.Nonetheless, we commend this publication to you as an extremely valuable guide to manyaspects of Australia’s higher education system, its students, graduates, staff, researchexcellence and international rankings performance.We trust it makes a helpful contribution to evidence-based discussion.ProfessorDeborahTerry AOCatrionaJacksonChair,UniversitiesAustraliaChief Executive,UniversitiesAustraliaNote: the data in this report was current as at 15 July 2019.UN IVER SITIES AUSTR AL IA H IGH E R E D U CATION FACTS AND F IGU RE S5
CONTENTSCONTENTS61FUNDING AND UNIVERSITY FINANCES81.1Australian Government funding81.1.1Australian Government higher education outlays81.1.2Funding per Commonwealth supported place101.1.3Public vs private contribution for CSP101.1.4Other funding to support teaching and learning12International comparisons141.1.51.2Higher Education Loan Program (HELP)151.3University finances171.3.1Revenue by source171.3.2Expenditure by category171.3.3Universities’ financial position182STUDENTS202.1202.1.1Student profiles202.1.2Commencing and total Commonwealth supported places262.1.3Growth in student enrolments by equity group272.1.4Improvement in pathway and flexibility282.1.5Commonwealth supported places and population growth302.2International students322.2.1International student enrolments322.2.2Student profiles33Contribution to the Australian economy372.2.32.3Enrolments in courses leading to professional ent outcomes and employment422.5.1Award course completions422.5.2Attrition and completion rates432.5.3Graduate employment452.5.4Graduate salaries482.5.5Satisfaction502.66Domestic studentsEducational attainmentU NIV E R S IT I ES AU ST RALI A HIG HER EDUCAT ION FACTS AND F IGU RE S51
3SCIENCE, RESEARCH AND INNOVATION553.1Australian Government support for science, research and innovation553.2Business and higher education sector expenditure on R&D563.3Sources of university research income583.4Changing composition of Australian Government funding for university research 603.5Government funding to support research training613.6University spending on research and development633.7Research outcomes633.7.1Higher degree by research completions633.7.2Research excellence64International research collaboration67University-industry collaboration683.7.33.7.44INTERNATIONAL RANKING695UNIVERSITY WORKFORCE716SPECIAL FEATURE: INDIGENOUS STUDENTS AND STAFF746.1Indigenous student enrolments746.1.1Field of education766.1.2Course level766.1.3Undergraduate applications776.2Indigenous student outcomes796.2.1Award course completions796.2.2Completion rates79Labour market outcomes806.36.2.3Indigenous workforce816.3.1Academic vs non-academic816.3.2Comparisons to non-Indigenous staff83UN IVER SITIES AUSTR AL IA H IGH E R E D U CATION FACTS AND F IGU RE S7
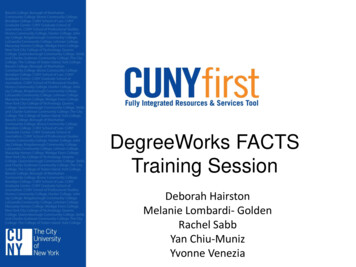
1 FUNDING AND UNIVERSITY FINANCES1.1 AUSTRALIAN GOVERNMENT FUNDING1.1.1 AUSTRALIAN GOVERNMENT HIGHER EDUCATION OUTLAYSTotal Australian Government outlays in higher education spending (including research) increasedfrom 6.6 billion in 1989 to 17.1 billion in 2017 (in 2017 dollars). However, most of the growth isdue to the growth in HELP loans—of which 80 per cent are expected to be repaid in the future—and growth in research grants. Direct teaching and learning grants increased by only 34 per centover the same period.HELP loans as a share of total higher education outlays increased from less than 16 per cent in1989 to almost 40 per cent in 2017. Excluding HELP loans, higher education spending has almostdoubled, from 5.5 billion to 10.7 billion, over the same period.Figure 1: Australian Government higher education spending, in 2017 dollarsSource:Note:Data from 1989 to 2014 are from Department of Education and Training (DET) 2015, Higher Education in Australia:A Review of reviews from Dawkins to today. Estimated 2017 data is from 5fba141Total Higher funding includes CGS or operating grants, HELP, research grants, other appropriations forhigher education support and ARC funding.Despite the growth in funding, Australian Government total higher education spending as apercentage of GDP only increased from 0.9 per cent in 1989 to one per cent in 2017. ExcludingHELP loans, higher education grants for teaching and learning and research have declined from0.7 per cent in 1989 to 0.6 per cent in 2017.8U NIV E R S IT I ES AU ST RALI A HIG HER EDUCAT ION FACTS AND F IGU RE S
Figure 2: Australian Government higher education spending as a percentage of GDPSource:See Figure 1.Table 1 shows the Australian Government’s top 20 expenditure programs in 2019–20. TheCommonwealth Grant Scheme (CGS) features in the top 20 at around 7.2 billion, or 1.4 per centof total Government expenses.Table 1: Top 20 programs by expenses in 2019–20Source:Australian Government 2019, Budget 2019–20: Budget Strategy and Outlook Budget Paper No.1, p.5-10.UN IVER SITIES AUSTR AL IA H IGH E R E D U CATION FACTS AND F IGU RE S9
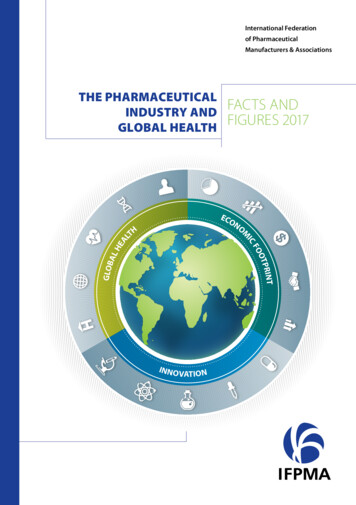
1.1.2 FUNDING PER COMMONWEALTH SUPPORTED PLACEThe revenue received by universities for an average Commonwealth Supported Place (CSP) hasincreased by 27.5 per cent in real terms since 1989 to an estimated 19,230 per place in 2017. Itdeclined after 1994 to a low point in 2002 but has since recovered. Many factors have contributedto this recovery—notably the 25 per cent increase in student contributions from 2005 and thereduction in unfunded places following the introduction of the demand driven system. Some ofthe increase in revenue was a result of a shift of places towards higher cost disciplines.The share of this revenue paid by the Government has declined over time, from 78 per cent in1989 to 58 per cent in 2017, with the Government contribution amount—Commonwealth GrantScheme (CGS)—declining 4.2 per cent from 11,730 per student in 1989 to 11,240 per studentin 2017. Over the same period, the student contribution amount has increased by almost 140 percent from 3,350 to 8,000 per student.Figure 3: Total revenue per Commonwealth Supported Place, in 2017 dollarsSource:Data from 1989 to 2015 are from UA communications with DET following the May 2016 Budget. Data for 2016 and2017 are from HESA Determinations.1.1.3 PUBLIC VS PRIVATE CONTRIBUTION FOR CSPIn a Commonwealth supported place, the Australian Government funds the place throughthe Commonwealth Grant Scheme and the student is required to pay a student contribution.Students can choose to pay their student contribution upfront or borrow it through HECS-HELP.In 2019, the average public-private contribution split for a Commonwealth Supported Place is 58per cent public contribution (or 11,520 per place) and 42 per cent private contribution (or 8,490per place). The public-private contribution split differs according to disciplines as shownin Table 2.10U NIV E R S IT I ES AU ST RALI A HIG HER EDUCAT ION FACTS AND F IGU RE S
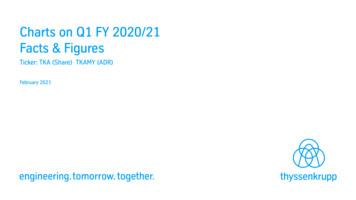
Table 2: Relative government and student contribution by discipline, 2019Funding rnmentand studentcontributionLaw, accounting, commerce,economics, administration 2,160 10,958 13,11816 : 84Humanities 6,008 6,566 12,57448 : 52Mathematics, statistics,computing, built environmentor other health 10,630 9,359 19,98953 : 47Behavioural science or socialstudies 10,630 6,566 17,19662 : 38Education 11,061 6,566 17,62763 : 37Clinical psychology, foreignlanguages, or visual andperforming arts 13,073 6,566 19,63967 : 33Allied health 13,073 9,359 22,43258 : 42Nursing 14,596 6,566 21,16269 : 31Engineering, science, surveying 18,586 9,359 27,94567 : 33Dentistry, medicine orveterinary science 23,590 10,958 34,54868 : 32Agriculture 23,590 9,359 32,94972 : 28Source:DET 2018, Total Resourcing for a Commonwealth Supported Place by discipline–2019.International tuition fee comparisonsTuition fees for domestic students in Australia are high compared to other OECD countries.Figure 4 shows the estimated annual fees for a domestic student studying a full-time Bachelordegree in public institutions in selected OECD countries. In 2015–16, Australia’s average tuitionfee of US 4,785 is higher than South Korea, New Zealand, the Netherlands and Israel, but lowerthan US, Chile, Japan and Canada.UN IVER SITIES AUSTR AL IA H IGH E R E D U CATION FACTS AND F IGU RE S11
Figure 4: Estimated annual tuition fees for Bachelor degree or equivalent at public institutions, 2015 or 2016, in US dollarsSource:OECD 2018, Education at a Glance, Indicator C5.1.1.1.4 OTHER FUNDING TO SUPPORT TEACHING AND LEARNINGIn addition to the direct CGS funding that subsidises tuition costs for Commonwealth supportedstudents, the Australian Government also provides other funding to universities to supportteaching and learning.Higher Education Participation and Partnerships ProgramThe Higher Education Participation and Partnerships Program (HEPPP) provides funding toassist universities listed in Table A of the Higher Education Support Act 2003 to undertakeactivities and implement strategies that improve access to undergraduate courses for peoplefrom low socio-economic backgrounds, as well as improving the retention and completion ratesof those students.When HEPPP was introduced in the 2009–10 Budget, funding was set at two per cent ofCommonwealth Grant Scheme (CGS) funding and was budgeted to increase to four per cent by2012–13, in line with the recommendations of the Bradley Review of Higher Education in 2008.However, HEPPP funding was cut in the 2011–12 Budget and several times since—mostrecently in the 2016–17 Budget (see Figure 5). Total cuts of around 250 million to 2019–20 havebeen announced since the 2011–12 budget. As a result, HEPPP has not reached the four percent target. In 2018, HEPPP was around 2.1 per cent of CGS (including enabling and regionalloadings) and is estimated to remain at this level in 2020.12U NIV E R S IT I ES AU ST RALI A HIG HER EDUCAT ION FACTS AND F IGU RE S
Figure 5: HEPPP funding—actual and budget cutsSource:Actual data for 2010 to 2015 are from DET administrative dataset and for 2016 to 2018 are from HESADeterminations. Forward estimates figures are from DET’s Portfolio Budget Statements (various years).Disability Support ProgramThe Disability Support Program (DSP) provides funding to eligible higher education providers toundertake activities that assist in removing barriers to access for students with disability.While the funding for the DSP grew 15.7 per cent in nominal terms between 2008 and 2017,funding has actually declined by 4.7 per cent over the period in real terms. Coupled with thesignificant growth (117.7 per cent) in students with disability, DSP funding per student hasdeclined by 56.2 per cent in real terms, from 260 in 2008 to 115 in 2017.Figure 6: Funding for Disability Support Program—total and per student—in 2017 dollarsSource:DET administrative data and HESA Determinations.UN IVER SITIES AUSTR AL IA H IGH E R E D U CATION FACTS AND F IGU RE S13
Indigenous Student Success Program fundingIn 2013, the Australian Government consolidated Indigenous funding programs from allportfolios into one large funding pool (the Indigenous Advancement Strategy or IAS) administeredby the Department of Prime Minister and Cabinet. In this action the following specific programswere taken from DET and subsumed into the IAS: Indigenous Support Program (ISP); Indigenous Tutorial Assistance Scheme (ITAS); and Commonwealth Scholarships ProgramAfter initial difficulties, when many universities failed to gain funding through the competitive IASprocess, a separate portion of the IAS equivalent in value to the lost DET programs was set asidefor universities—the Indigenous Student Success Program (ISSP)—which began in 2017.The ISSP provides supplementary funding to universities according to a formula that takesinto account enrolments, unit success rates and course completions of Indigenous students. Aloading is included in the allocation formula for students from regional or remote areas.The value of the ISSP is expected to increase by 6.4 per cent, from 70.6 million 2017 –18 to 75.1 million in 2022–23.11.1.5 INTERNATIONAL COMPARISONSIn 2015, Australia’s total investment—public and private—in tertiary education institutions asa share of GDP was above the OECD average and the fourth highest, behind the US, Chile andCanada.However, Australia’s public investment (Figure 7) in tertiary institutions as a share of GDP wasamongst the lowest in the OECD—ranked 24 out of 34 countries. Australia’s public investmentwas 0.77 per cent of GDP in 2015 compared to 0.98 per cent of GDP for average OECD countries.Figure 7: Public investment in tertiary education institutions as a percentage of GDP, 2015Source:114OECD 2018, Education at a Glance, Table C2.2–Final funds after transfers between government and private sector.Australian Government 2019, Budget 2019–20: Department of Prime Ministers and Cabinet Portfolio Budget Statements.U NIV E R S IT I ES AU ST RALI A HIG HER EDUCAT ION FACTS AND F IGU RE S
On the contrary, Australia’s private investment in tertiary education institutions is among thehighest in the OECD—ranked four out of 33 countries (Figure 8). Australia’s private investmentwas 1.26 per cent of GDP in 2015, compared to 0.51 per cent of GDP for average OECD countries.Figure 8: Private investment in tertiary education institutions as a percentage of GDP, 2015Source:See Figure 7.1.2 HIGHER EDUCATION LOAN PROGRAM (HELP)Total annual HELP loan amounts more than doubled from 3.5 billion in 2010 to 8.7 billion in2015, before reducing to 7.5 billion and 6.7 billion in 2016 and 2017 respectively following thereforms in VET FEE-HELP2 (Table 3). Over this period, both HECS-HELP and FEE-HELP lendingincreased by around 80 per cent respectively. However, growth in HECS-HELP lending is largelydue to the growth in student places (39 per cent growth); while growth in FEE-HELP lending islargely due to growth in the average amount borrowed per student (51 per cent growth) fromabout 14,000 in 2010 to 20,600 in 2017.Figure 9 shows that VET FEE-HELP as a share of total new HELP lending has increased fromthree per cent in 2010 to 34 per cent in 2015, before declining to eight per cent in 2017 followingthe VET loan reform.As at 30 June 2017, outstanding HELP debt was 55.4 billion, including money lent to vocationaleducation students under VET FEE-HELP.3 The ‘fair value’ of HELP debt—the amount that isexpected to be eventually repaid by borrowers—was valued at 35.9 billion.4In 2016–17, the estimated proportion of new HELP debts not expected to be repaid was 25 percent, which increased from 22 per cent in 2015–16. The Australian Government Actuary hasestimated that excluding VET loans, 18 per cent of new HELP debts incurred in 2016–17 are notexpected to be repaid.5HECS-HELP and FEE-HELP are income-contingent loan programs that allow domestic students to defer payment of student contributions for Commonwealth Supported Places and tuition fees for full-fee paying courses in higher education. VET FEE-HELP allows students to defer places for vocationaleducation and training courses outside of higher education.3Australian Tax Office 2018, Taxation Statistics 2015–16, Table 21.4Department of Education and Training 2017, Annual Report 2016–17, p.45.5Ibid, p.45.2UN IVER SITIES AUSTR AL IA H IGH E R E D U CATION FACTS AND F IGU RE S15
Table 3: Number of students receiving HELP loans and new HELP lending by programsNumber of places(EFTSL) or studentsreceiving help loans20102011201220132014201520162017HECS-HELP 32,940548.802FEE-HELP 6825,972VET Student Loans(EFTSL)-------26,908HELP payments tohigher educationproviders on behalfof students( millions)20102011201220132014201520162017HECS-HELP ELP loans8851,0081,1421,2651,3541,4401,5161,570OS-HELP loans22283239688195102SA-HELP loans--588595100105112VET FEE-HELPloans1172043236961,7432,9151,470307VET Student loans-------200Total HELP loans3,4913,8864,5475,6867,2098,6707,4836,743VET FEE-HELP(EFTSL)Source:2010 to 2013 HECS-HELP, FEE-HELP, OS-HELP and SA-HELP figures are derived from the 2010 and 2011–13Higher Education Reports. 2014 to 2017 HECS-HELP, FEE-HELP, OS-HELP and SA-HELP figures are sourced fromHESA Determinations. 2010 to 2017 figures for VET FEE-HELP are from DET’s 2016 and 2017 VET FEE-HELPStatistical Report.Figure 9: Amount of new HELP lending by programs, in nominal dollarsSource:16See Table 3.U NIV E R S IT I ES AU ST RALI A HIG HER EDUCAT ION FACTS AND F IGU RE S
1.3 UNIVERSITY FINANCES1.3.1 REVENUE BY SOURCEIn 2017, total operating revenue for Australian universities—in real terms—was 31.5 billion,compared to 17.9 billion in 2004.As a proportion of total revenue, revenue sourced from Australian Government grants (excludingHELP) has declined from 40.7 per cent in 2004 to 36.9 per cent in 2017; while overseas studentfees have increased from 14.7 per cent to 23.5 per cent over the same period.This aggregate picture masks considerable variation between universities.Figure 10: Sources of university revenue, in 2017 dollarsSource:Note:Department of Education and Training, Financial Reports of Higher Education Providers (various years), excludingBIITE – Batchelor Institute of Indigenous Tertiary Education and VET activity for dual sector universities.Data are not available for Bond University. Other income includes royalties, trademarks and licences and theshare of net result of associates and joint ventures accounted for using the equity method.1.3.2 EXPENDITURE BY CATEGORYAustralian universities’ operating expenses have grown broadly in line with revenue growth, withtotal operating expenses increasing from 17 billion in 2004 to 29.5 billion in 2017. Changes inthe proportion of expenditure on different expense categories have been relatively small.The share of expenditure spent on staff (excluding payroll tax) has remained at around 55 percent between 2004 and 2017.Around 10 per cent of university budgets are devoted to depreciation and repairs andmaintenance.6Excluding Batchelor Institute of Indigenous Tertiary Education (BIITE) and VET activity for dual sector universities.UN IVER SITIES AUSTR AL IA H IGH E R E D U CATION FACTS AND F IGU RE S17
Figure 11: Categories of university expenditure, in 2017 dollarsSource:Note:Department of Education and Training, Financial Reports of Higher Education Providers (various years), excludingBIITE – Batchelor Institute of Indigenous Tertiary Education, and VET activity for dual sector universities.Data are not available for Bond University. Other expenses include impairment of assets, investment lossesand deferred superannuation expenses.1.3.3 UNIVERSITIES’ FINANCIAL POSITIONAccording to published net operating result figures from the Department of Education andTraining (DET) Higher Education Finance Statistics,7 the total sector net operating result inabsolute nominal dollar terms has increased by 11 per cent in 2017 compared to 2009. However,in real terms, net operating result has declined by 7 per cent since 2009 (Figure 12).As a percentage of total revenue, operating margins for the whole sector have declined from 8.8per cent in 2009 and 2010 to 6.2 per cent in 2017.There is a clear negative trend over time in the number of universities with healthy margins(Figure 13). Six universities were in deficit in 2017 compared to none in 2009. Moreover, thenumber of universities with a surplus margin greater than 8 per cent has declined from 24universities (or 63 per cent of universities) in 2009 to ten universities in 2017 (or 26.3 per cent ofuniversities).718Data reported in in Figure 12 and Figure 13 include both higher education and VET activities for 38 universities. They exclude results BIITE.U NIV E R S IT I ES AU ST RALI A HIG HER EDUCAT ION FACTS AND F IGU RE S
Figure 12: University net operating results, 2009 to 2017, in 2017 dollarsSource:Department of Education and Training, Financial Reports of Higher Education Providers (various years), excludingBIITE.Figure 13: Number of universities by size of operating margins, 2009 to 2017Source:Department of Education and Training, Financial Reports of Higher Education Providers (various years), excludingBIITE.UN IVER SITIES AUSTR AL IA H IGH E R E D U CATION FACTS AND F IGU RE S19
2 STUDENTSIn 2017, 1,387,409 students studied at Australia’s 39 comprehensive universities. Of these, 73per cent (or 1,014,503) were domestic students and the remaining 27 per cent (or 372,906) wereinternational students.2.1 DOMESTIC STUDENTS2.1.1 STUDENT PROFILESCourse level and type of attendanceOf the 1,014,503 domestic students studying in Australian universities in 2017—73 per cent werestudying Bachelor degrees, 18 per cent were studying for postgraduate coursework degrees anda further 4 per cent were studying postgraduate research (HDR) degrees.The majority (66 per cent) of students—669,400—were studying their qualifications full-timein 2017. However, this varied at different levels of study, ranging from 75 per cent for Bachelordegree students to 36 per cent for postgraduate coursework students (see Figure 14)Figure 14: Domestic students, by course level and type of attendance, 2017Source:20DET, uCube.U NIV E R S IT I ES AU ST RALI A HIG HER EDUCAT ION FACTS AND F IGU RE S
Figure 15 shows that the proportion of Bachelor degree students studying full-time has declinedslightly from 77 per cent in 2008 to 75 per cent in 2017, while a greater share of postgraduatestudents—both coursework and research—was studying full-time in 2017 than in 2008.Figure 15: Share of domestic students, by course levels and type of attendance, 2008 and 2017Source:See Figure 14.Age cohortIn 2017, 62 per cent of first-year domestic students enrolled in undergraduate courses wereaged 20 or younger, 15 per cent were aged between 21 and 24 and the remaining 23 per cent ofstudents were aged 25 and older. These proportions have remained relatively unchanged since2005 (Figure 16).Figure 17 shows that annual growth in first-year domestic undergraduate enrolments hasdeclined in recent years, from 10.1 per cent growth recorded in 2012 to 1.6 per cent in 2017.However, this growth varied significantly by age cohort, from as high as 5.6 per cent for 30 to 39years old to as low as 0.3 per cent for students aged 21 to 24 in 2017.UN IVER SITIES AUSTR AL IA H IGH E R E D U CATION FACTS AND F IGU RE S21
Figure 16: Share of commencing domestic undergraduate students, by age cohortSource:DET, unpublished HEIMS data, various years.Figure 17: Annual growth in commencing domestic undergraduate student enrolments, by age cohortSource:22DET, unpublished HEIMS data, various years.U NIV E R S IT I ES AU ST RALI A HIG HER EDUCAT ION FACTS AND F IGU RE S
Basis of admissionFigure 18 shows that the proportion of first-year domestic Bachelor degree students admittedon the basis of secondary education has declined from 50 per cent in 2008 to 45 per cent in 2017.Over the same period, the share of students admitted on prior higher education and VET courses(whether complete or incomplete) increased from 33 per cent to 38 per cent, while the share ofstudents admitted based on other pathways has remained relatively unchanged at around17 per cent.Figure 18: Basis of admissions for commencing domestic Bachelor degree studentsSource:DET, unpublished HEIMS data, various years.The share of all undergraduate offers made to prospective students with an ATAR score of 50 orless in 2018 was 2.9 per cent—slightly higher than in 2017 at 2.7 per cent—consistent with theshare recorded in 2016. The absolute number in 2018 was 8,023, compared to 7,620 in 2017 and8,215 in 2016—a decline of 2.4 per cent on 2016.Nonetheless, only 64 per cent of students with an ATAR of 50 or less accepted their offers in 2018compared to 74 per cent for students with an ATAR above 90.UN IVER SITIES AUSTR AL IA H IGH E R E D U CATION FACTS AND F IGU RE S23
Broad field of educationThe most popular fields for undergraduate students are society and culture (25.2 per cent),health (18.4 per cent), management and commerce (16.5 per cent) and natural and physicalsciences (10.5 per cent).The most popular field for postgraduate students—both coursework and research—are health(22.7 per cent), society and culture (22.6 per cent), education (17.3 per cent) and managementand commerce (16.7 per cent).Figure 19: Domestic undergraduate and postgraduate enrolments, by broad FOE, 2017Source:DET, uCube.Undergraduate disciplines that have experienced the largest percentage increase in enrolmentssince 2008 were health (a growth of 74.3 per cent), natural and physical sciences (61.8 per cent)and information technology (52.2 per cent). Agriculture, environmental and related studies is theonly discipline that has experienced a decline in enrolment (-0.2 per cent).24U NIV E R S IT I ES AU ST RALI A HIG HER EDUCAT ION FACTS AND F IGU RE S
Figure 20: Growth in domestic undergraduate enrolments, by broad FOE, between 2008 and 2017Source:DET, uCube.For postgraduate study, health (87.9 per cent), education (37.2 per cent) and engineering andrelated technologies (30.9 per cent) were the disciplines that have experienced the largestpercentage growth in enrolments since 2008 (Figure 21). Disciplines that experienced a declinein enrolments were agriculture, environmental and related studies (-17.4 per cent), managementand commerce (-15.1 per cent) and creative arts (-8.3 per cent).Figure 21: Growth in domestic postgraduate enrolments, by broad FOE, between 2008 and 2017Source:DET, uCube.UN IVER SITIES AUSTR AL IA H IGH E R E D U CATION FACTS AND F IGU RE S25
2.1.2 COMMENCING AND TOTAL COMMONWEALTH SUPPORTED PLACESAustralia now educates 622,647 students in Commonwealth Supported Places (CSP), 182,300more than in 2008 (Figure 22).Figure 22: Commonwealth supported enrolment, equivalent full-time student load (EFTSL)Source:Note:DET, uCube.Include Commonwealth supported places in non-Table A universities for national priority places.The growth in total CSP enrolment was initially rapid at around 6 per cent per year during thetransitional years prior to the full introduction of the demand-driven system, with commencingCSP enrolments increasing by 11.5 per cent in 2009 and 8.3 per cent in 2010.Eight years later, annual growth in enrolments has stabilised to levels slightly below populationgrowth. In 2017, total Commonwealth Supported Places grew by only 1.1 per cent, down from1.5 per cent in 2016, 1.6 per cent in 2015 and 3.6 per cent in 2014. Over the same period,commencing CSP enrolments grew by 3.3 per cent in 2014, before declining by 0.4 per cent in2015. Commencing CSP enrolments increased by just 1.1 per cent in 2016 and 0.4 per centin 2017.26U NIV E R S IT I ES AU ST RALI A HIG HER EDUCAT ION FACTS AND F IGU RE S
Figure 23: Growth in Commonwealth supported enrolments (EFTSL)Source:DET, uCube.2.1.3 GROWTH IN STUDENT ENROLMENTS BY EQUITY GROUPThe demand driven system has led to an increase in the number of undergraduate students fromkey equity groups, including Indigenous students, students with a disability, and students fromlow socio-economic backgrounds and regional and remote areas (Figure 24).Figure 24: Number of domestic undergraduate student enrolments, 2008 and 2017Source:Note:DET 2018, Selected Higher Education Statistics–2017 Student Data, Appendix B–Equity Groups.*denotes low SES definition changed from 2006 SEIFA to 2016 SEIFA from 2016. ** denotes regional andremote student definition changed from 2006 MCEETYA to 2016 ASGS in 2016.UN IVER SITIES AUSTR AL IA H IGH E R E D U CATION FACTS AND F IGU RE S27
The latest Department of Education data show that since 2008: enrolments of undergraduate students with a disability rose 123 per cent; Indigenous undergraduate student enrolments have more than doubled (105 per cent); enrolments of undergraduate students from low socio-economic backgrounds (low SES)increased 66 per cent; and enrolments
snapshot of facts and figures about the nation's higher education system. The growth in government funding into universities from 2008 to 2017 occurred as a result of the decision to expand access to university education for more Australians than ever before. Government funding rose over that decade to expand student places, including for tens of