Transcription
Application PerformanceManagement for CloudCMGBy Priyanka Aroraprarora803@gmail.com
Cloud Adoption Trends2 Spending on public cloud Infrastructure as a Servicehardware and software is forecast to reach 173B in 2026SaaS and PaaS portion of cloud hardware andinfrastructure software spending are projected to reach 55B in 2026
Agenda3 Understanding Cloud What is Cloud ComputingCloud Deployment Models Cloud Service Models Understanding APMConsiderations for Cloud ApplicationsMaking the right APM choice Obscurity of CloudSolution IaaS/PaaS/SaaSProblem Statement Public vs Private, Hybrid?APM for XaaSSynthetic Vs Real User MonitoringMagic Quadrant and Market SolutionsEvaluating APM SolutionsExamples
4Understanding Cloud
What is cloud computing?5Traditional IT Cost of Ownership andMaintenance Cost of Operation Total ControlCloud Computing Flexible availability Cost effective, Pay per use Unlimited Scalability Fit for Purpose
Cloud Deployment Models6 Private Cloud Privately shared virtualized resources Systems and Services operated and delivered exclusively for an organizationPublic cloud Enterprise taps into a public set of resources delivering standardized, highlyautomated offerings Compute resources, storage and networking capabilities, are owned by aservice provider and offered on demand with limited SLAs regarding tenancy,isolation, and performance. Shifts CapEx to OpEx – Pay as you goHybrid cloud Implementation of “Hybrid” includes a mix of internal (on-premises, oftenvirtualized) and external (cloud-hosted) solutions, with applications switchingbetween resources as needed Allows manipulation of CapEx and OpEx
Cloud Service orageServers
8Problem StatementObscurity of Cloud
Cloud Challenges9 Security and Privacy Compliance Obscurity Lackof Visibility Loss of Control Availability, Reliability, Service Quality PerformanceUnpredictabilityLack of Skills, Expertise Integration with Existing Infrastructure
Traditional Management Paradigm10 Traditional data center management and monitoring protocols focus on technology elementsin silosLack of visibility and control puts organization at the mercy of cloud vendor Vendor’s commitment and capability to meet SLAs
11Solution - CAPM
Application PerformanceMeasurement/Monitoring/Management?12UEM and Reporting Real-time end userexperience monitoring SLA Reporting Performance andAvailability of CriticalBusiness Functions Business Analytics Business TransactionVolumes Trend Reports Geographic LocationdistributionCode Optimization Method level code profiling - rootcause identification andoptimization Thread synchronization anddeadlock analysis Heap Object analysis andoptimization Response Time tier breakdownProduction Monitoring / Alerting CPU, Memory, Disk and Network Application availability/health Critical business functionperformance Garbage Collection Health Out of Memory, DeadlockConditionsApplication Monitoring CPU, Memory, Disk andNetwork monitoring Process Health Heap Usage, GarbageCollection Health Threads Count,Contention/Raceconditions DB Connection Health # of connections,use/wait time,deadlocks
Application op13FeedbackUEM and Reporting Real-time end userexperience monitoring SLA Reporting Performance andAvailability of CriticalBusiness Functions Business Analytics Business TransactionVolumes Trend Reports Geographic LocationdistributionMonitorCode Optimization Method level code profiling - rootcause identification andoptimization Thread synchronization anddeadlock analysis Heap Object analysis andoptimization Response Time tier breakdownProduction Monitoring / Alerting CPU, Memory, Disk and Network Application availability/health Critical business functionperformance Garbage Collection Health Out of Memory, DeadlockConditionsTestApplication Monitoring CPU, Memory, Disk andNetwork monitoring Process Health Heap Usage, GarbageCollection Health Threads Count,Contention/Raceconditions DB Connection Health # of connections,use/wait time,deadlocksDeploy
APM & Cloud: Why is it Important?14 Ensuring excellent end-user experience‘Right Sizing’, validation and forecasting futuregrowth, smart scaling Mitigating Risk of Unpredictable Performance Regaining Visibility and Control SLA Verification
15CAPM – Making the right choice
APM for XaaS16 Deep Dive Monitoring Real User Monitoring Script Injection Agent install at times Compatible with IaaS andPaaS Can also be implemented forSaaS if vendor permits To monitor container resources Java/J2EE and .Net Needs an Agent Compatible with IaaS and PaaSAgent BasedActive(IaaS/PaaS)Agent oring Synthetic Monitoring Robotic transactionssimulating User Behavior Availability focused Compatible with all Cloudofferings: IaaS, PaaS sive(Not CloudCompatible) Network Monitoring TCP/IP and SPAN Portmonitoring Not Cloud Compatible
Synthetic Vs RUM17 Synthetic ActiveMonitoring, special focus on Availability Based on ‘Scripted’ User Interactions Gauges possible user experience Executed from any location across the globe Is Agentless RUM Basedon ‘Real’ User Interactions A more definitive indicator of User Experience Also provides a global perspective Can be Agentless(JavaScript, Network tap) orAgent based
Some things to consider.18 Focus on Unified View across Hybrid EnvironmentsAPM Approach Business TransactionsTiersBaselinesEnd User ExperienceAgent Vs AgentlessSynthetic Vs Real User Monitoring (RUM)Development and Optimization considerations
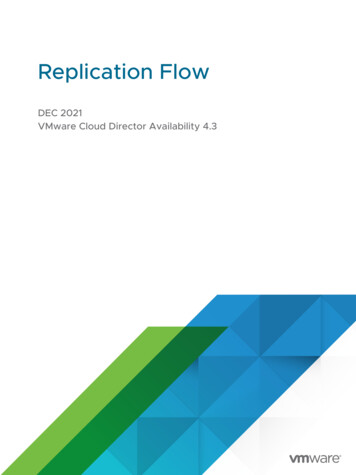
Gartner’s Magic Quadrant for APM Suites19Dimensions of APM SuitesEnd-user experience monitoring (EUEM) The capture of data about how end-to end latency, executioncorrectness and quality appear to the real user of the application A secondary focus on application availability may be accomplished bysynthetic transactions emulating the end userApplication topology discovery and visualization The discovery of the software and hardware infrastructurecomponents involved in application execution, and the array ofpossible paths across which these components communicate to deliverthe applicationUser-defined transaction profiling The tracing of user-grouped events, which comprise a transaction asthey occur within the application as they interact with componentsdiscovered in the second dimension; this is generated in response to auser's request to the application.Application component deep dive The fine-grained monitoring of resources consumed and eventsoccurring within the components discovered in the applicationtopology discovery and visualization dimension This includes the server-side components of software being executed.IT operations analytics (ITOA) The combination or usage of the following techniques: complexoperations event processing, statistical pattern discovery andrecognition, unstructured text indexing, search and inference,topological analysis, and multidimensional database search andanalysis.
Dynatrace20
AppDynamics21
New Relic22
Monitoring Capabilities of Cloud Providers23 AWS- Amazon Cloud Watch and now X-Ray Chargeback/Cost Metrics, Status and Availability Monitoring Log Monitoring, Transaction Tracing, Service Mapping For AWS only
Monitoring Capabilities of Cloud Providers24 Azure - Azure Monitor Activity and Diagnostic Logs, Alerts and Automated actions Metrics – Resources, Application Performance, Storage, Service Bus etc For Azure only
Monitoring Capabilities of Cloud Providers25 Google - StackDriver Logging, event monitoring, diagnostics, Visibility into performance, uptime, and overall health of cloud applications For Google Cloud and AWS
26Evaluating APM Solutions
Defining APM Requirements27Real End User Monitoring Solution Must Have Real-time capture and reporting on User Activity, Response Timesand ErrorsPage Rendering and object level detailsBusiness Transaction and SLA monitoringBusiness Analytics and User Session InsightsOmni-channel visibility across Browsers and Mobile platformsGeographic perspectiveUser defined transaction profiling for critical business applications Integration with Runtime application performance ‘User-Complaint’ to ‘Code-Level’ root cause for faster triage of Production issuesGood to Have User defined transaction profiling for non critical applications
Defining APM Requirements28Synthetic Monitoring Solution for Active Availability coverage Must HavePage rendering and object level details for RootCause analysis for critical business applications Last Mile response time from across the geography Multi Browser support for playback Good to HaveThird part content analytics for critical businessapplications Competitive Benchmarking Integration with UEM, Runtime ApplicationPerformance
Defining APM Requirements29Runtime Application Performance Monitoring Solution Must Have Process health, Container resource, event monitoring (Heap, Thread, Connection pools, Servlets, Auto discovery of transaction topology for service dependency mappingTransaction tracking/stitching for response time tier breakdownCode level ‘deep-dive’DB Performance (SQL Captures, Pool usage, Deadlocks, Hotspots)WebService, Messaging and Remote calls PerformanceSupport for Java/J2EE, .Net, Microservices and other runtimesMonitoring of on premises and cloud hosted applications – seamless integration,presentationReal time high granularity collection and reportingNo impact to application performance with minimal resource overhead EJBs)Good to Have Transaction/Method level resource cost evaluation for code optimizationRuntime Thread Dump and Heap Dump capabilitiesApplication Events- Errors, Exceptions, logs and Stack TraceIntegration with DevOps, support development/test lifecycle for agility Integration with Load Generation tools (HP Performance Center) for monitoring of Performance testsIntegration with IDEs and CI/CD solutions for code optimization
Defining APM Requirements30Other Considerations Data analysis, presentation and reporting capabilitiesIntegration with MoM solutionsEase of deployment and UseArchitecture of solution (Aggregation vs Gapless design), Data model, Agentdesign (application resource reliant vs independent)Converged platforms providing one consolidated view – Single pane of glassOne unified solution for multi purpose APM APM-aaS availabilityVendor Evaluation On-premises and Cloud (IaaS/PaaS/SaaS) applicationsMonitoring capability for Containers and MicroservicesRoadmap and technology/trend adoption towards Digital Performance ManagementLicensing ModelCurrent Market ShareCustomer Service and Product SupportGartner’s EvaluationCost of Deployment, Maintainability and Scalability
31Examples
Synthetic Monitoring32
Synthetic Monitoring - Reports33
Real User Monitoring (JavaScript Injection)3441SaaSApplication243
RUM Reports35 Capability to track ‘critical’ transactions, visibility into top customer locations, branches and associated userexperiences
RUM Reports36
Agent Based Monitoring37IaaS/PaaSApplication
Agent Based Monitoring - Reports38
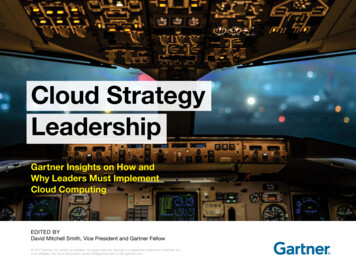
Agent Based Monitoring - Reports39 Garbage Collection health, Suspension time, Process throughput, Thread Count
Agent Based Monitoring - Reports40
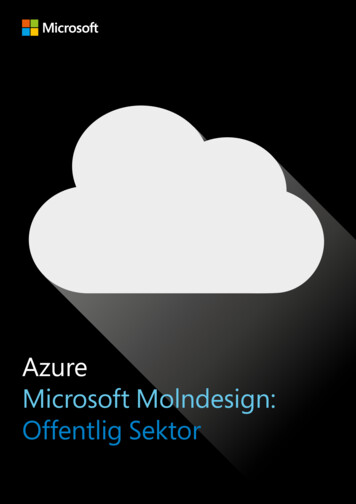
Agent Based Monitoring - Reports41 Giving the Developers capability to drill in all the way to the source of the problem Deep dive into the code, identifying root cause at the method level Long running methods contributing to latency; Also identifying resource intensive methods
And that’s a wrap!42 We talked about Cloud Cloud deployment modelsService offeringsCloud ChallengesAPM SolutionsConsiderations for APM solutionsIrrespective ofWhat cloud solution you adopt Which applications you migrate to it What monitoring methodologies you choose What APM solutions you deploy .as an IT organization, you have to move from traditionalmonitoring/management paradigms to business service andend user focused, holistic solutions to survive this new age ofCloud
Questions?43
References44Gartner's Magic Quadrant for Application Performance Monitoring SuitesThings to Know About APM in the CloudManaging Performance of Cloud Based ApplicationsAPM for Cloud ComputingAnatomy of APMCloud PredictionsObscurity of CloudDuality of APMAzure MonitorAWS X-RayGoogle StackdriverDynatraceAppDynamicsNew Relic
45APPENDIX
RUM Reports (JavaScript Injection)46 Reportingon Average Application throughput during typical and peak timesresponse times for users with anomalies Response Time Breakdown between Server, Network and Rendering time AverageNo improvement in Response Time since July 1stEST Users come onlinePST Users come online
Agent Based Monitoring - Reports47
RUM Reports (JavaScript Injection)48 Understanding User Experience across the globe Application Workload Trending for forecasting growth
RUM Reports (Agent Based)49
SLA/SLM and Reporting50 Monitoring/Reporting Service levels for overallapplication as well as at ‘component level’Combining ‘Active’ and ‘Passive’ monitoringfor complete visibilityProactive alertingTrending Transaction Volumes and End UserExperienceUnderstanding ‘cost per transaction’ Correlatingbusiness throughput to systemresource for ‘right-sizing’
Optimization for Cloud Applications51 Content CachingCompression algorithms – data is expensive inthe cloudOptimized page rendering Parallel rendering of contentWAN Quality of ServiceChatty Applications ReducingLatencyacknowledgements to reduce WAN
Dynatrace – Instance Cost52
Dynatrace – Problem Evolution53
Dynatrace – Topology Visualization54
Dynatrace – Overview Dashboards55
AppDynamics – Topology Visualization56
AppDynamics – User Experience57
New Relic – Infrastructure Overview58
New Relic – Instance Cost Monitoring59
Application Performance Management for Cloud By Priyanka Arora prarora803@gmail.com CMG. Cloud Adoption Trends . Roadmap and technology/trend adoption towards Digital Performance Management Licensing Model Current Market Share Customer Service and Product Support Gartner's Evaluation Cost of Deployment, Maintainability and Scalability 30.