Transcription
A Discussion on Landfill Costs, Rates,and Intakes- Rate Study Presentation 48th AnnualEnvironmental Show of the SouthMay 15-17, 2019Prepared by:Conference Sponsored by:
Outline IntroductionPurposeLandfill Background / FactsExpensesRevenuesComparison of Tipping FeesBalance PointResults and DiscussionSummary and Closing
Introduction Consider permitting Class Ilandfills in TN– Run at profit or make financially sustainable– Operate facility effectively and efficiently– Operate safe and environmentally compliant To accomplish objectives– Money to permit, construct, operate,– Money to maintain, monitor, comply, andclose Where is that optimum point, that“balance point”– How many tons/day, and at what price tooperate, comply, and make it sustainableQuestion to TDECHow do we comply& compete ?
Purpose Try to address some of thesequestions Present a per ton cost of service toallow owners to start their ownevaluation of current services andoperations Rate Study or Cost of Service Study– Determine solid waste tipping feesrequired to balance cost of serviceswithout need for unplanned capitalexpenditures or price increases
Landfill Background Publicly owned and operated in TN Class 1 Disposal Facility (non-haz MSW) Landfill Permitted & Operates in accordance with TDEC’sChapter 0400-11-01 Composite Base Liner System GCCS System Installed & LFGTE Plant 25 Employees (Landfill, Maintenance Shop & Admin.) Average Waste Intake 200,000 tpy (600-800 tpd)
Landfill Background Expense for Capital Purchases accounted as depreciationover the useful life of the asset Administration and Operations resources shared withother countywide Solid Waste Management activities –recycling, O&M, waste pick-up, etc. Tipping Fees & Landfill Gas Sales are major revenuesources Tipping Fee - 48/ton (gate rate), 29/ton (averagediscounted rate-based committed accounts, volumes,residential customers, other services, etc.)
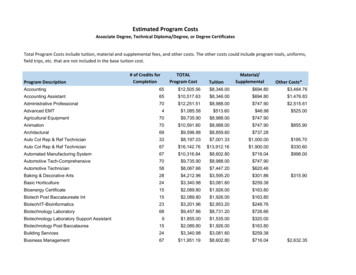
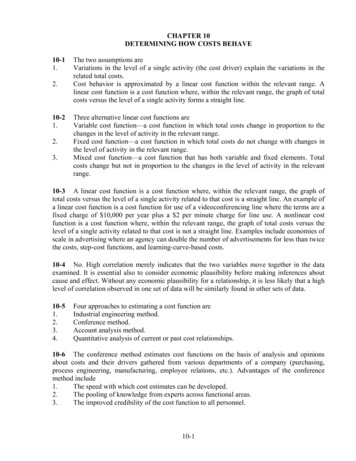
Summary of Expenses Administration Maintenance Shop Landfill Operations & Maintenance– Permitting, Development (Infrastructure, Construction,Engineering), Operations, Compliance (Monitoring, Reporting),& Closure Post-Closure Care CostsAdministrationShopLandfill O & MPost Closure Care CostsTotal 629,194282,0655,391,753817,6117,120,623Note: Expenses listed above are for a calendar year, annual.9%4%76%11%100% 3.151.4126.964.0935.60
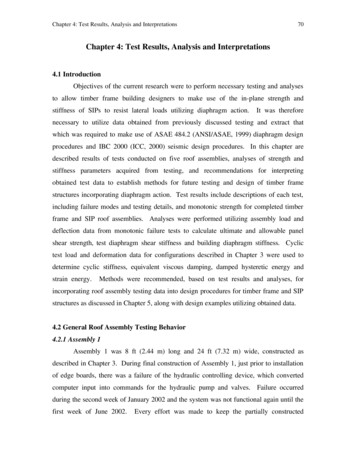
Summary of ExpensesOther12%Equipment &Machinary9%Staff25%Contract Items11%36%Insurance6%43%Engineering &Compliance9%Fuel7%21%StaffInsurance & BenefitsAdmin ExpensesDepreciation21%OtherLandfill O & M Expenses
3.15 , 9% 4.09 , 11%Expense/ton 36 1.41 , 4%Administration 26.96 , 76%ShopLandfill O & MPost Closure Care Costs
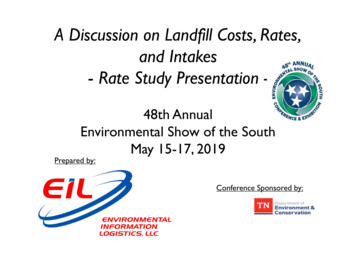
Summary of Revenues 0.27 , 1%Revenue/ton 29 29.51 , 99%Tipping FeesLandfill Gas SalesRevenue TypeTipping Fees Landfill Gas Sales Total Amount5,902,27353,9575,956,230% of Total RevenueNote: Revenues listed above are for a calendar year, annual.99%1%100%Revenue/ton 29.510.2729.78
Comparison of Tipping Fees & IntakeRates - StatewideCategoryState OverallMun LFs onlyState of TNTipping Fee ( /ton)HighAvgLow 86 42 1 60 37 23Intake (tons/day)HighAvgLow3,9528312280021022Source of Information:Tipping Fees:2018 Tipping Fees, Class I Sanitary Landfills in Tennessee, TDEC, Div of SWMIntake Rates:2018 Remaining Life Survey, Class I Sanitary Landfills in Tennessee, TDEC, Div of SWM 48/ton gate rate 41/ton (discounted rate 1) 36/ton (discounted rate II)Discounted rate for Residential Customers 29/ton average of above rates600 - 700 tons/day
Comparison of Tipping Fees - NationwideAnalyses of MSW LF Tipping Fees (Apr 2018)Avg MSW LF Tip Fees, by RegionAvg Tipping 47Mountain/Plains4644Southeast4143South Central3735National Avg5255Source:EREF, Analysis of MSW Landfill Tipping Fees, April 2018 29/ton average 48/ton gate rate
Balance Point - The DeficitIncreaseTippingFeeIncreaseWasteIntake
Balance Point - /tonExpense/ton 36Revenue/ton 29Difference 7, tipping fee increase 55/ton (revised gate rate) 48/ton (revised discounted rate 1) 43/ton (revised discounted rate II)
Balance Point - tons/dayDeficit 1,100,000Tipping Fee 41/ton (Discounted Rate 1)Increase Waste Intake by additional 25,000tons, total annual waste intake range of220,000 to 230,000 tons (850 to 900 tpd).
Results and Discussion Modeling aimed at providing key elements basedon site-specific analyses Ways to Increase Revenue– Increase tipping fees– Accept trash from other counties
Summary and Closing Provide basic tool to evaluate own operations– Varies, but similar steps– Fee decision elements Provide handle on pricing and/or tons, while achieving compliance,to determine whether to be able to compete Prepare for and plan for future waste management services Serve as a planning tool– Design efficiency important– Improve operating practices Obtain better handle on operations and prioritize initiatives
Thank You!Andrew Querio, P.E., CPESCandy.querio@eilllc.com(630) 254-9382Chirag Nanavaticr@eilllc.com(630) 254-9392www.EILLLC.com
Comparison of Tipping Fees & Intake Rates - Statewide State of TN Category Tipping Fee ( /ton) Intake (tons/day) High Avg Low High Avg Low State Overall 86 42 1 3,952 831 22 Mun LFs only 60 37 23 800 210 22 Source of Information: Tipping Fees: 2018 Tipping Fees, Class I Sanitary Landfills in Tennessee, TDEC, Div of SWM