Transcription
J Plant Res (2015) 128:73–90DOI 10.1007/s10265-014-0666-7REGULAR PAPERProgressive migration and anagenesis in Drimys confertifoliaof the Juan Fernández Archipelago, ChilePatricio López-Sepúlveda Koji Takayama Josef Greimler Daniel J. CrawfordPatricio Peñailillo Marcelo Baeza Eduardo Ruiz Gudrun Kohl Karin Tremetsberger Alejandro Gatica Luis Letelier Patricio Novoa Johannes Novak Tod F. Stuessy Received: 19 December 2013 / Accepted: 12 June 2014 / Published online: 8 October 2014Ó The Author(s) 2014. This article is published with open access at Springerlink.comAbstract A common mode of speciation in oceanicislands is by anagenesis, wherein an immigrant arrives andthrough time transforms by mutation, recombination, anddrift into a morphologically and genetically distinct species, with the new species accumulating a high level ofgenetic diversity. We investigate speciation in Drimysconfertifolia, endemic to the two major islands of the JuanFernández Archipelago, Chile, to determine genetic consequences of anagenesis, to examine relationships amongElectronic supplementary material The online version of thisarticle (doi:10.1007/s10265-014-0666-7) contains supplementarymaterial, which is available to authorized users.P. López-Sepúlveda M. Baeza E. RuizDepartamento de Botánica, Universidad de Concepción,Casilla 160-C, Concepción, ChileK. TakayamaThe University Museum, The University of Tokyo,Hongo 7-3-1, Bunkyo-ku, Tokyo 113-0033, JapanJ. Greimler G. KohlDepartment of Systematic and Evolutionary Botany,Biodiversity Center, University of Vienna, Rennweg 14,1030 Vienna, Austriapopulations of D. confertifolia and the continental speciesD. winteri and D. andina, and to test probable migrationroutes between the major islands. Population geneticanalyses were conducted using AFLPs and nuclearmicrosatellites of 421 individuals from 42 populationsfrom the Juan Fernández islands and the continent. Drimysconfertifolia shows a wide genetic variation within populations on both islands, and values of genetic diversitywithin populations are similar to those found within populations of the continental progenitor. The genetic resultsare compatible with the hypothesis of high levels of geneticvariation accumulating within anagenetically derived species in oceanic islands, and with the concept of little or noA. GaticaLaboratorio de Ecofisiologı́a Vegetal, Departamento de Biologı́a,Facultad de Ciencias, Universidad de La Serena,Casilla 599, La Serena, ChileL. LetelierCentro de Investigaciones en Ecosistemas, Universidad NacionalAutónoma de México, C.P. 58190 Morelia, Michoacán, MexicoP. NovoaJardı́n Botánico de Viña del Mar, Corporación Nacional Forestal,Camino El Olivar 305, Viña del Mar, ChileD. J. CrawfordDepartment of Ecology and Evolutionary Biology and theBiodiversity Institute, University of Kansas, Lawrence,KS 60045, USAJ. NovakInstitute for Applied Botany and Pharmacognosy, University ofVeterinary Medicine, Veterinärplatz 1, 1210 Vienna, AustriaP. PeñaililloInstituto de Biologı́a Vegetal y Biotecnologı́a, Universidad deTalca, 2 Norte 685, Talca, ChileT. F. Stuessy (&)Herbarium, Department of Evolution, Ecology, and OrganismalBiology, The Ohio State University, 1315 Kinnear Road,Columbus, OH 43212, USAe-mail: stuessy.1@osu.eduK. TremetsbergerDepartment of Integrative Biology and Biodiversity Research,Institute of Botany, University of Natural Resources and LifeSciences, Gregor Mendel Straße 33, 1180 Vienna, Austria123
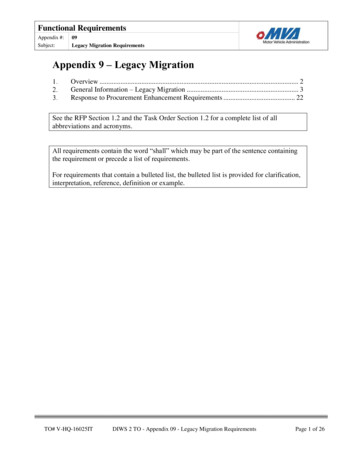
74geographical partitioning of this variation over the landscape. Analysis of the probability of migration within thearchipelago confirms colonization from the older island,Robinson Crusoe, to the younger island Alejandro Selkirk.Keywords AFLPs Anagenesis Genetic variation Microsatellites Oceanic islands MigrationIntroductionPatterns and processes of speciation in oceanic islands havelong captured the attention of evolutionary biologists(Drake et al. 2002; Rosindell and Phillimore 2011;Schaefer et al. 2011; Stuessy and Ono 1998). Importantattributes of oceanic islands, such as geographical isolation, clearly delimited area, and restricted fauna and flora,have led to islands being regarded as natural laboratoriesfor the study of evolution. They offer countless opportunities for investigating evolutionary processes in detail,especially for studying genetic, ecological, biogeographic,reproductive, and morphological divergence (Moore et al.2002; Mort et al. 2002).Numerous hypotheses and discussions regarding processes of speciation in oceanic islands have occurred(Carlquist 1974; Grant et al. 1996; Stuessy et al. 2006). Themost commonly described speciation mechanism in islandsis through cladogenesis. In this process, after a singleintroduction, numerous lineages diverge rapidly from thefounding population as they adapt to different habitats withappropriate adaptations (Schluter 2000). The genetic consequence of this process is low level of genetic variationwithin and among populations of each species (Baldwinet al. 1998; Crawford and Stuessy 1997; Emerson 2002;Johnson et al. 2000; Stuessy et al. 2006). Examples of thismechanism of divergence and speciation in oceanic islandsare numerous, such as Aeonium (Crassulaceae) and Echium(Boraginaceae) in the Canary Islands (Böhle et al. 1996;Jorgensen and Olesen 2001), Dendroseris and Robinsonia(Asteraceae) in the Juan Fernández Archipelago (Crawfordet al. 1998), Bidens (Asteraceae), Schiedea (Caryophyllaceae), Cyanea, Lobelia and Trematolobelia (Lobeliaceae)in the Hawaiian Islands (Givnish et al. 2009; Knope et al.2012; Price and Wagner 2004), and Scalesia (Asteraceae)in the Galápagos Islands (Eliasson 1974; Schilling et al.1994).The other major type of speciation in oceanic islands isanagenesis, also called simple geographic or phyletic speciation (Simpson 1953). In this case, after colonizersestablish a population on a new island, the processes ofdrift, recombination, and mutation modify the compositionof the original pioneer population and over time geneticvariation accumulates by the processes of recombination,123J Plant Res (2015) 128:73–90and mutation. The final result is a new species that differsgenetically and morphologically from its ancestor, withlevels of genetic variation approximating those of theprogenitor species (Stuessy et al. 2006). Examples of thistype of speciation are less frequent, but it has been documented in Dystaenia (Apiaceae; Pfosser et al. 2006) andAcer (Sapindaceae; Takayama et al. 2012a, b) of UllungIsland, Korea, and in Weigela (Caprifoliaceae; Yamada andMaki 2012) of the Izu Islands, Japan. The genetic consequences of anagenetic speciation show relatively highlevels of genetic differentiation within and among populations of the island endemic relative to continental sourcepopulations. Obviously, many factors impact levels ofgenetic variation within island populations, such asbreeding systems, island age, human impact, etc. (Stuessyet al. 2013), but mode of speciation is particularlysignificant.Also important for understanding patterns and processesof evolution in oceanic islands is inferring routes ofmigration among islands within archipelagos. The classicalhypothesis regarding archipelagos has assumed a singlecolonization event from a continental area first to the oldestisland and subsequent colonization of the younger islands(Juan et al. 2000; Gillespie and Roderick 2002), the socalled ‘‘progression rule’’ (Funk and Wagner 1995).Although this concept relies on parsimony, which is notunreasonable, other possibilities have been demonstrated,such as reverse colonization (Ballemain and Ricklefs 2008;Carine et al. 2004), colonization followed by extinction, ormigration from younger to older islands (Emerson 2002;Juan et al. 2000). Obviously important also are availabilityof transportation vectors (Gillespie and Roderick 2002) andadaptation and dispersal of propagules (Cowie and Holland2006).An appropriate group of islands in which to study anagenetic speciation and migration is the Juan FernándezArchipelago, located in the Pacific Ocean 667 km W ofcontinental Chile (33 S/78–80 W, Fig. 1). The archipelagoconsists of two main islands, Robinson Crusoe ( Masatierra) and Alejandro Selkirk ( Masafuera), separated by181 kms. At present the islands are approximately of equalsize (50 km2, Stuessy 1995), but they differ in geologicalage, c. 4 million years old for Robinson Crusoe Island and1–2 million years old for Alejandro Selkirk Island (Stuessyet al. 1984). The native vascular flora of the archipelagoincludes 75 families, 213 genera, and 361 species, with a12 % endemism at the generic level, and 60 % at thespecific level (Marticorena et al. 1998).A suitable genus to study the genetic consequences ofanagenetic speciation and migration in the Juan FernándezArchipelago is Drimys (Winteraceae). The genus containsseven species distributed in Central and South America(Ehrendorfer et al. 1979; Marquı́nez et al. 2009; Rodrı́guez
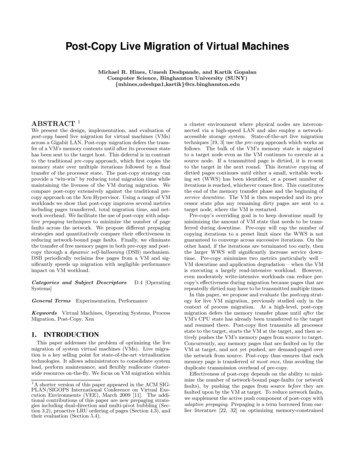
J Plant Res (2015) 128:73–9075Fig. 1 Geographical position ofpopulations sampled of Drimyswinteri and D. andina incontinental Chile (a) andDrimys confertifolia inRobinson Crusoe (b) andAlejandro Selkirk (c) Islandsand Quezada 2001; Smith 1943), two of which, D. andinaand D. winteri (with two varieties, var. winteri and var.chilensis), grow in continental Chile, with the others disjunct in Brazil and northwestern South America (withextensions northward into Mexico). Drimys confertifolia isendemic to the Juan Fernández Archipelago, common onRobinson Crusoe Island, and with a patchy distribution onAlejandro Selkirk Island. These three species comprise aclosely related complex, as evidenced by very similar ITSsequences (Ruiz et al. 2008).In recent years the number of molecular markersavailable to study genetic diversity and phylogeny inislands has increased significantly (Emerson 2002).Amplified Fragment Length Polymorphisms (AFLPs, Voset al. 1995), a dominant marker, has been shown to providea good overall measure of genetic diversity and structure atthe population level (Tremetsberger et al. 2003). Nuclearmicrosatellites are co-dominant highly polymorphicmarkers that are widely used to study the genetic structureof populations and migration routes (Hardy et al. 2006). Inthis study, therefore, we selected both methodologies toanalyze the genetic consequences of anagenesis andmigration in Drimys confertifolia.The objectives of this paper are to: (1) determine geneticrelationships and variation within and among populationsof D. confertifolia, D. andina, and D. winteri; (2) establishthe most probable migration route(s) of the endemic species between islands; and (3) assess genetic consequencesof island anagenetic speciation.Materials and methodsSpeciesDrimys confertifolia Phil., ‘‘Canelo’’ (Fig. 2a, b), is aprotogynous (and therefore out-crossing) tree (Bernardelloet al. 2001) to 15 m tall, endemic to the Juan FernándezArchipelago. Chromosomally the species is known asn c. 43 (Sun et al. 1990), which is probably at the dodecaploid level (based on x 7, Raven and Kyhos 1965).This is the same level reported for D. winteri (Raven andKyhos 1965) and D. granadensis (Ehrendorfer et al. 1979).In Robinson Crusoe Island D. confertifolia is common,growing together with Myrceugenia fernandeziana (Myrtaceae), Fagara mayu (Rutaceae), and Juania australis(Arecaceae) (Greimler et al. 2002). In Alejandro SelkirkIsland it occurs in patches or is scattered, not forming largepure stands, and growing together with the ferns Blechnumcycadifolium (Blechnaceae), Dicksonia externa (Dicksoniaceae), Histiopteris incisa (Dennstaedtiaceae), and Lophosoria quadripinnata (Dicksoniaceae) (Greimler et al.123
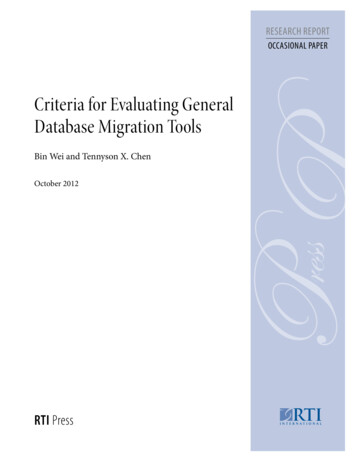
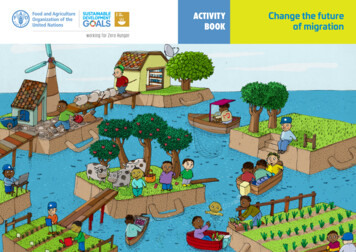
76J Plant Res (2015) 128:73–90Fig. 2 Habitats and flowers (insets) of D. confertifolia on Robinson Crusoe Island (a), D. confertifolia on Alejandro Selkirk Island (b), D. andina(c), and Drimys winteri var. winteri (d)2013). Drimys confertifolia is hermaphroditic and windpollinated (Bernardello et al. 2001), flowering fromNovember to January (Rodrı́guez and Quezada 2001).The continental species included in this study areD. andina (Reiche) R.A.Rodr. et Quez. This species(‘‘Canelo Enano’’ Fig. 2c), grows as a small shrub to 1.5 mtall, and is endemic to the subantarctic forest distributedalong the Andes and occasionally in the Coastal Cordillera(37 –41 S) (Rodrı́guez and Quezada 2001). The otherspecies is D. winteri J.R.Forst. et G.Forst. (Fig. 2d) withtwo recognized varieties, var. winteri (‘‘Canelo, foye’’) andvar. chilensis (DC.) A.Gray (‘‘Canelo’’). The former variety is a tree to 17 m, and is found in the subantarctic forestsin the extreme southern portion of Chile (45 440 –55 580 S)(Rodrı́guez and Quezada 2001). The latter variety is a largetree (to 20 m) and is common and endemic to continentalChile, growing from 0 to 1,700 m in the Coastal Cordilleraand the Andes Mountains between 30 200 –46 250 S (Rodrı́guez and Quezada 2001).123Collection and DNA isolationThe species were collected during expeditions to the JuanFernández Archipelago in 2010 and 2011. Leaves ofD. confertifolia were collected in silica gel from individuals of 16 populations on Robinson Crusoe Island(Nos. 1–16) and from 15 populations on Alejandro Selkirk Island (Nos. 17–31) (Fig. 1). In continental Chile,samples came from one population of D. andina (No. 32),two populations of D. winteri var. winteri (Nos. 41 and42), and eight populations of D. winteri var. chilensis(Nos. 33–40) were collected (Fig. 1; Table 1). Voucherspecimens of each population are deposited in the herbarium of the University of Vienna (WU). The DNeasy96 Plant Kit (Qiagen, Hilden, Germany) was used forextraction of DNA for AFLP and microsatellite analyses.Details of numbers of individuals and populations usedfor AFLP and microsatellites, and their distributions, aregiven in Table 1 and Fig. 1.
4141481512941011141012121166.8( 2196561965719658Average( SD)172004181998233110132117958.8( 0.073.854.5D. confertifolia Alejandro Selkirk IslandAverage( SD)119130D. confertifolia Robinson Crusoe IslandPPB414.7( 433.5( 442TNB0.180.22( 0.02)90.53( 0.000.250.210.24( .98( .76( .600.002.021.691.50( .441.791.561.711.64RI0.14( 0.38)0100001001000000.40( 138151393101115101212100.35( .290.630.310.400.48( 0.520.460.500.480.44HON N Taxon andvouchersNMicrosatellitesAFLPs0.50( .330.630.480.510.64( 0.660.680.640.670.66uHE0.21( ��1.000.35–0.14–1.000.19*0.160.21( .240.19*0.29*0.210.25*0.29*FIS3.73( .881.634.134.254.89( .005.254.884.884.50NA3.3( .503.254.24( 164.794.354.234.73AR0.47( 0.270.310.460.480.62( 0.640.650.610.640.63HE0.02( .000.000.000.000.04( 0.000.130.000.000.00NPA0.50( .250.380.630.500.75( .750.630.500.500.75NLCATable 1 Values of genetic diversity and divergence based on AFLP and nuclear microsatellite analysis in 42 populations of Drimys confertifolia, D. andina, D. winteri var. winteri andD. winteri var. chilensisJ Plant Res (2015) 128:73–9077123
242643214330240142242012108181511121214141647.0( 0.3( 34.5)30327235532026429930230124334438373.31( 3682.7391.920.17( .95( .3( 0.48)0010001001012101018131112111313130.47( .62( HE0.19( 1*0.17FIS4.71( A3.96( R0.60( E0.05( PA1.09( LCAN assigned population number, N number of individuals analyzed, PPB percentage of polymorphic bands, TNB total number of bands, SDI Shannon diversity index, AGDOL average gene diversity over loci, RI rarity index, NPBnumber of private bands, HO observed heterozygosity, lHE expected heterozygosity, FIS inbreeding coefficient, NA number of alleles per locus, AR allelic richness, HE expected proportion of heterozygotes, NPA number of privatealleles, NLCA number of locally common alleles (freq. C5 %) found in 25 % or fewer populations, – no data because the number was calculated with populations that contained seven or more individuals, * significant FIS values(P \ 0.05) after Bonferroni correctionPopulation data in italics, with four or fewer individuals, were not included in the statistical analysesAverage( SD)412402D. winteri var. winteri334D. winteri var. chilensis4324D. andinaHON N Taxon andvouchersNMicrosatellitesAFLPsTable 1 continued78J Plant Res (2015) 128:73–90
J Plant Res (2015) 128:73–90Genetic markersFor AFLPs we followed the protocol of Vos et al. (1995)with modifications by Tremetsberger et al. (2003). Forselection of primers, a trial was done with 85 primercombinations and four individuals from each of six populations representative of all taxa and islands. The followingfive primer combinations were selected: MseI–CTG/EcoRI–ACA (FAM); MseI–CTC/EcoRI–ACA (FAM);MseI–CAC/EcoRI–ATG (VIC); MseI–CAG/EcoRI–AAG(VIC); and MseI–CTC/EcoRI–AGC (NED). A total of 421individuals was analyzed, 279 from D. confertifolia, 16from D. andina, 104 from D. winteri var. chilensis, and 22from D. winteri var. winteri (for details see Table 1).Amplified fragments of DNA were run on an automatedsequencer (ABI 3130xl, Applied Biosystems, CA, USA).Fragments were scored using the program GeneMarkerver. 1.85 (SoftGenetics LLC, PA, USA). The range forallele call was 150–510 base pairs. Samples with sizecalibration below 90 % were manually adjusted. An automatic panel editor was generated for each selective primercombination (Curtin et al. 2007) and then manually modified. For analysis, the matrices generated for each primercombination were combined into one matrix (Wooten andTolley-Jordan 2009). Ten percent of the total individualswere replicated, the error rate being calculated as the ratioof number of fragment differences/total number of comparisons (Bonin et al. 2004).Nine nuclear microsatellites markers were selected andisolated from D. confertifolia (Takayama et al. 2011) basedon repeatability and scoring suitability. A total of 281individuals of D. confertifolia, 13 of D. andina, 101 of D.winteri var. chilensis, and 22 of D. winteri var. winteri wasanalyzed. For fluorescent labeling of PCR amplified fragments, we used the 50 -tailed primer method (BoutinGanache et al. 2001) following Takayama et al. (2011).Different dyes (6-FAM, NED, PET, and VIC) for fourcombinations of multiplex PCR amplification were used,following a modified protocol of the Qiagen MultiplexPCR Kit (Qiagen, Hilden, Germany). Four multiplex PCRreactions were done as follows: AWU5A, AOH4B with6-FAM, A3340, ATEAE with VIC, AWL0 W, A9194,AX48Q with NED, BDYVU, AOES3 with PET. Eachreaction was performed in a final volume of 3 lL containing 0.2 lM of each reverse primer, 0.04 lM of eachforward primer, and 0.6 lM of fluorescent dye-labeledprimer. Touchdown thermal cycling programs were used asfollows: initial denaturation at 95 C for 5 min, followedby 20 cycles of denaturation at 95 C for 30 s, annealing at63 C for 90 s (decreased 0.5 C per cycle), and extensionat 72 C for 60 s, plus 25 cycles of denaturation at 95 Cfor 30 s, annealing at 55 C for 90 s, and extension at72 C for 60 s; a final extension step was performed at7960 C for 30 min. The amplified fragments were run with asize standard (GeneScan 600, Applied Biosystems, FosterCity, CA, USA) on an automated sequencer (ABI 3130xl).GeneMarker ver. 1.85 (SoftGenetics LLC) was used forscoring.Data analysisFor AFLPs the program ARLEQUIN 3.5.1.2 (Excoffieret al. 2005) was used for calculating the total number ofdifferent phenotypes in each population and the averagegene diversity over loci (AGDOL; the probability thattwo homologous band sites, randomly chosen, are different). The estimations of other genetic diversityparameters by populations, i.e., percentage of polymorphic bands (PPB), total number of AFLP bands(TNB), and Shannon Diversity Index (SDI) (HSh -R[pi ln(pi)] where pi is the frequency of the ith band inthe respective population based on all AFLP bandsrecorded) were performed using FAMD ver. 1.25(Schlüter and Harris 2006).With respect to genetic divergence parameters andpopulation structure, the number of private bands (NPB)was calculated with FAMD ver. 1.25 (Schlüter and Harris2006), and the Rarity Index (RI) (Schönswetter and Tribsch2005) was estimated with R-script AFLPdat (Ehrich 2006).Pairwise FST were calculated according to Weir andCockerham (1984), and the probabilities of randomdeparture from zero for obtaining FST were calculatedusing the exact test with 10,000 permutations in ARLEQUIN 3.5.1.2. (Excoffier et al. 2005). A NeighborNet algorithm (Bryant and Moulton 2004), implemented by thesoftware SplitsTree4 ver. 4.10 (Huson and Bryant 2006),was executed using a Nei-Li distance matrix calculatedfrom the original AFLP matrix. An analysis of molecularvariance (AMOVA) with ARLEQUIN 3.5.1.2 (Excoffieret al. 2005) was implemented for estimating genetic differentiation among and within populations (hierarchicalstructuring). For calculation of probabilities, 1,023 permutations were used, which reveals significance of thevariance components. For appraisement of populationstructure (with a Bayesian clustering method), the programSTRUCTURE 2.3.3 (Falush et al. 2007; Hubisz et al. 2009;Pritchard et al. 2000) was employed. To assign individualsinto K clusters, an admixture model with correlated allelefrequencies (Falush et al. 2003) was used. The number ofsteps was 100,000, with 50,000 iterations, and 10 replicateruns in each K from 1 to 10. The highest level of structurewas deduced from a posterior probability of the data for agiven K and DK value (Evanno et al. 2005). A Pearsoncorrelation was used to test correlation between values ofgenetic diversity and genetic divergence, and a Mann–Whitney U test was performed to compare means of123
80independent samples for the previous parameters. In bothcases the program SPSS ver. 15.0 (ÓSPSS Inc.) was used.For microsatellites the program GENEPOP 4.0 (Raymond and Rousset 1995) was used to test linkage disequilibrium (LD) and significant deviation from Hardy–Weinberg equilibrium (HWE) between loci in each population (Markov chain method 10,000 dememorisationsteps, 1,000 batches, 500 iterations per batch). The frequency of null allele in each marker was calculated following Brookfield (1996) using Micro-Checker 2.2.3 (vanOosterhout et al. 2004). The genetic diversity parametersfor each species and population, allelic richness (AR),expected proportion of heterozygotes (HE), number ofalleles per locus (NA), and inbreeding coefficient (FIS),were calculated using FSTAT 2.9.3.2 (Goudet 1995).GENALEX 6 (Peakall and Smouse 2006) was used toestimate the genetic divergence parameters, number ofprivate alleles (NPA), and number of locally commonalleles (NLCA). Allelic richness was calculated for populations that contained seven or more individuals using therarefaction method (Hurlbert 1971). The genetic relationships among populations were evaluated by constructing a neighbor-joining tree based on DA geneticdistance (Nei et al. 1983) using the program Populations1.2.30 (Langella 1999). Pairwise FST, AMOVA,STRUCTURE, and Pearson correlation were estimated inthe same way as with AFLP.The direction of migration between island populationsof D. confertifolia was inferred by using microsatellite databased on the log Bayes factor (LBF) as per the modelranking method (Beerli and Palczewski 2010) using thecoalescent based MCMC method implemented in Migrate3 (Beerli and Felsenstein 1999, 2001). The LBFs based onthe Bézier approximation score and harmonic mean wereestimated using microsatellite data. We compared the nullmodel of no migration (M0) to the models of unidirectionalmigration from Alejandro Selkirk to Robinson CrusoeIsland (M1) and vice versa (M2). In order to standardizepopulation sizes, the 16 populations of D. confertifolia inRobinson Crusoe Island and 15 populations in AlejandroSelkirk Island were pooled each and randomly sampled foreach replicate (50 individuals from each region). Runswere carried out under a Brownian model multiple timeswith varying parameter settings to achieve convergence,and for the final MCMC parameters were one long chainwith 200,000 recorded steps and 100-step increment with aburn-in of 10,000. Uniform priors (minimum, maximum,and delta) were placed for both theta (0, 20, and 2) andM (0, 20, and 2). Ten replicates of single long Markovchains were implemented using different random numberseeds. The MIGRATE analysis was performed at theUniversity of Oslo Bioportal (https://www.bioportal.uio.no/).123J Plant Res (2015) 128:73–90ResultsAFLPsAmong the species of Drimys, we found a total of 583fragments, of which 574 are polymorphic (98.5 %,Table 1). In D. confertifolia the total number of fragmentsis 576 (100 % polymorphic bands), in D. andina 383fragments (373 bands polymorphic, 97.4 %), and D. winteri 485 fragments (438 polymorphic, 90.3 %, Table 1).With each pair of primers, the numbers of fragments ineach species (D. confertifolia/D. andina/D. winteri) are:153/81/126/for primers MseI–CTG/EcoRI–ACA (FAM);120/76/102 for MseI–CAC/EcoRI–ATG (VIC); 112/72/80for MseI–CTC/EcoRI–ACA (FAM); 104/58/76 for MseI–CAG/EcoRI–AAG (VIC); and 77/42/54 for MseI–CTC/EcoRI–AGC (NED). All individuals had unique AFLPphenotypes. The reproducibility of the bands was 95 %.MicrosatellitesAll microsatellite markers, except for one marker AOES3,were successfully genotyped in 281 individuals of D.confertifolia, 123 of D. winteri, and 13 of D. andina. Themarker AOES3 resulted in no amplification in two populations of D. confertifolia, and several populations of D.winteri and of D. andina. Hence, we used the remainingeight markers for further population analyses. An exact testfor HWE across populations and loci showed 14 of 248 inD. confertifolia, six of 80 in D. winteri, and one of eight inD. andina deviating from HWE with a positive FIS,(P \ 0.05) after Bonferroni correction. The frequency ofnull alleles across populations and loci was estimated usingMicro-Checker, resulting in the highest frequency of 0.188(AWL0W), with an average frequency of 0.080 in all of theeight markers. Significant LD was not found between anypairwise combination of loci in all populations within eachspecies (P \ 0.05) after Bonferroni correction.Genetic diversityThe AFLP measures of genetic diversity in populations ofDrimys analyzed are shown in Table 1. The average estimates of genetic diversity in D. confertifolia, from Robinson Crusoe/Alejandro Selkirk Islands, are for percentageof polymorphic bands (PPB) 66.8/58.8; for total number ofbands (TNB) 433.5/414.7; for Shannon Diversity Index(SDI) 103.98/90.53; and for average genetic diversity overloci (AGDOL) 0.24/0.22. All estimates reveal a similarpattern and are highly correlated with r ranging from 0.897to 0.956 (n 22, P \ 0.001). This pattern holds whenthose correlations on the single islands were tested. Comparisons of genetic diversity between populations on the
J Plant Res (2015) 128:73–9081Table 2 Genetic diversity with AFLP and microsatellites for Drimysconfertifolia, D. winteri, and D. andinaSpeciesAFLPAGDOLMicrosatellitesHED. confertifolia Robinson Crusoe Island0.2590.685D. confertifolia Alejandro Selkirk Island0.2340.509D. confertifolia (combined)D. winteri0.2760.2080.6750.733D. andina0.2030.501AGDOL average gene diversity over loci, HE expected proportion ofheterozygotesnorthern side of Robinson Crusoe Island (1–7) with populations on the southern side (9–16) show significant differences in the parameters TNB, SDI, and AGDOL. InAlejandro Selkirk Island, the northern populations (17, 18,23) are not significantly different in all genetic diversityparameters from the southern populations (28–31). Overallthe genetic diversity within populations is higher on Robinson Crusoe Island (average SDI 103.98 6.88) than onAlejandro Selkirk Island (average SDI 90.53
The University Museum, The University of Tokyo, Hongo 7-3-1, Bunkyo-ku, Tokyo 113-0033, Japan . Auto noma de Me xico, C.P. 58190 Morelia, Michoaca n, Mexico . of the original pioneer population and over time genetic variation accumulates by the processes of recombination,