Transcription
Image description. Cover Image End of image description.What Is IPEDS?The Integrated Postsecondary Education DataSystem (IPEDS) is a system of survey componentsthat collects data from all institutions that providepostsecondary education and are eligible to receiveTitle IV funding across the United States and otherU.S. jurisdictions.These data are used at the federal and state level forpolicy analysis and development; at the institutionallevel for benchmarking and peer analysis; and bystudents and parents, through the College Navigator(https://nces.ed.gov/collegenavigator/), an online toolto aid in the college search process. Additionalinformation about IPEDS can be found on thewebsite at https://nces.ed.gov/ipeds.What Is the Purpose of This Report?The Data Feedback Report is intended to provideinstitutions a context for examining the data theysubmitted to IPEDS. The purpose of this report is toprovide institutional executives a useful resource andto help improve the quality and comparability ofIPEDS data.What Is in This Report?The figures in this report provide a selection ofindicators for your institution to compare with a groupof similar institutions. The figures draw from the datacollected during the 2019-20 IPEDS collection cycleand are the most recent data available. The insidecover of this report lists the pre-selected comparisongroup of institutions and the criteria used for theirselection. The Methodological Notes at the end of thereport describe additional information about theseindicators and the pre-selected comparison group.Where Can I Do More with IPEDS Data?Each institution can access previously released DataFeedback Reports from 2005 and customize this2020 report by using a different comparison groupand IPEDS variables of its choosing. To learn how tocustomize the 2020 report, visit this resource pagehttps://nces.ed.gov/Ipeds/Help/View/2. To downloadarchived reports or customize the current DataFeedback Report, visit the ‘Use the Data’ portal onthe IPEDS website https://nces.ed.gov/ipeds andclick on Data Feedback Report.Missouri State University-SpringfieldSpringfield, MO
Missouri State University-SpringfieldCOMPARISON GROUPComparison group data are included to provide a context for interpreting your institution’s indicators. If your institution did not define a customcomparison group for this report by July 13, 2020 NCES selected a comparison group for you. (In this case, the characteristics used to definethe comparison group appears below.) The customized Data Feedback Report function available at https://nces.ed.gov/ipeds/use-the-data/can be used to reproduce the figures in this report using different peer groups.The custom comparison group chosen by Missouri State University-Springfield includes the following 65 institutions:Bowie State University (Bowie, MD)California State Polytechnic University-Pomona (Pomona, CA)California State University-Dominguez Hills (Carson, CA)California State University-Fresno (Fresno, CA)Cleveland State University (Cleveland, OH)College of Staten Island CUNY (Staten Island, NY)Coppin State University (Baltimore, MD)CUNY Medgar Evers College (Brooklyn, NY)DePaul University (Chicago, IL)Florida International University (Miami, FL)Harrisburg University of Science and Technology (Harrisburg, PA)Indiana University-Northwest (Gary, IN)Indiana University-Purdue University-Indianapolis (Indianapolis, IN)Louisiana State University Health Sciences Center-Shreveport (Shreveport, LA)Metropolitan State University (Saint Paul, MN)Metropolitan State University of Denver (Denver, CO)Miami Dade College (Miami, FL)Morgan State University (Baltimore, MD)North Carolina Central University (Durham, NC)Northern Kentucky University (Highland Heights, KY)Old Dominion University (Norfolk, VA)Pace University (New York, NY)Portland State University (Portland, OR)Rutgers University-Camden (Camden, NJ)Rutgers University-Newark (Newark, NJ)San Jose State University (San Jose, CA)Southern Illinois University-Edwardsville (Edwardsville, IL)SUNY Buffalo State (Buffalo, NY)Syracuse University (Syracuse, NY)Temple University (Philadelphia, PA)Texas State University (San Marcos, TX)The University of Tennessee-Chattanooga (Chattanooga, TN)Towson University (Towson, MD)University of Alaska Anchorage (Anchorage, AK)University of Arkansas at Little Rock (Little Rock, AR)University of Arkansas-Fort Smith (Fort Smith, AR)University of Baltimore (Baltimore, MD)University of Central Florida (Orlando, FL)University of Central Oklahoma (Edmond, OK)University of Colorado Denver/Anschutz Medical Campus (Denver, CO)University of Houston (Houston, TX)University of Louisville (Louisville, KY)University of Massachusetts-Boston (Boston, MA)University of Michigan-Dearborn (Dearborn, MI)University of Missouri-Kansas City (Kansas City, MO)University of Missouri-St Louis (Saint Louis, MO)University of Nebraska at Omaha (Omaha, NE)University of Nevada-Las Vegas (Las Vegas, NV)University of New Haven (West Haven, CT)University of North Carolina at Charlotte (Charlotte, NC)University of North Carolina at Greensboro (Greensboro, NC)University of North Florida (Jacksonville, FL)University of North Texas (Denton, TX)University of South Carolina-Upstate (Spartanburg, SC)University of the District of Columbia (Washington, DC)University of Washington-Tacoma Campus (Tacoma, WA)University of Wisconsin-Milwaukee (Milwaukee, WI)University of Wisconsin-Parkside (Kenosha, WI)Virginia Commonwealth University (Richmond, VA)Wagner College (Staten Island, NY)Wayne State University (Detroit, MI)Weber State University (Ogden, UT)Westfield State University (Westfield, MA)Widener University (Chester, PA)Wright State University-Main Campus (Dayton, OH)The figures in this report have been organized and ordered into the following topic areas:Topic AreaFiguresPages1) Admissions (only for non-open-admissions schools)1 and 232) Student Enrollment3, 4 and 53 and 43) Awards644) Charges and Net Price7 and 84 and 55) Student Financial Aid9 and 1056) Military Benefits*[No charts applicable]7) Retention and Graduation Rates11, 12, 13, 14, 15, 16, 17, 18 and 195, 6, 7, 8 and 98) Finance20 and 21109) Staff22 and 231010) Libraries*24 and 2511*These figures only appear in customized Data Feedback Reports (DFRs), which are available through Use the Data portal on the IPEDS website.IPEDS DATA FEEDBACK REPORT
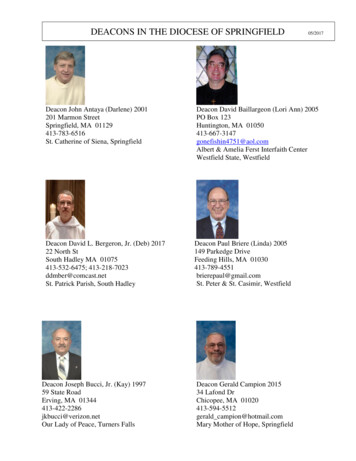
2Missouri State University-SpringfieldFigure 1.Number of first-time undergraduate students whoapplied, were admitted, and enrolled full and part time:Fall 2019Figure 2.Image description.AdmissionsBarmeasureHorizontalchart with4 groups with 2 items per group.Xscale titledtitled ScaleNumberof itution7581.Item2,ComparisonGroupMedian (N 58) em2,ComparisonMedian (N 58) 641.Item 1,2, YourComparisonGroupMedian (N 58) 38. Median (N 58) tutionLegend,Label: Your institutionShapeComparisonGroupLegend,End of image description. Label: Comparison Group Median (N 58)Percent of first-time undergraduate applicants admitted,and percent of admitted students enrolled full and parttime: Fall 2019Image description.AdmissionsBarmeasureHorizontalchart with3 groups with 2 items per group.Xscale titledtitled ScalePercentof titution88. Median (N 58) 1,2,Yourinstitution40. Median (N 58) eminstitution1. Median (N 58) 1.Item 1,2, nLegend,Label: Your institutionShapeComparisonGroupLegend,End of image description. Label: Comparison Group Median (N 58)Admissions measureAdmissions 8,47940Enrolled full time252,641Enrolled full time1,8941Enrolled part time38Enrolled part umber of studentsYour institutionComparison Group Median (N 58)Your institutionNOTE: Admissions data are presented only for institutions that do not have an openadmission policy, and apply to first-time, degree/certificate-seeking undergraduatestudents only. For details, see the Methodological Notes. N is the number of institutions inthe comparison group.SOURCE: U.S. Department of Education, National Center for Education Statistics,Integrated Postsecondary Education Data System (IPEDS): Winter 2019-20, Admissionscomponent.Figure 3.5060708090100Percent of studentsComparison Group Median (N 58)NOTE: Admissions data are presented only for institutions that do not have an openadmission policy, and apply to first-time, degree/certificate-seeking undergraduatestudents only. For details, see the Methodological Notes. See 'Use of Median Values forComparison Group' for how median values are determined. N is the number of institutionsin the comparison group.SOURCE: U.S. Department of Education, National Center for Education Statistics,Integrated Postsecondary Education Data System (IPEDS): Winter 2019-20, Admissionscomponent.Percent of all students enrolled, by race/ethnicity, and percent of students who are women: Fall 2019Image description.BarchartwithScale10 groupsX scalescaletitledlabel.with 2 items per group.YtitledPercent.GroupAmericanIndianor Alaska nGroupMedian (N 65) 0.01.Group2,Asian.Iteminstitution2. Median (N 65) 5.Item 1,2, YourComparisonGroupGroupBlackor AfricanItem1,3,Yourinstitution4. American.Item2,ComparisonGroupMedian (N 65) 11.GroupHispanic/Latino.Item1,4,Yourinstitution4. Median (N 65) 11.Item2,ComparisonGroupGroupNativeHawaiianor other Pacific Islander.Item n (N 65) 0.01.GroupWhite.Item1,6,Yourinstitution80. Median (N 65) 51.Item2,ComparisonGroupGroup7,Twoinstitutionor moreraces.Item1,Your4. Median (N 65) 4.Item 2,8,ComparisonGroupGroupRace/ethnicityItem1, an (N 65) 2.GroupNonresidentalien.Item1,9,Yourinstitution5. Median (N 65) titution59. Median (N 65) 58.Item2,ComparisonGroupRace/ethnicityor : Your institutionShapeComparisonGroupLegend,End of image description. Label: Comparison Group Median (N 40422550American Indian orAlaska NativeAsianBlack or AfricanAmericanHispanic/LatinoNative Hawaiian orother Pacific IslanderWhiteTwo ormore racesRace/ethnicityunknownNonresident alienWomenRace/ethnicity or genderYour institutionComparison Group Median (N 65)NOTE: For more information about disaggregation of data by race and ethnicity, see the Methodological Notes. Median values for the comparison group will not add to 100%. See 'Use ofMedian Values for Comparison Group' for how median values are determined. N is the number of institutions in the comparison group.SOURCE: U.S. Department of Education, National Center for Education Statistics, Integrated Postsecondary Education Data System (IPEDS): Spring 2020, Fall Enrollment component.IPEDS DATA FEEDBACK REPORT3
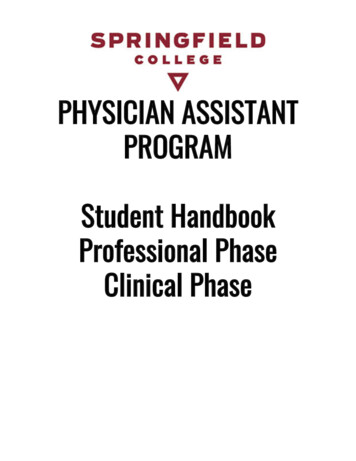
Missouri State University-SpringfieldFigure 4.Unduplicated 12-month headcount of all students and ofundergraduate students (2018-19), total FTE enrollment(2018-19), and full- and part-time fall enrollment (Fall2019)Image description.EnrollmentBarmeasureHorizontalchart with5 groups with 2 items per group.Xscale titledtitled ScaleNumberof students.Yscalelabel.GroupUnduplicatedheadcount - nGroupMedian- (N Median (N 65) 14651.GroupTotalFTE enrollment.Item an (N 65) titution15657.Item2,ComparisonGroupMedian (N 65) on7796.Item 1,2, YourComparisonGroupMedian (N 65) 4390.Shapeline,Label:ShapeInstitutionLegend,Label: Your institutionShapeComparisonGroupLegend,End of image description. Label: Comparison Group Median (N 65)Figure 5.Percent of students enrolled in distance educationcourses, by amount of distance education and studentlevel: Fall 2019Image description.Distance h6 groups with 2 items per group.Xscale titledtitledof students.YscaleScale label.GroupUndergraduatesin distance education (N 65).Item1,1,Yourinstitution5. aduatesat least5.one but not all distance education courses (N isonGroupGroupUndergraduatesin any32.distance education (N 65).Item an63. in distance education (N stitution36. MedianItem2,ComparisonGroup16. one but not all distance education courses (N 63).Group5,Graduatestudentsin at leastIteminstitution20. MedianItem 1,2, YourComparisonGroup14. in any distance education (N 63).GroupGraduatestudentsnot enrolledItem1,6,Yourinstitution43. eInstitutionLegend,Label: Your institutionShapeComparisonGroupLegend,End of image description. Label: Comparison Group MedianEnrollment measureDistance education participation18,1963032Undergraduates in at least one but not all distance.22,530Unduplicated headcount -.55Undergraduates exclusivelyin distance education (N 65)27,138Unduplicatedheadcount - total14,6516563Undergraduates not inany distance education (N 65)18,463Total FTEenrollment12,19336Graduate students exclusively indistance education (N 63)1615,657Full-timefall enrollment10,2737,796Part-timefall enrollment5,0001443Graduate students not enrolledin any distance education (N 63)4,390020Graduate students in at least one but not all distance.10,00015,00020,00025,00030,00066020Number of studentsYour institution406080Percent of studentsComparison Group Median (N 65)Your institutionComparison Group MedianNOTE: For details on calculating full-time equivalent (FTE) enrollment, see CalculatingFTE in the Methodological Notes. Total headcount, FTE, and full- and part-time fallenrollment include both undergraduate and postbaccalaureate students, when applicable.N is the number of institutions in the comparison group.SOURCE: U.S. Department of Education, National Center for Education Statistics,Integrated Postsecondary Education Data System (IPEDS): Fall 2019, 12-monthEnrollment component and Spring 2020, Fall Enrollment component.NOTE: N is the number of institutions in the comparison group.SOURCE: U.S. Department of Education, National Center for Education Statistics,Integrated Postsecondary Education Data System (IPEDS): Spring 2020, Fall Enrollmentcomponent.Figure 6.Figure 7.Number of degrees awarded, by level: 2018-19Image description.DegreelevelHorizontalBarNumberchart with6 groups with 2 items per group.Xscale titledtitledof omparisonGroup(N 65) 18.GroupDoctor'sProfessionalPractice.Item (N 65) Median (N 65) itution1035.Item 1,2, YourComparisonGroupMedian (N 65) em2,ComparisonGroupMedian (N 65) Median (N 65) titutionLegend,Label: Your isonGroup Median (N 65)End of image description.Image description.AcademicyearHorizontalBarTuitionchart withgroups with 2 items per group.Xscale titledtitledand 4fees.YscaleScale label.Group2019-20.Item1,1,Yourinstitution 7588.Item2,ComparisonGroupMedian (N 64) 9535.Group2018-19.Item 2,1,2,Yourinstitution 7376.ItemComparisonGroupMedian (N 64) 9032.Group2017-18.Item1,3,Yourinstitution 7306.Item2,ComparisonGroupMedian (N 64) 8804.Group4,2016-17.Iteminstitution 7060.Item 1,2, YourComparisonGroupMedian (N 64) 8570.Shapeline,Label:ShapeInstitutionLegend,Label: Your institutionShapeComparisonGroupLegend,End of image description. Label: Comparison Group Median (N 64)Degree levelDoctor's Research/.Tuition and required fees for full-time, first-timedegree/certificate-seeking undergraduates: Academicyears 2016-17 to 2019-20Academic year018 7,5882019-20 9,53513239Doctor's Professional. 7,3762018-19Doctor's 0Other 0 9,0321,035Master's728 7,3062017-18 8,8043,607Bachelor's2,224 7,060Associate's2016-17000 8,5701,0002,0003,0004,000 0Number of degreesYour institution 4,000 6,000 8,000 10,000Tuition and feesComparison Group Median (N 65)NOTE: For additional information about postbaccalaureate degree levels, see theMethodology Notes. N is the number of institutions in the comparison group.SOURCE: U.S. Department of Education, National Center for Education Statistics,Integrated Postsecondary Education Data System (IPEDS): Fall 2019, Completionscomponent. 2,000Your institutionComparison Group Median (N 64)NOTE: The tuition and required fees shown here are the lowest reported from thecategories of in-district, in-state, and out-of-state. N is the number of institutions in thecomparison group.SOURCE: U.S. Department of Education, National Center for Education Statistics,Integrated Postsecondary Education Data System (IPEDS): Fall 2019, InstitutionalCharacteristics component.IPEDS DATA FEEDBACK REPORT4
Missouri State University-SpringfieldFigure 8.Average net price of attendance for full-time, first-timedegree/certificate-seeking undergraduate students, whowere awarded grant or scholarship aid: 2016-17 to 201819Image description.Academic yearHorizontalBarNetchartwith 3 groups with 2 items per group.Xscale em1,1,Yourinstitution 16134.Item2,ComparisonGroupMedian (N 64) 13800.Group2017-18.Item1,2,Yourinstitution 15783.Item2,ComparisonGroupMedian (N 64) 13744.Group2016-17.Item 2,1,3,Yourinstitution 15173.ItemComparisonGroupMedian (N 64) : Your institutionShapeComparisonGroupLegend,End of image description. Label: Comparison Group Median (N 64)Figure 9.Percent of full-time, first-time degree/certificate-seekingundergraduate students who were awarded grant orscholarship aid, or loans, by type of aid: 2018-19Image description.Type of aidBar chart with 8 groups with 2 items per group.HorizontalXscale titledtitled ScalePercentof students.YscaleGroupAnyinstitutiongrant label.aid.77.Item1,1,YourItem2,ComparisonGroup Median (N 64) 83.GroupFederalgrants.Item1,2,Yourinstitution31. Median (N 64) pItem 2,1,3,Your31. Median (N 64) ,4,Yourinstitution40. Median (N 64) .Iteminstitution63. Median (N 64) 56.Item 1,2, YourComparisonGroupAnyinstitutionloans. GroupItem1,6,Your55. Median (N 64) oans. 11. Median (N 64) 49.Item1,8,YourinstitutionItem2,ComparisonGroup Median (N 64) 5.Shapeline,Label:ShapeInstitutionLegend,Label: Your institutionShapeComparisonGroupLegend,End of image description. Label: Comparison Group Median (N 64)Academic yearType of aidAny grantaid 16,1342018-19 ants 15,783834340392017-18Institutionalgrants 13,74456Any loans 15,1735550Federalloans2016-17635349 13,558Other loans 0 5,000 10,000 15,000 20,000115010203040Net priceYour institution5060708090100Percent of studentsComparison Group Median (N 64)Your institutionComparison Group Median (N 64)NOTE: Average net price is for full-time, first-time degree/certificate-seekingundergraduate students and is generated by subtracting the average amount of federal,state/local government, and institutional grant and scholarship awarded aid from the totalcost of attendance. Total cost of attendance is the sum of published tuition and requiredfees, books and supplies, and the average room and board and other expenses. Fordetails, see the Methodological Notes. N is the number of institutions in the comparisongroup.SOURCE: U.S. Department of Education, National Center for Education Statistics,Integrated Postsecondary Education Data System (IPEDS): Fall 2019, InstitutionalCharacteristics component and Winter 2019-20, Student Financial Aid component.NOTE: Any grant aid above includes grant or scholarship aid awarded from the federalgovernment, state/local government, or the institution. Federal grants includes Pell grantsand other federal grants. Any loans includes federal loans and other loans awarded tostudents. For details on how students are counted for financial aid reporting, see CohortDetermination in the Methodological Notes. N is the number of institutions in thecomparison group.SOURCE: U.S. Department of Education, National Center for Education Statistics,Integrated Postsecondary Education Data System (IPEDS): Winter 2019-20, StudentFinancial Aid component.Figure 10. Average amounts of awarded grant or scholarship aid, orloans awarded to full-time, first-time degree/certificateseeking undergraduate students, by type of aid: 2018-19Figure 11. Retention rates of first-time bachelor's degree seekingstudents, by attendance status: Fall 2018 cohortImage description.Typeof aidBar chart with 8 groups with 2 items per group.HorizontalXscale titledtitled ScaleAid dollars.YscaleGroupAnyinstitutiongrant label.aid 5819.(N 64).Item1,1,YourItem2,ComparisonGroupMedian 9101.GroupFederalgrants(N 64).Item 2,1,2,Yourinstitution 4862.ItemComparisonMedian 5154.GroupPellinstitutiongrants Group(N 64).Item1,3,Your grants(N 64). 4937.Iteminstitution 2022.Item 1,2, N 64). 3302.Item1,5,Yourinstitution 3420.Item2,ComparisonMedian 5046.GroupAnyinstitutionloans Group(N 64).Item1,6,Your 7039.Item2,ComparisonGroupMedian 6289.GroupFederalloans(N 64).Item1,7,Yourinstitution 5244.Item2,ComparisonMedian 5222.GroupOtherloansGroup(N 59).Item1,8,Yourinstitution 9711.Item2,ComparisonGroupMedian : Your institutionShapeComparisonGroupLegend,End of image description. Label: Comparison Group MedianImage description.AttendancestatusHorizontalBarchart with 2 groups with 2 items per group.Xscale eretentionrate (N 63).Item1,1,Yourinstitution78. ionrate (N 60).Item 2,1,2,Yourinstitution33. nstitutionLegend,Label: Your institutionShapeComparisonGroupLegend,End of image description. Label: Comparison Group MedianType of aidAttendance statusAny grantaid (N 64) 5,819Federalgrants (N 64) 4,862 5,154Pellgrants (N 64) 4,768 4,937State/localgrants (N 64) 9,10178Full-time retentionrate (N 63)76 2,022 3,302Institutionalgrants (N 64) 3,420 5,046Any loans(N 64) 7,039 6,289Federalloans (N 64)33Part-time retentionrate (N 60) 5,244 5,22246Other loans(N 59) 9,711 0 2,500 5,000 7,500 10,000 11,897 12,5000Aid dollarsYour institution2030405060708090100PercentComparison Group MedianNOTE: Any grant aid above includes grant or scholarship aid awarded from the federalgovernment, state/local government, or the institution. Federal grants includes Pell grantsand other federal grants. Any loans includes federal loans and other loans awarded tostudents. Average amounts of aid were calculated by dividing the total aid awarded by thetotal number of recipients in each institution. N is the number of institutions in thecomparison group.SOURCE: U.S. Department of Education, National Center for Education Statistics,Integrated Postsecondary Education Data System (IPEDS): Winter 2019-20, StudentFinancial Aid component.10Your institutionComparison Group MedianNOTE: Retention rates are measured from the fall of first enrollment to the following fall.Academic reporting institutions report retention data for the Fall 2018 cohort of studentswho are still enrolled as of the institution's official fall reporting date or as of October 15,2019. Program reporters determine the cohort with enrollment any time between August 1- October 31, 2018 and retention based on August 1, 2019. Four-year institutions reportretention rates for students seeking a bachelor's degree. For more details, see theMethodological Notes. N is the number of institutions in the comparison group.SOURCE: U.S. Department of Education, National Center for Education Statistics,Integrated Postsecondary Education Data System (IPEDS): Spring 2020, Fall Enrollmentcomponent.IPEDS DATA FEEDBACK REPORT5
Missouri State University-SpringfieldFigure 12. Graduation and transfer-out rates of full-time, first-timedegree/certificate-seeking undergraduates within 150%of normal time to program completion: 2013 cohortImage description.MeasureHorizontalBarPercent.chart with 2 groups with 2 items per group.Xscale titledtitledYscaleScale label.GroupGraduationrate,(N 64).Item1,1,Yourinstitution56. trate(N 48). 50.Item1,2,YourinstitutionNo data.Item2,ComparisonGroupMedian 25.Shapeline,Label:ShapeInstitutionLegend,Label: Your institutionShapeComparisonGroupLegend,End of image description. Label: Comparison Group MedianMeasure56Graduation rate,Overall (N 64)50Transfer-out rate(N 48)250102030405060708090100PercentYour institutionComparison Group MedianNOTE: Graduation rate cohort includes all full-time, first-time degree/certificate-seekingundergraduate students. Graduation and transfer-out rates are the Student Right-to-Knowrates. Only institutions with mission to prepare students to transfer are required to reporttransfer out. For more details, see the Methodological Notes. N is the number ofinstitutions in the comparison group.SOURCE: U.S. Department of Education, National Center for Education Statistics,Integrated Postsecondary Education Data System (IPEDS): Winter 2019-20, GraduationRates component.Figure 13. Graduation rates of full-time, first-time degree/certificate-seeking undergraduates within 150% of normal time to programcompletion, by race/ethnicity: 2013 cohortImage description.BarchartwithScale10 groupsX scalescaletitledlabel.with 2 items per group.YtitledPercent.GroupGraduationrate,(N 64).Item1,1,Yourinstitution56. ndianAlaska50.Native (N 54).Iteminstitution25. orItem 1,2, YourComparisonGroupMedian 39.GroupAsian(N 63).Item1,3,Yourinstitution61. Median 63.Item2,ComparisonGroupGroupBlackor African(N isonGroupMedian N ianother PacificIslander (N 46).Item1,6,Yourinstitution50. orItem2,ComparisonGroupMedian 47.Group7,White(N 64).Item 2,1, ComparisonYour institution58. Median 53.ItemGroupGroupTwoinstitutionor moreraces(N 62).Item1,8,Your48. yunknown (N 59).Item1,Yourinstitution39.Item (N 63).Item1, ComparisonYourinstitution65.Item2,GroupMedian 59.Graduationrates by nd,Label: Your institutionShapeComparisonGroupLegend,End of image description. Label: Comparison Group 4653534847473940253020100Graduation rate,Overall (N 64)American Indian orAlaska Native (N 54)Asian (N 63)Black or AfricanAmerican (N 64)Hispanic/Native Hawaiian orLatino (N 64) other Pacific Islander (N 46)White(N 64)Two ormore races (N 62)Race/ethnicityunknown (N 59)Nonresidentalien (N 63)Graduation rates by race/ethnicityYour institutionComparison Group MedianNOTE: For more information about disaggregation of data by race and ethnicity, see the Methodological Notes. The graduation rates are the Student Right-to-Know (SRK) rates. Medianvalues for the comparison group will not add to 100%. N is the number of institutions in the comparison group.SOURCE: U.S. Department of Education, National Center for Education Statistics, Integrated Postsecondary Education Data System (IPEDS): Winter 2019-20, Graduation Ratescomponent.IPEDS DATA FEEDBACK REPORT6
Missouri State University-SpringfieldFigure 14. Graduation rates of full-time, first-time degree/certificateseeking undergraduates within 150% of normal time toprogram completion, by type of aid: 2013 cohortFigure 15. Bachelor's degree graduation rates of full-time,first-time degree/certificate-seeking undergraduateswithin 4 years, 6 years, and 8 years: 2011 cohortImage description.Type of aidBar chart with 3 groups with 2 items per group.HorizontalXscale titledtitled ScalePercent.YscaleGroupPellinstitutiongrant. label.Item1,1,Your45. Median (N 64) Yourinstitution59. Median (N 64) 51.Item2,ComparisonGroupNeitherPellGroupgrantor Stafford loan.Item 2,1,3,Yourinstitution64. MedianItemComparisonGroup(N 64) 59.Shapeline,Label:ShapeInstitutionLegend,Label: Your institutionShapeComparisonGroupLegend,End of image description. Label: Comparison Group Median (N 64)Image description.Time to programcompletionHorizontalBarPercent.chartwith 3 groups with 2 items per group.Xscale titledtitledYscaleScale label.Group4 years.Item1,1,Yourinstitution31. Median (N 63) 21.Item2,ComparisonGroupGroup6 years.Item1,2,Yourinstitution55. Median (N 63) 48.Item2,ComparisonGroupGroup8 years.Item 2,1,3,
Syracuse University (Syracuse, NY) Temple University (Philadelphia, PA) Texas State University (San Marcos, TX) The University of Tennessee-Chattanooga (Chattanooga, TN) . Libraries* 24 and 25 11 *These figures only appear in customized Data Feedback Reports (DFRs), which are available through Use the Data portal on the IPEDS website. .