Transcription
ban31881 ch04.qxd6/14/019:07 AMPage 63CHAPTER 4Geometric DesignGeometric design for transportation facilities includes the design of geometric crosssections, horizontal alignment, vertical alignment, intersections, and various designdetails. These basic elements are common to all linear facilities, such as roadways,railways, and airport runways and taxiways. Although the details of design standardsvary with the mode and the class of facility, most of the issues involved in geometricdesign are similar for all modes. In all cases, the goals of geometric design are to maximize the comfort, safety, and economy of facilities, while minimizing their environmental impacts. This chapter focuses on the fundamentals of geometric design, andpresents standards and examples from different modes.The order of presentation of material in this chapter is to consider geometric crosssections first, then vertical alignment, horizontal alignment, superelevation, intersections, and various design details. For purposes of exposition, the order of the topics isnot very important. In a typical design project, on the other hand, there is a definiteorder of tasks, in which the establishment of a tentative horizontal centerline usuallyprecedes establishment of vertical alignment. This is because the elevation of the existing ground along the centerline is an important consideration in establishing the vertical alignment. The process of designing the vertical alignment begins with plotting aprofile of the existing terrain, and a tentative horizontal centerline must already be established in order to do this.4.1GEOMETRIC CROSS SECTIONThe primary consideration in the design of geometric cross sections for highways, runways, and taxiways is drainage. Details vary depending on the type of facility andagency.1,263
ban31881 ch04.qxd6/14/01649:07 AMCHAPTER4:Page 64Geometric DesignHighway cross sections consist of traveled way, shoulders (or parking lanes), anddrainage channels. Shoulders are intended primarily as a safety feature. They providefor accommodation of stopped vehicles, emergency use, and lateral support of thepavement. Shoulders may be either paved or unpaved. Drainage channels may consistof ditches (usually grassed swales) or of paved shoulders with berms or curbs and gutters. Figures 4.1 to 4.4 show various types of geometric cross sections. For so-callednormal crown sections (that is, no superelevation or banking of the roadway, as in ahorizontal curve) the traveled way slopes down from the centerline or other profilegrade line; roadway cross-slopes may either be constant or varying. Where crossslopes vary, the cross section may consist of either a parabolic section or one in whichShoulderDitchShoulderTraveled wayDitchForeslopeBackslopeFIGURE 4.1Two-lane highway cross section, with ditches.ShoulderShoulderTraveled wayFIGURE 4.2Two-lane highway cross section, curbed.ShouldersTraveled wayDitchTraveled wayMedianFIGURE 4.3Divided highway cross section, depressed median, with ditches.Ditch
ban31881 ch04.qxd6/14/019:07 AMPage 654.1 Geometric Cross Section65ShouldersTraveled wayMedianTraveled wayFIGURE 4.4Divided highway cross section, raised median, curbed.each lane has a constant cross-slope, but those of the outer lanes are greater than thoseof the inner lanes. For high-type roadways (such as freeways), cross-slopes are normally 1.5 to 2.0 percent. Shoulders or parking lanes slope away from the centerline at2 to 6 percent. As a general rule, superelevated sections will be constructed in a singleplane (including shoulders) if the rate of superelevation exceeds the normal crossslope of the shoulder.Where ditches are used, foreslopes should normally be 1:4 or flatter to preventdamage to vehicles or injury to occupants when traversed. Backslopes (cut or fillslopes) are discussed in more detail in Chapter 5. These are normally on the order of1:2 or 1:1.5 except in rock cuts, where they may sometimes be even vertical. Use of 1:3or flatter ditch backslopes facilitates the use of motorized equipment for maintenance,however; also, composite slopes (that is, two different slopes at different distancesfrom the roadway) are sometimes used.Standard lane widths are normally 3.6 m (12 ft.), although narrower lanes are common on older roadways, and may still be provided in cases where the standard lanewidth is not economical. Shoulders or parking lanes for heavily traveled roads are normally 2.4 to 3.6 m (8 to 12 ft.) in width; narrower shoulders are sometimes used onlightly traveled roads.Runway and taxiway cross sections are similar to those for highways, except thatcross-slopes are limited to 1 percent, with slopes of 1.5 percent on turf-covered areasimmediately outside the runway or taxiway.3Railway cross sections are as shown in Figure 4.5. The distance between the rails,as shown in the figure, is what is known as standard gage in North America. Other1.435 mRailRailTieBallastSubgradeFIGURE 4.5Railroad track geometric cross section.
ban31881 ch04.qxd6/14/01669:07 AMCHAPTER4:Page 66Geometric Designgages are sometimes used. In the case of railroad track, the shape of the cross sectionis not intended to provide drainage, since the ballast, which is permeable material,serves this purpose.44.2VERTICAL ALIGNMENTThe vertical alignment of a transportation facility consists of tangent grades (straightlines in the vertical plane) and vertical curves. Vertical alignment is documented by theprofile. To repeat what was said in Chapter 3, the profile is a graph that has elevationas its vertical axis and distance, measured in stations along the centerline or other horizontal reference line of the facility, as its horizontal axis.4.2.1 Tangent GradesTangent grades are designated according to their slopes or grades. Maximum gradesvary, depending on the type of facility, and usually do not constitute an absolute standard. The effect of a steep grade is to slow down the heavier vehicles (which typicallyhave the lowest power/weight ratios) and increase operating costs. Furthermore, theextent to which any vehicle (with a given power/weight ratio) is slowed depends onboth the steepness and length of the grade. The effect of the slowing of the heavier vehicles depends on the situation, and is often more a matter of traffic analysis than simple geometric design. Chapter 10, for instance, discusses the effects of slow-movingvehicles on highway capacity and level of service. As a result, the maximum grade fora given facility is a matter of judgment, with the tradeoffs usually being cost of construction versus speed. In the case of railroads, on the other hand, the tradeoff is aneconomic one, involving travel time, construction cost, and minimum power/weightratios for trains on various grades.Table 4.1 gives the maximum grades recommended for various classes of roadway by AASHTO. It should be understood that considerably steeper grades can beTABLE 4.1Recommended standards for maximum grades, percentType of terrainLevelRollingMountainousFreewaysRural highwaysUrban ��11Source: From A Policy on Geometric Design of Highways and Streets. Copyright 1994 by theAmerican Association of State Highway and Transportation Officials, Washington, DC. Usedby permission.
ban31881 ch04.qxd6/14/019:07 AMPage 674.2 Vertical Alignment 672000 / 100 20 lb per % of grade11002000 lbFIGURE 4.6Force diagram for calculating grade resistance.negotiated by passenger cars. In some urban areas, grades of minor streets may be assteep as 25 percent.In the case of railways, older freight lines were built with grades of up to 2 percent.Modern practice is to limit grades against the load to 0.5 percent where possible, andgrades against empty cars to 1.5 to 2.0 percent. The reason is that the rolling resistanceof rail vehicles is very low compared with the grade resistance. Consequently, itis economical to build very flat grades and use low power/weight ratios for trains.Figure 4.6 illustrates the calculation of grade resistance. As can be seen, the resistanceof the grade is approximately 20 lb/ton per 1 percent of grade. Rolling resistance,meanwhile, is around 3 lb/ton for level, tangent track in warm climates, where modernroller bearings are used. With this disproportion between rolling resistance and graderesistance, it makes sense to “underpower” trains and construct very level track, or elseroute lines so as to gain elevation gradually. The calculation of the distance the lineneeds to traverse in order to gain a certain amount of elevation, given a maximumgrade, is known in railway practice as development.Rail lines used for passenger traffic only, particularly urban rail transit systems,often use much steeper grades. Grades of up to 10 percent can be negotiated. Maximum grades for light rail systems are reported to be in the range of 6 to 9 percent;those for conventional “heavy” rail rapid transit systems are in the range of 3 to 4 percent. In the case of urban rail systems, lighter equipment, higher power/weight ratiosto provide rapid acceleration, and numerous vertical controls (station elevations,streets to be passed over or under, etc.) account for the decision to allow steepermaximum grades.In the case of runways used by aircraft with approach speeds of 121 knots ormore, the maximum grade at any point is limited to 1.5 percent, and grades exceeding0.8 percent are permitted only on the inner two quarters of the runway.Minimum grades are sometimes specified for highways. These are normally intended to provide for drainage on curbed facilities. On such facilities, the grade of theedge of shoulder is normally the same as the profile grade, so that the centerline musthave some minimum grade. For curbed roadways, AASHTO recommends a minimumgrade of 0.50 percent, unless pavements are constructed with a high degree of qualitycontrol, in which case 0.30 percent is acceptable.
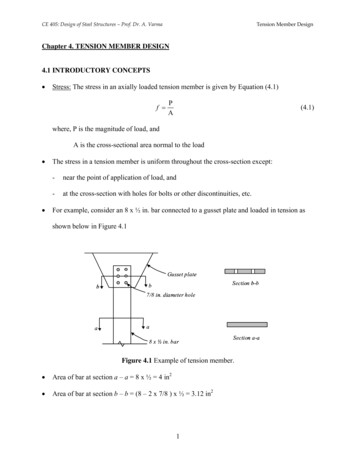
ban31881 ch04.qxd6/14/01689:07 AMCHAPTERg14:Page 68Geometric DesignBVCElevation yEVCg2Point TxP.I.L/ 2LFIGURE 4.7Symmetrical vertical curve.4.2.2 Vertical CurvesVertical tangents with different grades are joined by vertical curves such as the oneshown in Figure 4.7.Vertical curves are normally parabolas centered about the point of intersection(P.I.) of the vertical tangents they join. Vertical curves are thus of the formy y0 g1x rx22(4.1)where y elevation of a point on the curvey0 elevation of the beginning of the vertical curve (BVC)g1 grade just prior to the curvex horizontal distance from the BVC to the point on the curver rate of change of gradeThe rate of change of grade, in turn, is given byr g2 g1L(4.2)where g2 is the grade just beyond the end of the vertical curve (EVC) and L is thelength of the curve. Also, vertical curves are sometimes described by K, the reciprocalof r. K is the distance in meters required to achieve a 1 percent change in grade. Vertical curves are classified as sags where g2 g1 and crests otherwise. Note that r (andhence the term rx2 2) will be positive for sags and negative for crests.Also note that vertical distances in the vertical curve formulas are the product ofgrade times a horizontal distance. In consistent units, if vertical distances are to be inmeters, horizontal distances should also be in meters, and grades should be dimensionless ratios. In many cases, however, it is more convenient to represent grades inpercent and horizontal distance in stations. This produces the correct result, becausethe grade is multiplied by 100 and the horizontal distance divided by 100, and the twofactors of 100 cancel. It is very important not to mix the two methods, however. Ifgrades are in percent, horizontal distances must be in stations; likewise, if grades aredimensionless ratios, horizontal distances must be in meters.
ban31881 ch04.qxd6/14/019:07 AMPage 694.2 Vertical Alignment 69The parabola is selected as the vertical curve so that the rate of change of grade,which is the second derivative of the curve, will be constant with distance. Note thatthe first derivative is the grade itself, and since the rate of change of grade is constant,the grade of any point in the vertical curve is a linear function of the distance from theBVC to the point. That is,g dy g1 rxdx(4.3)The quantity rx2 2 is the distance from the tangent to the curve and is known asthe offset. If x is always measured from the BVC, the offset given by rx2 2 will bemeasured from the g1 tangent. To determine offsets from the g2 tangent, x should bemeasured backward from the EVC. Since the curve is symmetrical about its center, theoffsets from the g1 and g2 tangents, respectively, are also symmetrical about the centerof the curve, which occurs at the station of its P.I.Other properties of the vertical curve may be used to sketch it. For instance, at itscenter, the curve passes halfway between the P.I. and a chord joining the BVC andEVC. At the quarter points, it passes one quarter of the way between the tangents andthe chord. Normal drafting practice is to show the P.I. by means of a triangular symbol,as in Figure 4.7, although the extended vertical tangents shown in the figure are oftenomitted. The BVC and EVC are shown by means of circular symbols. The P.I., BVC,and EVC are identified by notes. The stations of the BVC and EVC are given in notes,as are the station and elevation of the P.I., the two tangent grades, and the length of thevertical curve.Elevations on vertical curves are easily calculated by means of a calculator, computer, or spreadsheet program. One traditional way of representing them is in the formof a table, such as Table 4.2. The table represents a 300 m sag vertical curve betweenTABLE 4.2Tabular form for profile calculations in vertical curveStationGrade99 75100 00100 25100 50100 75101 00101 25101 50101 75102 00102 25102 50102 75103 00103 25 1%BVCP.I.EVC 1.00151.25151.50153.00154.50156.00
These basic elements are common to all linear facilities, such as roadways, railways, and airport runways and taxiways. Although the details of design standards vary with the mode and the class of facility, most of the issues involved in geometric design are similar for all modes. In all cases, the goals of geometric design are to max- imize the comfort, safety, and economy of facilities .